5790 Summer Ln · Cherryville, NC
Flood risk 1/10 · Minimal
- FEMA flood zone
- X (unshaded)
- Chance of flooding over 30 yrs
- 0.0%
- Est. flood insurance / yr
- $507 – $1,088
Fire risk 4/10 · Minor
- Est. fire insurance / yr
- $906 – $1,684
Heat risk 5/10 · Moderate
- Hot days now (above 103°F)
- 7 days/yr
- Hot days in 30 yrs
- 17 days/yr
Wind risk 3/10 · Minor
- Chance of severe wind over 30 yrs
- 5.0%
Air-quality risk 3/10 · Minor
- Unhealthy air days now
- 3 days/yr
- Unhealthy air days in 30 yrs
- 3 days/yr
Risk factors via First Street. Map © Google.
Why this score? — see what drove the C- grade
The composite is a weighted blend of 9 inputs, each scored 0–100. Each bar is that input's sub-score; the figure is the points it added to the 100-point composite (weight × sub-score).
- Cash flow +18.7/30.0
- ARV discount +7.5/15.0
- DSCR +5.9/10.0
- 1% rule +5.0/10.0
- Schools +4.8/10.0
- Livability +3.7/5.0
- Rent growth +2.5/5.0
- Condition / age +2.5/5.0
- Appreciation +0.0/10.0
$120,000
🖨 Deal sheet 📄 Offer letter ✓ Due diligence
Listing remarks
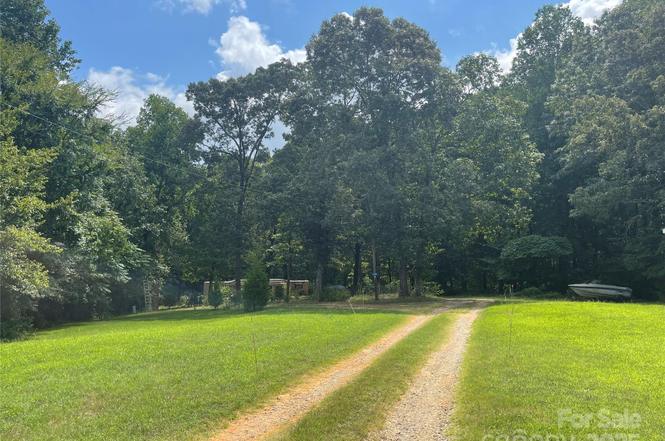
Tucked away at the end of a quiet road, this charming manufactured home offers the perfect blend of privacy and space. Nestled on 1.88 acres of gently rolling land, this property is an ideal opportunity for those seeking a quiet escape with room to roam. Step inside to discover a cozy and functional layout, ready for your personal touch. Whether you're looking for a peaceful place to call home or a private weekend getaway, this property has endless potential. Enjoy the serenity of country living while still being just a short drive from downtown Cherryville and local amenities. No through traffic means a quieter environment, perfect for relaxing evenings or outdoor activities. Don’t m
Key facts
- 1.88 acres
- Privacy
- 1.88 acre lot
Tags
Property features AI
Finance
- HOA & community: No HOA dues
Exterior
- Parking: Driveway
- Utilities: Water from a well; Septic system installed
- Home design: Manufactured singlewide home; Residential single-family property; One level
- Construction: Manufactured construction; Aluminum exterior; Rubber roof; Pillar/post/pier foundation; Property completed
- Exterior features: Lot includes green area and wooded sections; Shed(s) on the property; Road surface is dirt and gravel; Publicly maintained road access
Interior
- Kitchen: Electric range; Refrigerator
- Bedrooms: 2 bedrooms on the main level
- Flooring: Tile flooring; Linoleum flooring
- Bathrooms: 2 full bathrooms on the main level
- Heating & cooling: Oil heating; Window air conditioning units
- Interior features: 6 total rooms; Appliances included: Dryer, Electric range, Refrigerator
- Laundry & utility: Laundry located inside; Dryer included
Neighborhood map
What this means for you Summary
Snapshot
- This is a 2-bed/2.0-bath single-family listed at $120k.
Deal economics
- At list price, monthly cash flow is $119 ($1k/yr) — positive.
- The deal already cash-flows at list — no discount required.
- To meet the 1% rule (rent ≥ 1% of price), the offer needs to be $120k (0.0% below list).
- Recommended offer: $106k (12.0% below list) — sets the bar for market timing.
- Cap rate 7.5% vs local median 4.4% in Cherryville — top-decile yield for the area; either an underpriced asset or a hidden risk that comps aren't pricing in. Stress-test before assuming the spread holds.
Location & tenants
- Location reads 74/100 on livability (#59 in NC, #4,744 nationally) — a middle-class / working-renter tenant base. Strengths: cost of living A+, housing A+, health & safety A+; Watch: amenities F, commute F.
- Lincoln County Schools (rural): math 57% / reading 55% proficiency, ranked #42 of 178 in NC (top 24%) — acceptable for families but not a draw, mixed tenant base, ~2y average lease.
- Zoned schools: North Brook Elementary (math 52% / reading 47%, grade D, #417 of 1,410 statewide, top 32%, 364 students, 67% FRL); West Lincoln High (math 57% / reading 57%, grade C, #248 of 535 statewide, top 48%, 756 students, 52% FRL) — zoned schools average 59% FRL vs 41% district-wide (18 pts higher); higher-poverty schools than district average — tighter screening recommended.
- Market conditions: 125 active listings in the ZIP; 697 units permitted in Lincoln County in 2024 (0 in 5+ unit buildings).
Forward outlook
- Local home prices are declining (-3.0%/yr); year-one equity from $830 of loan paydown is wiped out by about $4k of value loss. Plan a longer hold.
- Lincoln County population projected at +8% by 2050 — modest demand growth; plan on rents tracking national, not racing it.
Negotiation context
- It's been on market 328 days — a 12% lower offer ($106k) is reasonable based on typical stale-listing flexibility.
Risks & watch-outs
- Climate carrying-cost: extreme-heat days projected 7→17/yr by 2055 (HVAC capex compounding) — expect insurance premiums to compound above CPI over the hold.
Questions for the listing agent
- It's been on market 328 days. Have you received any prior offers? Is the seller open to a 12% concession, seller financing, or rate buy-down credit?
- Built in 1970 — when were the roof, HVAC, electrical panel, plumbing, and water heater last replaced?
- Why hasn't it sold? Are there any deal-killer items the seller is aware of (foundation, flood, title, zoning, code violations)?
- Is there a deadline driving the sale (1031 exchange, divorce, estate, relocation)? That informs how much negotiation room exists.
- Schools are D-rated, which usually means shorter tenancies and higher turnover. Who's the typical renter profile here, and what's been the actual vacancy rate?
- What's the average days-on-market for RENTAL listings here right now (not sales)? A rising rental-DOM trend means longer vacancies and softer asking-rent achievability than the comps imply.
- What's the recent tenant-quality profile in this submarket — average credit score on applications, eviction rate, late-payment / NSF rate, and stable-employment percentage? A property-management company in the area should have these aggregated.
- How much new for-sale + rental construction is in the pipeline within 1–3 miles? Heavy new supply typically softens prices + rents 12–24 months out; constrained supply supports both.
Investment metrics
- 1% rule
- 1.00% ✗
- Cap rate
- 7.48%
- Cash-on-cash
- 4.24%
- DSCR
- 1.19
- GRM
- 8.3
CMA / ARV
No comps found within radius.
Projected returns pro-forma
-3.0% appreciation · 3.0% rent growth · sell at horizon
- IRR
- -9.7%
- Equity multiple
- 0.65×
- Total profit
- $-11,871
- Equity at exit
- $17,892
- IRR
- -0.2%
- Equity multiple
- 0.98×
- Total profit
- $-534
- Equity at exit
- $10,375
Cash invested: $33,600 (down + closing). Projections, not guarantees.
Landlord ↔ Tenant lean methodology
- Overall (STATE)
- 85 Strongly Landlord-Friendly
- State North Carolina
- 85 Strongly Landlord-Friendly · R+3
- County
- — inherits STATE
- City
- — inherits STATE
ZIP-level market 28021
- Home prices YoY
- -20.8%
- Active inventory
- 125
- Price-to-rent
- 8.3×
Monthly cashflow live
- Estimated rent
- $1,200 medium interval (Pro) →
- Mortgage (P&I)
- −$629
- Tax est. 1.5%
- −$150 /mo · $1,800/yr
- Insurance
- −$50
- HOA
- −$0
- Vacancy / Maint / Mgmt
- −$252
- Net cashflow
- $119
Break-even live
UW: 25.0% down · 7.5% · 30yr · 1.5% tax · 5.0% vac · 8.0% maint · 8.0% mgmt
Financing live
Cash to close
- Down payment
- $30,000
- Closing costs
- $3,600
- Reserves months
- —
- Total cash needed
- —
Loan-product check · same deal, 3 products live
Conventional
25% down · 7.5% · 30yr
- Down + closing
- —
- Monthly P&I
- —
- Monthly cashflow
- —
- DSCR
- —
- Eligible?
- —
Personal DTI + credit; lowest rate.
DSCR
20% down · 8.5% · 30yr
- Down + closing
- —
- Monthly P&I
- —
- Monthly cashflow
- —
- DSCR
- —
- Eligible?
- —
No personal income docs; deal must DSCR.
Hard money
10% down · 12.0% · 12mo
- Down + closing
- —
- Monthly P&I
- —
- Monthly cashflow
- —
- DSCR
- —
- Eligible?
- —
Short-term bridge; refi at stabilization.
Listing history 15 events
-
2026-06-18days on market $120,000 Active 328 DOM
-
2026-06-17days on market $120,000 Active 327 DOM
-
2026-06-16days on market $120,000 Active 326 DOM
-
2026-06-15days on market $120,000 Active 325 DOM
-
2026-06-13days on market $120,000 Active 323 DOM
-
2026-06-09days on market $120,000 Active 319 DOM
-
2026-06-08days on market $120,000 Active 318 DOM
-
2026-06-07days on market $120,000 Active 317 DOM
-
2026-06-04days on market $120,000 Active 314 DOM
-
2026-06-03days on market $120,000 Active 313 DOM
-
2026-06-02days on market $120,000 Active 312 DOM
-
2026-06-01days on market $120,000 Active 311 DOM
-
2026-05-31days on market $120,000 Active 310 DOM
-
2025-08-20price $120,000
-
2025-07-25$90,000 Active
ⓘ Source: listings_history table (triggers on properties + properties_extension) + one-shot
backfill from property_details.listing_events for pre-trigger history.
Climate risk First Street
- Flood 1/10 Low FEMA zone X (unshaded) · 0% chance over 30 yrs
- Wildfire 4/10 Moderate
- Heat 5/10 Major 7 d/yr ≥103°F today · 17 d/yr by 30 yrs out
- Wind 3/10 Moderate 5% chance of damaging wind over 30 yrs
- Air quality 3/10 Moderate 3 unhealthy d/yr today · 3 by 30 yrs out
Nearby sold comps map
Loading sold comps map…
Walkable amenities ~0.75 mi
Loading nearby amenities…
Taxation est. · year 1
- Rental income
- $14,399
- − Mortgage interest
- −$6,722
- − Property taxes
- −$1,800
- − Insurance
- −$600
- − Repairs & maintenance
- −$1,152
- − Management
- −$1,152
- − Depreciation
- −$3,491
- Taxable loss
- −$518
- Est. tax savings @ 24.0%
- +$124
- After-tax cash flow
- $1,548/yr
For passive investors: Depreciation is non-cash, so a rental often shows a tax loss while cash-flowing — sheltering income. Rental losses are passive: they offset passive income freely, and up to $25,000/yr can offset ordinary (W-2) income if you actively participate and your MAGI is under $100k (phasing out to $0 by $150k); unused losses carry forward. On sale, claimed depreciation is recaptured at up to 25%, and gains may owe capital-gains tax (a 1031 exchange can defer both). Figures are a year-1 estimate at your 24.0% rate — not tax advice; consult a CPA.
Schools (NCES district)
- District
- Lincoln County Schools
- NCES district ID
- 3702680
- Math proficiency
- 57% ▲ 7.00%
- Reading proficiency
- 55% ▲ 1.00%
- Median HH income
- $49,203
- Composite
- 47.7/100
- National rank
- #2242
- State rank
- #42 of 178 in NC
Livability — Cherryville
- Score
- 74/100
- State rank
- #59
- US rank
- #4744
Category grades
Schools grade is shown separately in the Schools card above.
Census & demographics
- Population (ZIP)
- 13,668
Population outlook (Lincoln County) Hauer SSP2
- Today (2025)
- 86,972 people
- By 2030
- 89,467 · +2.9%
- By 2040
- 93,107 · +7.1%
- By 2050
- 94,304 · +8.4%
- By 2075
- 95,190 · +9.4%
- By 2100
- 90,096 · +3.6%
Race, ethnicity, and origin ACS 2023
- Neighborhood character
- Predominantly White (90%)
- Race & ethnicity
- White 90% Hispanic / Latino 4% Two or more races 4% Black 3%
- Common ancestry
- Serbian 3% Slovak 2% Lithuanian 2%
- Foreign-born
- 1% · Canada
- Languages at home
- 98% English-only · Spanish 2%
Political lean MEDSL · Lincoln
- 2024 margin
- Solid R (+45.7) · D 26.8% · R 72.5%
- 2008→2024 swing
- -12.4pp toward R · 2008: -33.3pp · 2024: -45.7pp
- All cycles
- 2024: R+45.7 2020: R+45.9 2016: R+47.7 2012: R+38.9 2008: R+33.3
Not yet ingested
- Civics
- —
Market trends
- HPI YoY
- ▼ -77.53%
- Current HPI
- 294.7695
- Rent YoY
- —
- Metro
- —
- State GDP YoY
- ▲ 3.28%
- F500 in state
- 26
Industry mix (Fortune 500 HQ in NC)
| Industry | F500 HQs | Revenue |
|---|---|---|
| Financial Services | 2 | $213B |
|
||
| Retail | 2 | $95B |
|
||
| Industrial Conglomerate | 1 | $38B |
|
||
| Metals / Steel | 1 | $35B |
|
||
| Utilities | 1 | $30B |
|
||
| Industrial Machinery | 1 | $19B |
|
||
Price history
+33.3% since first listed2 events — show timeline
- 2025-08-20 Price Changed $120,000 CANOPYMLS as Distributed by MLS Grid
- 2025-07-25 Listed $90,000 CANOPYMLS as Distributed by MLS Grid
Cash-flow waterfall
monthlySold comps — $/sqft
last 12 mo · ≤1 miLoading sold comps…