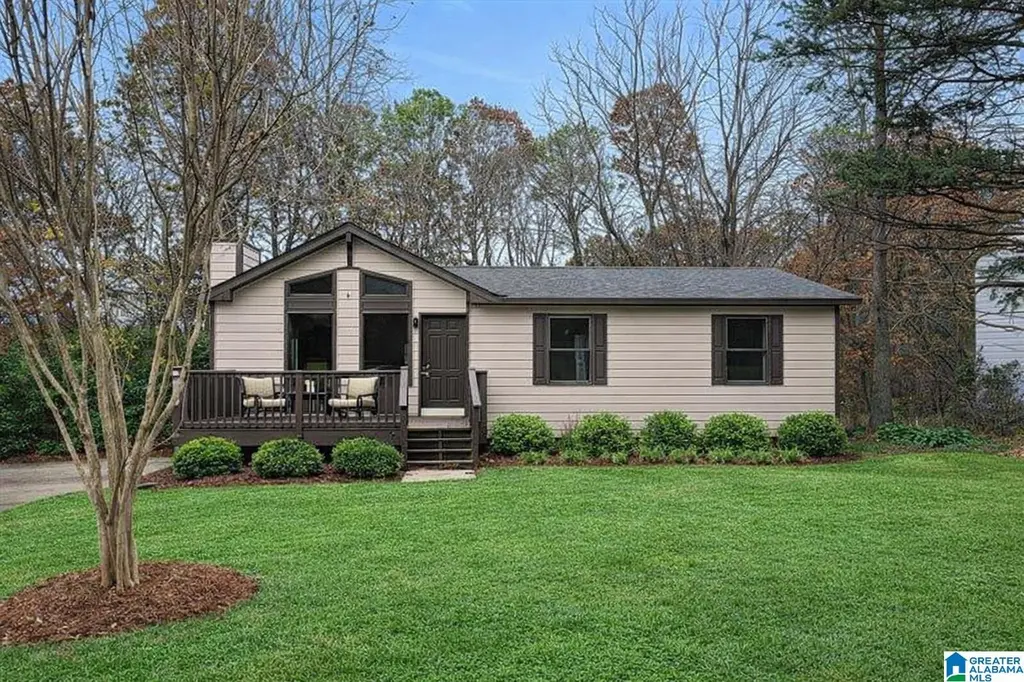
784 15th Ct · Birmingham, AL
Flood risk 1/10 · Minimal
- FEMA flood zone
- X (unshaded)
- Chance of flooding over 30 yrs
- 0.0%
- Est. flood insurance / yr
- $507 – $1,088
Fire risk 3/10 · Minor
- Est. fire insurance / yr
- $916 – $1,700
Heat risk 6/10 · Moderate
- Hot days now (above 106°F)
- 7 days/yr
- Hot days in 30 yrs
- 19 days/yr
Wind risk 6/10 · Moderate
- Chance of severe wind over 30 yrs
- 27.0%
Air-quality risk 5/10 · Moderate
- Unhealthy air days now
- 7 days/yr
- Unhealthy air days in 30 yrs
- 9 days/yr
Risk factors via First Street. Map © Google.
Why this score? — see what drove the C- grade
The composite is a weighted blend of 9 inputs, each scored 0–100. Each bar is that input's sub-score; the figure is the points it added to the 100-point composite (weight × sub-score).
- Cash flow +18.1/30.0
- ARV discount +12.6/15.0
- DSCR +5.7/10.0
- 1% rule +4.2/10.0
- Livability +3.4/5.0
- Rent growth +3.3/5.0
- Condition / age +2.5/5.0
- Schools +0.9/10.0
- Appreciation +0.0/10.0
$139,900
🖨 Deal sheet 📄 Offer letter ✓ Due diligence
Listing remarks MLS
Move in ready home that has recently been updated! This home features 3 bedrooms & 1 full bathroom on large lot with fenced back yard. Oversized front porch leads to entryway into the living room with stone fireplace & vaulted ceilings with exposed wood beam. Updated flooring, paint & light fixtures throughout. Dining room opens to updated kitchen with some new cabinets & countertop. Laundry room off of kitchen for extra storage & access to the side deck for grilling. There are 3 good sized bedrooms with closets & they share the full hall bathroom with a tub/shower combo. Out back features a large back yard and a private wooded view. Convenient location with only 6 minutes to Sun Valley Elm school & 20 mins to downtown Birmingham!
Key facts
- 0.28 acre lot
- Built 1981
- Listed 65 days
Neighborhood map
What this means for you Summary
Snapshot
- This is a 3-bed/1.0-bath single-family listed at $140k.
Deal economics
- At list price, monthly cash flow is $123 ($1k/yr) — positive.
- The deal already cash-flows at list — no discount required.
- To meet the 1% rule (rent ≥ 1% of price), the offer needs to be $128k (8.2% below list).
- Recommended offer: $128k (8.2% below list) — sets the bar for 1% rule.
Location & tenants
- Location reads 67/100 on livability (#78 in AL) — a middle-class / working-renter tenant base. Strengths: commute A+, cost of living A+, housing A+; Watch: amenities C-, schools F, crime F.
- Birmingham City (urban): math 4% / reading 20% proficiency, ranked #116 of 129 in AL (top 90%) — low school quality limits family demand, transient renter base, plan for 1-2y turnover; 82% free/reduced lunch — lower-income household profile, screen leases tightly.
- Market conditions: Rents rising (+3.0%/yr); 334 active listings in the ZIP; 40 comparable units currently listed for rent nearby; rentals at typical pace (median 24d on market — plan ~3-4 weeks tenant-placement turnaround); 2,114 units permitted in Jefferson County in 2024 (556 in 5+ unit buildings).
Forward outlook
- Local home prices are declining (-3.0%/yr); year-one equity from $967 of loan paydown is wiped out by about $4k of value loss. Plan a longer hold.
- Jefferson County population projected to shrink 4% by 2050 — rents likely to lag national; underwrite the cash flow, not the appreciation.
Negotiation context
- It's been on market 65 days — a 6% lower offer ($132k) is reasonable based on typical stale-listing flexibility.
- 2 sale attempts with the ask held roughly flat each time — persistent listings suggest the price (not the market) is what's stuck; bring a comps-based counter.
- Current owner paid $52k; list at $140k implies a 167% gain — meaningful room to come down on a strong offer.
Risks & watch-outs
- Climate carrying-cost: major wind risk, 27% chance of damaging wind over 30y; extreme-heat days projected 7→19/yr by 2055 (HVAC capex compounding) — expect insurance premiums to compound above CPI over the hold.
Questions for the listing agent
- It's been on market 65 days. Have you received any prior offers? Is the seller open to a 8% concession, seller financing, or rate buy-down credit?
- Why hasn't it sold? Are there any deal-killer items the seller is aware of (foundation, flood, title, zoning, code violations)?
- Is there a deadline driving the sale (1031 exchange, divorce, estate, relocation)? That informs how much negotiation room exists.
- Schools are F-rated, which usually means shorter tenancies and higher turnover. Who's the typical renter profile here, and what's been the actual vacancy rate?
- Crime grade is F in this area — have there been break-ins, vandalism, or insurance claims at this property in the last 3 years? What carrier currently insures it and at what premium?
- What's the average days-on-market for RENTAL listings here right now (not sales)? A rising rental-DOM trend means longer vacancies and softer asking-rent achievability than the comps imply.
- What's the recent tenant-quality profile in this submarket — average credit score on applications, eviction rate, late-payment / NSF rate, and stable-employment percentage? A property-management company in the area should have these aggregated.
- How much new for-sale + rental construction is in the pipeline within 1–3 miles? Heavy new supply typically softens prices + rents 12–24 months out; constrained supply supports both.
Investment metrics
- 1% rule
- 0.92% ✗
- Cap rate
- 7.34%
- Cash-on-cash
- 3.76%
- DSCR
- 1.17
- GRM
- 9.1
CMA / ARV
- ARV (median comp)
- $157,647
- List price
- $139,900
- Delta
- -11.26%
- Verdict
- UNDERPRICED
- Comps
- 20 within 1.0 mi
Show comp detail 12 sales within ~0.75 mi
| Address | Dist | Beds/Ba | Sqft | Sold | Price | $/sf | Match |
|---|---|---|---|---|---|---|---|
| 616 15th Ave NW | 0.49mi | 3/2.0 | 1,157 (+0%) | 10mo | $133,500 | $115 | 65 |
| 1209 Rose Lynn Ln | 0.57mi | 3/1.0 | 1,080 (-6%) | 0mo | $150,000 | $139 | 63 |
| 1240 Lynn Acres Dr | 0.48mi | 3/1.5 | 1,224 (+6%) | 6mo | $168,000 | $137 | 60 |
| 1360 5th Pl NW | 0.71mi | 3/1.0 | 1,220 (+6%) | 1mo | $92,500 | $76 | 56 |
| 1128 Cardwell Ln | 0.73mi | 3/1.0 | 1,225 (+6%) | 4mo | $93,500 | $76 | 53 |
| 524 16th Ave NW | 0.67mi | 3/1.5 | 1,093 (-5%) | 10mo | $146,000 | $134 | 49 |
| 536 16th Ter NW | 0.70mi | 3/2.0 | 1,225 (+6%) | 7mo | $155,000 | $127 | 48 |
| 628 16th Ct NW | 0.45mi | 3/2.0 | 1,323 (+14%) | 5mo | $165,000 | $125 | 46 |
| 1529 5th Pl NW | 0.69mi | 3/1.0 | 1,055 (-9%) | 9mo | $88,000 | $83 | 46 |
| 1220 Lynn Acres Dr | 0.56mi | 3/2.0 | 1,300 (+13%) | 9mo | $160,000 | $123 | 42 |
| 549 16th Ave NW | 0.59mi | 3/2.0 | 1,314 (+14%) | 8mo | $174,900 | $133 | 39 |
| 1361 5th Pl NW | 0.73mi | 3/1.0 | 989 (-14%) | 12mo | $110,000 | $111 | 32 |
Match score weights: distance 35% · size 25% · config 20% · recency 20%. Top-matched comps best support the ARV.
Projected returns pro-forma
-3.0% appreciation · 3.04% rent growth · sell at horizon
- IRR
- -10.4%
- Equity multiple
- 0.62×
- Total profit
- $-14,835
- Equity at exit
- $20,860
- IRR
- -1.0%
- Equity multiple
- 0.93×
- Total profit
- $-2,759
- Equity at exit
- $12,096
Cash invested: $39,172 (down + closing). Projections, not guarantees.
Landlord ↔ Tenant lean methodology
- Overall (STATE)
- 90 Strongly Landlord-Friendly
- State Alabama
- 90 Strongly Landlord-Friendly · R+15
- County
- — inherits STATE
- City
- — inherits STATE
ZIP-level market 35215
- Home prices YoY
- -34.4%
- Rents YoY
- 3.0%
- Active inventory
- 334
- Price-to-rent
- 9.1×
Monthly cashflow live
- Estimated rent
- $1,284 high interval (Pro) →
- Mortgage (P&I)
- −$734
- Tax from tax record
- −$100 /mo · $1,199/yr
- Insurance
- −$58
- HOA
- −$0
- Vacancy / Maint / Mgmt
- −$270
- Net cashflow
- $123
Break-even live
UW: 25.0% down · 7.5% · 30yr · 1.5% tax · 5.0% vac · 8.0% maint · 8.0% mgmt
Financing live
Cash to close
- Down payment
- $34,975
- Closing costs
- $4,197
- Reserves months
- —
- Total cash needed
- —
Loan-product check · same deal, 3 products live
Conventional
25% down · 7.5% · 30yr
- Down + closing
- —
- Monthly P&I
- —
- Monthly cashflow
- —
- DSCR
- —
- Eligible?
- —
Personal DTI + credit; lowest rate.
DSCR
20% down · 8.5% · 30yr
- Down + closing
- —
- Monthly P&I
- —
- Monthly cashflow
- —
- DSCR
- —
- Eligible?
- —
No personal income docs; deal must DSCR.
Hard money
10% down · 12.0% · 12mo
- Down + closing
- —
- Monthly P&I
- —
- Monthly cashflow
- —
- DSCR
- —
- Eligible?
- —
Short-term bridge; refi at stabilization.
Rent comps 40 comps
| Address | Beds | Baths | Sqft | Rent | $/sqft | DOM | Units | Dist |
|---|---|---|---|---|---|---|---|---|
| 769 15th Ct NW Birmingham, AL | 3.0 | 1.5 | 1130 | $1,310 | $1.16 | 11d | 1 | 0.08mi |
| 621 15th Ave NW Birmingham, AL | 4.0 | 2.0 | 1070 | $1,200 | $1.12 | 16d | 1 | 0.49mi |
| 1612 Glenwood St NW Center Point, AL | 4.0 | 3.0 | 1344 | $1,480 | $1.10 | 23d | 1 | 0.68mi |
| 500 15th Ave NW Center Point, AL | 3.0 | 1.0 | 1079 | $1,050 | $0.97 | 3d | 1 | 0.69mi |
| 1356 5th Pl NW Center Point, AL | 3.0 | 1.0 | 1064 | $1,105 | $1.04 | 43d | 1 | 0.73mi |
| 1732 6th St NW Center Point, AL | 3.0 | 1.5 | 1300 | $1,250 | $0.96 | 3d | 1 | 0.76mi |
| 1328 5th Pl NW Center Point, AL | 3.0 | 1.0 | 1250 | $1,050 | $0.84 | 16d | 1 | 0.77mi |
| 1801 Carson Rd Unit 2 Birmingham, AL | 2.0 | 1.0 | 800 | $600 | $0.75 | 10d | 1 | 0.77mi |
| 1333 5th Pl NW Center Point, AL | 3.0 | 2.0 | 1056 | $1,275 | $1.21 | 43d | 1 | 0.78mi |
| 1821 Carson Rd Unit 2 Birmingham, AL | 2.0 | 1.5 | 800 | $765 | $0.96 | 43d | 1 | 0.81mi |
| 1821 Carson Rd Unit 3 Birmingham, AL | 2.0 | 1.5 | 800 | $580 | $0.72 | 21d | 1 | 0.81mi |
| 1305 5th Pl NW Center Point, AL | 3.0 | 2.0 | 1092 | $1,200 | $1.10 | 43d | 1 | 0.82mi |
| 217 Killough Dr Birmingham, AL | 3.0 | 2.0 | 1212 | $1,200 | $0.99 | 14d | 1 | 0.82mi |
| 1301 5th Pl NW Center Point, AL | 3.0 | 1.0 | 1170 | $1,100 | $0.94 | 3d | 1 | 0.83mi |
| 1827 Carson Rd Unit 7 Birmingham, AL | 3.0 | 2.5 | 1332 | $950 | $0.71 | 23d | 1 | 0.83mi |
| 1827 Carson Rd Unit 1 Birmingham, AL | 3.0 | 2.5 | 1332 | $1,125 | $0.84 | 43d | 1 | 0.84mi |
| 400 13th Ave NW Birmingham, AL | 2.0 | 1.0 | 1100 | $890 | $0.81 | 43d | 1 | 0.86mi |
| 434 15th Ter NW Center Point, AL | 3.0 | 2.0 | 1053 | $1,200 | $1.14 | 43d | 1 | 0.88mi |
| 1208 Americana Dr Birmingham, AL | 3.0 | 2.0 | 1104 | $1,631 | $1.48 | 11d | 1 | 0.90mi |
| 1232 Oakwood St Birmingham, AL | 3.0 | 1.5 | 1301 | $1,223 | $0.94 | 23d | 1 | 0.95mi |
| 1700 4th Pl NW Center Point, AL | 3.0 | 1.0 | 914 | $1,075 | $1.18 | 23d | 1 | 0.98mi |
| 1712 4th Pl NW Center Point, AL | 3.0 | 1.0 | 1182 | $1,150 | $0.97 | 23d | 1 | 0.98mi |
| 324 13th Ter NW Center Point, AL | 3.0 | 1.5 | 1418 | $1,295 | $0.91 | 23d | 1 | 1.01mi |
| 241 Mamie Ln Birmingham, AL | 3.0 | 2.0 | 1242 | $1,495 | $1.20 | 3d | 1 | 1.02mi |
| 405 13th Ct NW Center Point, AL | 4.0 | 1.5 | 1248 | $1,415 | $1.13 | 21d | 1 | 1.03mi |
| 1225 Birchwood St Birmingham, AL | 3.0 | 2.0 | 1092 | $1,175 | $1.08 | 3d | 1 | 1.04mi |
| 1617 3rd Pl NW Center Point, AL | 3.0 | 2.0 | 1404 | $1,150 | $0.82 | 23d | 1 | 1.06mi |
| 1237 Linwood St Birmingham, AL | 3.0 | 1.5 | 1066 | $995 | $0.93 | 43d | 1 | 1.07mi |
| 433 Orchid Rd Birmingham, AL | 3.0 | 1.0 | 1162 | $1,255 | $1.08 | 16d | 1 | 1.09mi |
| 848 Old Trail Rd Birmingham, AL | 2.0 | 1.5 | 930 | $925 | $0.99 | 23d | 1 | 1.13mi |
| 1153 Linwood St Birmingham, AL | 3.0 | 2.0 | 1250 | $1,295 | $1.04 | 3d | 1 | 1.14mi |
| 46 Sunscape Dr Birmingham, AL | 4.0 | 2.0 | 1178 | $1,450 | $1.23 | 43d | 1 | 1.15mi |
| 405 18th Ave NW Center Point, AL | 3.0 | 2.0 | 1162 | $1,299 | $1.12 | 43d | 1 | 1.15mi |
| 40 Sunscape Dr Birmingham, AL | 3.0 | 2.0 | 1283 | $1,555 | $1.21 | 1d | 1 | 1.17mi |
| 1112 Violet Dr Birmingham, AL | 3.0 | 2.0 | 1414 | $1,600 | $1.13 | 11d | 1 | 1.20mi |
| 108 13th Ave NW Center Point, AL | 4.0 | 2.0 | 1444 | $1,265 | $0.88 | 23d | 1 | 1.21mi |
| 4141 Pinson Valley Pkwy Birmingham, AL | 1.0–3.0 | 1.0–2.0 | 868 | $1,299 | $1.50 | 43d | 1 | 1.21mi |
| 208 Sam Pate Dr Birmingham, AL | 3.0 | 2.0 | 988 | $1,385 | $1.40 | 2d | 1 | 1.25mi |
| 120 Shawnee Ln NW Birmingham, AL | 3.0 | 1.0 | 1120 | $1,075 | $0.96 | 43d | 1 | 1.30mi |
| 305 18th Ct NW Center Point, AL | 3.0 | 1.5 | 1270 | $1,100 | $0.87 | 43d | 1 | 1.31mi |
Listing history 22 events
-
2026-06-18days on market $139,900 Active 65 DOM
-
2026-06-17days on market $139,900 Active 64 DOM
-
2026-06-16days on market $139,900 Active 63 DOM
-
2026-06-15days on market $139,900 Active 62 DOM
-
2026-06-13days on market $139,900 Active 60 DOM
-
2026-06-10days on market $139,900 Active 57 DOM
-
2026-06-09days on market $139,900 Active 56 DOM
-
2026-06-08days on market $139,900 Active 55 DOM
-
2026-06-07days on market $139,900 Active 54 DOM
-
2026-06-03days on market $139,900 Active 50 DOM
-
2026-06-02days on market $139,900 Active 49 DOM
-
2026-06-01days on market $139,900 Active 48 DOM
-
2026-05-31days on market $139,900 Active 47 DOM
-
2026-05-14historical $1,300
-
2026-04-14$139,900 Active 782-char remark
Show marketing remark (782 chars)
Move in ready home that has recently been updated! This home features 3 bedrooms & 1 full bathroom on large lot with fenced back yard. Oversized front porch leads to entryway into the living room with stone fireplace & vaulted ceilings with exposed wood beam. Updated flooring, paint & light fixtures throughout. Dining room opens to updated kitchen with some new cabinets & countertop. Laundry room off of kitchen for extra storage & access to the side deck for grilling. There are 3 good sized bedrooms with closets & they share the full hall bathroom with a tub/shower combo. Out back features a large back yard and a private wooded view. Convenient location with only 6 minutes to Sun Valley Elm school & 20 mins to downtown Birmingham!
-
2026-04-03$1,300
-
2026-02-17price $134,900
-
2026-02-04price $138,000
-
2025-09-10soldstatus $52,323
-
2006-09-29soldstatus $74,000
-
1996-07-22soldstatus $53,850
-
1989-01-19soldstatus $51,369
ⓘ Source: listings_history table (triggers on properties + properties_extension) + one-shot
backfill from property_details.listing_events for pre-trigger history.
Tax reassessment forecast AL · Resets to sale price
- Current annual tax
- $1,199 · $100/mo
- Projected year-2 tax
- $1,199 · $100/mo
- Expected delta
- $0/yr ($0/mo · 0.0%)
ⓘ Screening estimate from a state-policy table — verify with the county assessor before closing.
Climate risk First Street
- Flood 1/10 Low FEMA zone X (unshaded) · 0% chance over 30 yrs
- Wildfire 3/10 Moderate
- Heat 6/10 Major 7 d/yr ≥106°F today · 19 d/yr by 30 yrs out
- Wind 6/10 Major 27% chance of damaging wind over 30 yrs
- Air quality 5/10 Major 7 unhealthy d/yr today · 9 by 30 yrs out
Nearby sold comps map
Loading sold comps map…
Walkable amenities ~0.75 mi
Loading nearby amenities…
Taxation est. · year 1
- Rental income
- $15,410
- − Mortgage interest
- −$7,837
- − Property taxes
- −$1,199
- − Insurance
- −$700
- − Repairs & maintenance
- −$1,233
- − Management
- −$1,233
- − Depreciation
- −$4,070
- Taxable loss
- −$861
- Est. tax savings @ 24.0%
- +$207
- After-tax cash flow
- $1,678/yr
For passive investors: Depreciation is non-cash, so a rental often shows a tax loss while cash-flowing — sheltering income. Rental losses are passive: they offset passive income freely, and up to $25,000/yr can offset ordinary (W-2) income if you actively participate and your MAGI is under $100k (phasing out to $0 by $150k); unused losses carry forward. On sale, claimed depreciation is recaptured at up to 25%, and gains may owe capital-gains tax (a 1031 exchange can defer both). Figures are a year-1 estimate at your 24.0% rate — not tax advice; consult a CPA.
Schools (NCES district)
- District
- Birmingham City
- NCES district ID
- 0100390
- Math proficiency
- 4% ▼ -17.00%
- Reading proficiency
- 20% ▼ -4.00%
- Median HH income
- $31,988
- Composite
- 9.49/100
- National rank
- #9850
- State rank
- #116 of 129 in AL
Livability — Birmingham
- Score
- 67/100
- State rank
- #78
- US rank
- #10412
Category grades
Schools grade is shown separately in the Schools card above.
Census & demographics
- Census place
- Birmingham, AL
- County
- Jefferson County · 527,445 people
- City population
- 210,422
- Metro
- Birmingham-Hoover, AL
- Population (ZIP)
- 43,903
- Household income
- $52,793
- Rent vs Own
- Severe rent burden
- 1729.0
Population outlook (Jefferson County) Hauer SSP2
- Today (2025)
- 669,185 people
- By 2030
- 669,694 · +0.1%
- By 2040
- 661,388 · -1.2%
- By 2050
- 643,086 · -3.9%
- By 2075
- 577,267 · -13.7%
- By 2100
- 474,758 · -29.1%
Race, ethnicity, and origin ACS 2023
- Neighborhood character
- Predominantly Black (75%)
- Race & ethnicity
- Black 75% White 15% Hispanic / Latino 7% Two or more races 3%
- Hispanic origin (detail)
- Mexican 4%
- Common ancestry
- Lithuanian 1% Italian 1% Slovak 1%
- Foreign-born
- 4% · Canada
- Languages at home
- 92% English-only · Spanish 7%
Political lean MEDSL · Jefferson
- 2024 margin
- D (+10.4) · D 54.6% · R 44.2% · Other 1.2%
- 2008→2024 swing
- +5.4pp toward D · 2008: 5.1pp · 2024: 10.4pp
- All cycles
- 2024: D+10.4 2020: D+13.2 2016: D+7.2 2012: D+6.0 2008: D+5.1
Not yet ingested
- Civics
- —
Market trends
- HPI YoY
- ▼ -112.97%
- Current HPI
- 215.0607
- Rent YoY
- ▲ 3.04%
- Metro
- Birmingham-Hoover, AL
- State GDP YoY
- ▲ 2.94%
- F500 in state
- 4
Industry mix (Fortune 500 HQ in AL)
| Industry | F500 HQs | Revenue |
|---|---|---|
| Financial Services | 1 | $8B |
|
||
| Healthcare | 1 | $5B |
|
||
Price history
-97.5% since first listed9 events — show timeline
- 2026-05-14 Rental Removed $1,300 TENANTTURNER2
- 2026-04-14 Listed $139,900 Greater Alabama MLS
- 2026-04-03 Listed for Rent $1,300 TENANTTURNER2
- 2026-02-17 Price Changed $134,900 Greater Alabama MLS
- 2026-02-04 Price Changed $138,000 Greater Alabama MLS
- 2025-09-10 Sold (Public Records) $52,323 Public Records
- 2006-09-29 Sold (Public Records) $74,000 Public Records
- 1996-07-22 Sold (Public Records) $53,850 Public Records
- 1989-01-19 Sold (Public Records) $51,369 Public Records
Property tax history
+3.7%/yrLatest (2025): $1,199 · +0.0% YoY. Source: county tax records.
Cash-flow waterfall
monthlySold comps — $/sqft
last 12 mo · ≤1 miLoading sold comps…