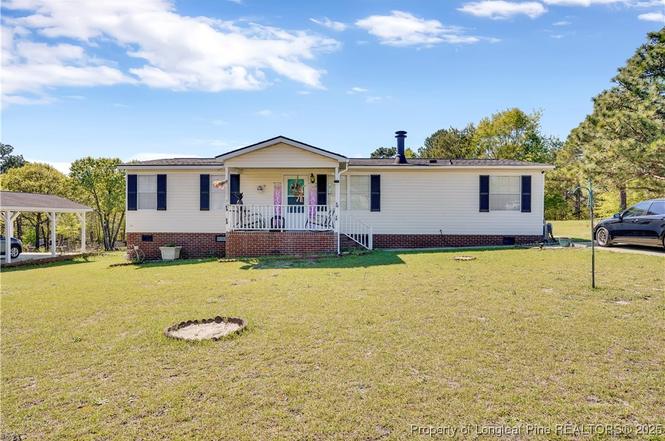
247 Eisler Dr · Lillington, NC
Flood risk 1/10 · Minimal
- FEMA flood zone
- X (unshaded)
- Chance of flooding over 30 yrs
- 0.0%
- Est. flood insurance / yr
- $507 – $1,088
Fire risk 7/10 · Major
- Est. fire insurance / yr
- $906 – $1,684
Heat risk 7/10 · Major
- Hot days now (above 105°F)
- 7 days/yr
- Hot days in 30 yrs
- 17 days/yr
Wind risk 6/10 · Moderate
- Chance of severe wind over 30 yrs
- 69.0%
Air-quality risk 2/10 · Minimal
- Unhealthy air days now
- 0 days/yr
- Unhealthy air days in 30 yrs
- 1 days/yr
Risk factors via First Street. Map © Google.
Why this score? — see what drove the C grade
The composite is a weighted blend of 9 inputs, each scored 0–100. Each bar is that input's sub-score; the figure is the points it added to the 100-point composite (weight × sub-score).
- Cash flow +23.8/30.0
- ARV discount +10.4/15.0
- DSCR +7.7/10.0
- 1% rule +4.9/10.0
- Livability +3.6/5.0
- Schools +3.0/10.0
- Rent growth +2.5/5.0
- Condition / age +2.5/5.0
- Appreciation +0.0/10.0
$185,000
🖨 Deal sheet (PDF) 📄 Offer letter ✓ Due diligence
Listing remarks
247 Eisler Dr in Lillington, NC, is situated in a peaceful, rural neighborhood characterized by spacious lots. 3 bedrooms with 2 bathrooms, this open and spacious floorpan flows wonderfully. New roof and floors in the past 3 years! The community’s location offers convenient access to local amenities while maintaining a tranquil, country feel. With its spacious lots and welcoming neighborhood, 247 Eisler Dr presents an opportunity to enjoy the best of Lillington’s serene living.
Key facts
- New floors
- Convenient access
- Spacious lots
Tags
Property features AI
Exterior
- Utilities: Public water; Septic tank and holding tank
- Home design: Manufactured home; Residential property
- Construction: Vinyl siding
- Exterior features: Deck; Porch (front porch)
Interior
- Kitchen: Dishwasher; Range
- Flooring: Carpet; Vinyl
- Bathrooms: 2 full bathrooms
- Heating & cooling: Electric forced-air heating; Ceiling fan cooling
- Interior features: Ceiling fans; Double vanities; Eat-in kitchen; Kitchen island; Gas log fireplace (1)
- Laundry & utility: Washer hookup on main level; In-unit laundry
Neighborhood map
What this means for you Summary
Snapshot
- This is a 3-bed/2.0-bath manufactured listed at $185k.
Deal economics
- At list price, monthly cash flow is $355 ($4k/yr) — positive.
- The deal already cash-flows at list — no discount required.
- To meet the 1% rule (rent ≥ 1% of price), the offer needs to be $183k (1.1% below list).
- Recommended offer: $163k (12.0% below list) — sets the bar for market timing.
- Cap rate 8.6% vs local median 4.0% in Lillington — top-decile yield for the area; either an underpriced asset or a hidden risk that comps aren't pricing in. Stress-test before assuming the spread holds.
Location & tenants
- Location reads 71/100 on livability (#101 in NC) — a middle-class / working-renter tenant base. Strengths: cost of living A+, housing A+, health & safety A+; Watch: employment C-, amenities F, commute F.
- Harnett County Schools (rural): math 31% / reading 39% proficiency, ranked #130 of 178 in NC (top 73%) — families likely to look elsewhere, expect single-tenant / working-renter base with shorter leases.
- Zoned schools: Anderson Creek Primary (582 students, 61% FRL); Western Harnett Middle (math 34% / reading 43%, grade F, #244 of 475 statewide, top 53%, 820 students, 57% FRL); Western Harnett High (math 57% / reading 58%, grade C, #245 of 535 statewide, top 46%, 1,386 students, 60% FRL).
- Zoned-school proficiency averages 48% at this address vs 35% district-wide (+13 pts) — the actual schools serving this property are materially stronger than the Harnett County Schools average implies; a family-tenant draw the district grade alone would hide.
- Market conditions: 834 active listings in the ZIP; 3 comparable units currently listed for rent nearby; rentals at typical pace (median 25d on market — plan ~3-4 weeks tenant-placement turnaround); 2,080 units permitted in Harnett County in 2024 (12 in 5+ unit buildings).
- This rent runs 33% of the median local income ($67k/yr) — at the standard rent-burdened threshold; future hikes will face affordability resistance.
Forward outlook
- Local home prices are declining (-3.0%/yr); year-one equity from $1k of loan paydown is wiped out by about $6k of value loss. Plan a longer hold.
- Harnett County population projected at +42% by 2050 — long-run rental-demand tailwind backs the buy-and-hold thesis.
Negotiation context
- It's been on market 430 days — a 12% lower offer ($163k) is reasonable based on typical stale-listing flexibility.
Risks & watch-outs
- Climate carrying-cost: major wind risk, 69% chance of damaging wind over 30y; major wildfire risk; extreme-heat days projected 7→17/yr by 2055 (HVAC capex compounding) — expect insurance premiums to compound above CPI over the hold.
Questions for the listing agent
- It's been on market 430 days. Have you received any prior offers? Is the seller open to a 12% concession, seller financing, or rate buy-down credit?
- Why hasn't it sold? Are there any deal-killer items the seller is aware of (foundation, flood, title, zoning, code violations)?
- Is there a deadline driving the sale (1031 exchange, divorce, estate, relocation)? That informs how much negotiation room exists.
- Schools are F-rated, which usually means shorter tenancies and higher turnover. Who's the typical renter profile here, and what's been the actual vacancy rate?
- What's the average days-on-market for RENTAL listings here right now (not sales)? A rising rental-DOM trend means longer vacancies and softer asking-rent achievability than the comps imply.
- What's the recent tenant-quality profile in this submarket — average credit score on applications, eviction rate, late-payment / NSF rate, and stable-employment percentage? A property-management company in the area should have these aggregated.
- How much new for-sale + rental construction is in the pipeline within 1–3 miles? Heavy new supply typically softens prices + rents 12–24 months out; constrained supply supports both.
Investment metrics
- 1% rule
- 0.99% ✗
- Cap rate
- 8.59%
- Cash-on-cash
- 8.21%
- DSCR
- 1.37
- GRM
- 8.4
CMA / ARV
- ARV (on-the-fly)
- $197,964
- Comps found
- 8
Show comp detail 8 sales within ~0.75 mi
| Address | Dist | Beds/Ba | Sqft | Sold | Price | $/sf | Match |
|---|---|---|---|---|---|---|---|
| 609 Micro Tower Rd | 0.32mi | 3/2.0 | 1,429 (+2%) | 3mo | $205,000 | $143 | 80 |
| 100 Eisler Dr | 0.15mi | 3/2.0 | 1,307 (-7%) | 8mo | $190,000 | $145 | 74 |
| 545 Eisler Dr | 0.27mi | 4/2.0 (+1) | 1,324 (-6%) | 12mo | $195,000 | $147 | 63 |
| 710 Eisler Dr | 0.25mi | 3/2.0 | 1,316 (-6%) | 21mo | $186,000 | $141 | 61 |
| 53 Eisler Dr | 0.20mi | 2/2.0 (-1) | 1,243 (-12%) | 14mo | $172,500 | $139 | 55 |
| 704 Micro Tower Rd | 0.24mi | 3/2.0 | 1,599 (+14%) | 18mo | $187,000 | $117 | 50 |
| 485 Eisler Dr | 0.24mi | 3/3.0 | 1,575 (+12%) | 22mo | $122,000 | $77 | 46 |
| 265 Kathleen Rd | 0.50mi | 3/3.0 | 1,602 (+14%) | 21mo | $137,000 | $86 | 32 |
Match score weights: distance 35% · size 25% · config 20% · recency 20%. Top-matched comps best support the ARV.
Projected returns pro-forma
-3.0% appreciation · 3.0% rent growth · sell at horizon
- IRR
- -3.9%
- Equity multiple
- 0.86×
- Total profit
- $-7,483
- Equity at exit
- $27,584
- IRR
- 5.8%
- Equity multiple
- 1.43×
- Total profit
- $22,208
- Equity at exit
- $15,995
Cash invested: $51,800 (down + closing). Projections, not guarantees.
Landlord ↔ Tenant lean methodology
- Overall (STATE)
- 85 Strongly Landlord-Friendly
- State North Carolina
- 85 Strongly Landlord-Friendly · R+3
- County
- — inherits STATE
- City
- — inherits STATE
ZIP-level market 27546
- Home prices YoY
- -14.4%
- Active inventory
- 834
- Price-to-rent
- 8.4×
Monthly cashflow live
- Estimated rent
- $1,830 medium interval (Pro) →
- Mortgage (P&I)
- −$970
- Tax from tax record
- −$44 /mo · $527/yr
- Insurance
- −$77
- HOA
- −$0
- Vacancy / Maint / Mgmt
- −$384
- Net cashflow
- $355
Break-even live
Sensitivity live
| Price | -10% $459 | -5% $407 | +0% $355 | +5% $302 | +10% $250 |
|---|---|---|---|---|---|
| Rent | -10% $210 | -5% $282 | +0% $355 | +5% $427 | +10% $499 |
| Rate | -1.0pp $448 | -0.5pp $402 | base $355 | +0.5pp $307 | +1.0pp $258 |
UW: 25.0% down · 7.5% · 30yr · 1.5% tax · 5.0% vac · 8.0% maint · 8.0% mgmt
Financing live
Cash to close
- Down payment
- $46,250
- Closing costs
- $5,550
- Reserves months
- —
- Total cash needed
- —
Loan-product check · same deal, 3 products live
Conventional
25% down · 7.5% · 30yr
- Down + closing
- —
- Monthly P&I
- —
- Monthly cashflow
- —
- DSCR
- —
- Eligible?
- —
Personal DTI + credit; lowest rate.
DSCR
20% down · 8.5% · 30yr
- Down + closing
- —
- Monthly P&I
- —
- Monthly cashflow
- —
- DSCR
- —
- Eligible?
- —
No personal income docs; deal must DSCR.
Hard money
10% down · 12.0% · 12mo
- Down + closing
- —
- Monthly P&I
- —
- Monthly cashflow
- —
- DSCR
- —
- Eligible?
- —
Short-term bridge; refi at stabilization.
Rent comps 3 comps
| Address | Beds | Baths | Sqft | Rent | $/sqft | DOM | Units | Dist |
|---|---|---|---|---|---|---|---|---|
| 36 Jumpmaster Dr Unit Na Broadway, NC | 3.0 | 2.0 | 1250 | $1,750 | $1.40 | 25d | 1 | 0.68mi |
| 44 Schoomaker Ct Broadway, NC | 3.0 | 2.0 | 1348 | $1,750 | $1.30 | 25d | 1 | 0.82mi |
| 44 Schoomaker Ct Unit 44 Broadway, NC | 3.0 | 2.0 | 1378 | $1,750 | $1.27 | 15d | 1 | 0.82mi |
Listing history 20 events
-
2026-06-21days on market $185,000 Active 430 DOM
-
2026-06-18days on market $185,000 Active 427 DOM
-
2026-06-17days on market $185,000 Active 426 DOM
-
2026-06-16days on market $185,000 Active 425 DOM
-
2026-06-15days on market $185,000 Active 424 DOM
-
2026-06-14days on market $185,000 Active 422 DOM
-
2026-06-10days on market $185,000 Active 419 DOM
-
2026-06-09days on market $185,000 Active 418 DOM
-
2026-06-08days on market $185,000 Active 417 DOM
-
2026-06-07days on market $185,000 Active 416 DOM
-
2026-06-05days on market $185,000 Active 413 DOM
-
2026-06-03days on market $185,000 Active 412 DOM
-
2026-06-02days on market $185,000 Active 411 DOM
-
2026-06-01days on market $185,000 Active 410 DOM
-
2026-05-31days on market $185,000 Active 409 DOM
-
2026-05-30days on market $185,000 Active 408 DOM
-
2026-01-05price $185,000
-
2025-09-25price $195,000
-
2025-07-10price $190,000
-
2025-04-17$199,000 Active
ⓘ Source: listings_history table (triggers on properties + properties_extension) + one-shot
backfill from property_details.listing_events for pre-trigger history.
Tax reassessment forecast NC · Resets to sale price
- Current annual tax
- $527 · $44/mo
- Projected year-2 tax
- $1,517 · $126/mo
- Expected delta
- +$990/yr (+$83/mo · 188.1%)
ⓘ Screening estimate from a state-policy table — verify with the county assessor before closing.
Climate risk First Street
- Flood 1/10 Low FEMA zone X (unshaded) · 0% chance over 30 yrs
- Wildfire 7/10 Severe
- Heat 7/10 Severe 7 d/yr ≥105°F today · 17 d/yr by 30 yrs out
- Wind 6/10 Major 69% chance of damaging wind over 30 yrs
- Air quality 2/10 Low 0 unhealthy d/yr today · 1 by 30 yrs out
Nearby sold comps map
Loading sold comps map…
Walkable amenities ~0.75 mi
Loading nearby amenities…
Taxation est. · year 1
- Rental income
- $21,960
- − Mortgage interest
- −$10,363
- − Property taxes
- −$527
- − Insurance
- −$925
- − Repairs & maintenance
- −$1,757
- − Management
- −$1,757
- − Depreciation
- −$5,382
- Taxable income
- $1,250
- Est. tax owed @ 24.0%
- −$300
- After-tax cash flow
- $3,955/yr
For passive investors: Depreciation is non-cash, so a rental often shows a tax loss while cash-flowing — sheltering income. Rental losses are passive: they offset passive income freely, and up to $25,000/yr can offset ordinary (W-2) income if you actively participate and your MAGI is under $100k (phasing out to $0 by $150k); unused losses carry forward. On sale, claimed depreciation is recaptured at up to 25%, and gains may owe capital-gains tax (a 1031 exchange can defer both). Figures are a year-1 estimate at your 24.0% rate — not tax advice; consult a CPA.
Schools (NCES district)
- District
- Harnett County Schools
- NCES district ID
- 3702010
- Math proficiency
- 31% ▼ -2.00%
- Reading proficiency
- 39% ▼ -1.00%
- Median HH income
- $45,400
- Composite
- 29.88/100
- National rank
- #6397
- State rank
- #130 of 178 in NC
Livability — Lillington
- Score
- 71/100
- State rank
- #101
- US rank
- #6653
Category grades
Schools grade is shown separately in the Schools card above.
Census & demographics
- County
- Harnett County · 125,715 people
- City population
- 21,419
- Metro
- Fayetteville, NC
- Population (ZIP)
- 21,419
- Household income
- $66,746
- Rent vs Own
- Severe rent burden
- 642.0
Population outlook (Harnett County) Hauer SSP2
- Today (2025)
- 153,758 people
- By 2030
- 166,581 · +8.3%
- By 2040
- 192,741 · +25.4%
- By 2050
- 218,332 · +42.0%
- By 2075
- 275,422 · +79.1%
- By 2100
- 313,511 · +103.9%
Race, ethnicity, and origin ACS 2023
- Neighborhood character
- Diverse neighborhood (Simpson 0.55)
- Race & ethnicity
- White 64% Black 16% Hispanic / Latino 14% Two or more races 9% Asian 1%
- Hispanic origin (detail)
- Mexican 8% Puerto Rican 3%
- Common ancestry
- Slovak 3% Serbian 2% Italian 2%
- Foreign-born
- 5% · Canada, Jamaica, China
- Languages at home
- 90% English-only · Spanish 9%
Political lean MEDSL · Harnett
- 2024 margin
- Strong R (+25.1) · D 36.9% · R 62.0% · Other 1.1%
- 2008→2024 swing
- -8.4pp toward R · 2008: -16.7pp · 2024: -25.1pp
- All cycles
- 2024: R+25.1 2020: R+22.4 2016: R+24.1 2012: R+19.4 2008: R+16.7
Not yet ingested
- Civics
- —
Market trends
- HPI YoY
- ▼ -33.35%
- Current HPI
- 198.2885
- Rent YoY
- —
- Metro
- Fayetteville, NC
- State GDP YoY
- ▲ 3.28%
- F500 in state
- 26
Industry mix (Fortune 500 HQ in NC)
| Industry | F500 HQs | Revenue |
|---|---|---|
| Financial Services | 2 | $213B |
|
||
| Retail | 2 | $95B |
|
||
| Industrial Conglomerate | 1 | $38B |
|
||
| Metals / Steel | 1 | $35B |
|
||
| Utilities | 1 | $30B |
|
||
| Industrial Machinery | 1 | $19B |
|
||
Price history
-7.0% since first listed4 events — show timeline
- 2026-01-05 Price Changed $185,000 LPRMLS
- 2025-09-25 Price Changed $195,000 LPRMLS
- 2025-07-10 Price Changed $190,000 LPRMLS
- 2025-04-17 Listed $199,000 LPRMLS
Property tax history
-0.1%/yrLatest (2025): $527 · +0.0% YoY. Source: county tax records.
Cash-flow waterfall
monthlySold comps — $/sqft
last 12 mo · ≤1 miLoading sold comps…