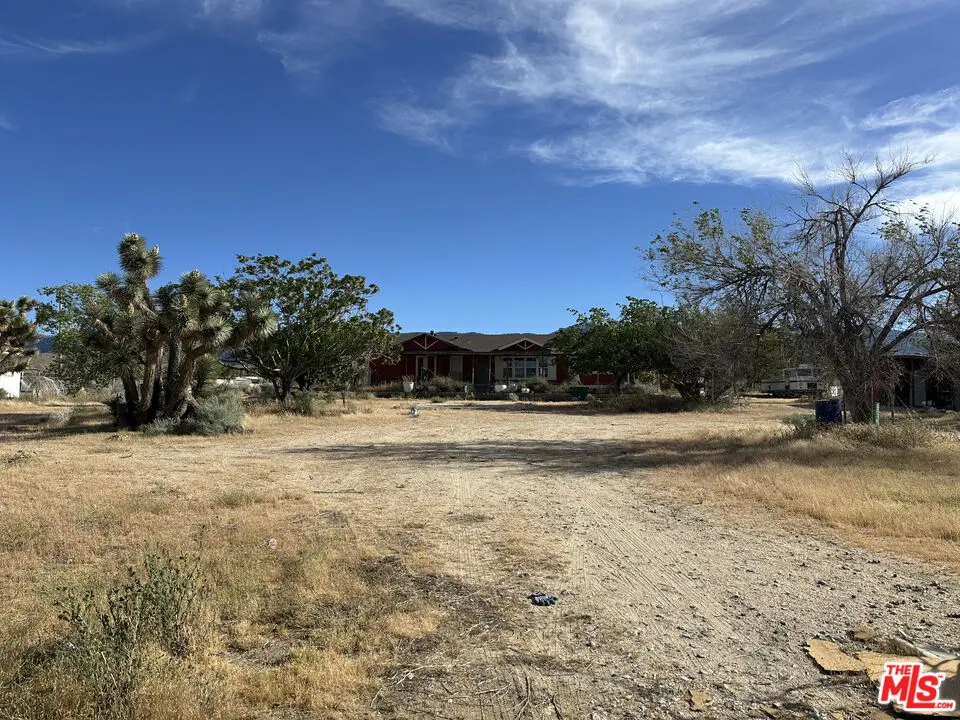
32049 213th St · Piñon Hills, CA
Flood risk 1/10 · Minimal
- FEMA flood zone
- X (unshaded)
- Chance of flooding over 30 yrs
- 0.0%
- Est. flood insurance / yr
- $507 – $1,088
Fire risk 7/10 · Major
- Est. fire insurance / yr
- $659 – $1,223
Heat risk 6/10 · Moderate
- Hot days now (above threshold)
- —
- Hot days in 30 yrs
- —
Wind risk 1/10 · Minimal
- Chance of severe wind over 30 yrs
- —
Air-quality risk 9/10 · Severe
- Unhealthy air days now
- 25 days/yr
- Unhealthy air days in 30 yrs
- 28 days/yr
Risk factors via First Street. Map © Google.
Why this score? — see what drove the C grade
The composite is a weighted blend of 9 inputs, each scored 0–100. Each bar is that input's sub-score; the figure is the points it added to the 100-point composite (weight × sub-score).
- Cash flow +18.4/30.0
- ARV discount +15.0/15.0
- DSCR +5.8/10.0
- Appreciation +5.1/10.0
- 1% rule +4.6/10.0
- Schools +2.7/10.0
- Rent growth +2.5/5.0
- Livability +2.5/5.0
- Condition / age +2.5/5.0
$270,000
🖨 Deal sheet (PDF) 📄 Offer letter ✓ Due diligence
Listing remarks
Expansive 2+ acres lot with a 1,685 sq. ft. home featuring 3 bedrooms and 2 baths. Just needs your finishing touches. Submit an offer.
Key facts
- 2.12 acre lot
- Parking
- Built 1995
Property features AI
Finance
- Other: Directions: 138 East, right on 213th St. E
- HOA & community: No HOA amenities; Single-unit complex
Exterior
- Parking: Uncovered parking; Parking spaces available; Parking for guests; Other parking
- Utilities: Septic system; On-site water (storage tanks)
- Home design: Detached single-family home; One-level (single story); Faces north
- Construction: Shingle roof
- Exterior features: Covered front and rear porches; Porch; Has pasture view; Accessory buildings on property
Interior
- Kitchen: Range; Oven; Hood fan; Dishwasher
- Bedrooms: Walk-in closet
- Flooring: Laminate floors
- Bathrooms: 2 full bathrooms; Tile finishes; Shower stall; Double vanities; Fiberglass shower enclosure; Shower and tub combination
- Heating & cooling: No heating; No cooling
- Interior features: Detached/no common walls; High ceilings (9 feet+); Fireplace in living room
- Laundry & utility: Laundry area inside; Laundry in closet; Washer and dryer included
Neighborhood map
What this means for you Summary
Snapshot
- This is a 3-bed/2.0-bath single-family listed at $270k.
Deal economics
- At list price, monthly cash flow is $251 ($3k/yr) — positive.
- The deal already cash-flows at list — no discount required.
- To meet the 1% rule (rent ≥ 1% of price), the offer needs to be $258k (4.3% below list).
- Recommended offer: $258k (4.3% below list) — sets the bar for 1% rule.
- Cap rate 7.4% vs local median 3.8% in Piñon Hills — top-decile yield for the area; either an underpriced asset or a hidden risk that comps aren't pricing in. Stress-test before assuming the spread holds.
Location & tenants
- Location reads: area grade C — affects rentability + tenant quality, not the cash-flow math above.
- Keppel Union Elementary (rural): math 23% / reading 33% proficiency, ranked #1,089 of 1,400 in CA (top 78%) — low school quality limits family demand, transient renter base, plan for 1-2y turnover; 74% free/reduced lunch — lower-income household profile, screen leases tightly.
- Market conditions: 128 active listings in the ZIP; 19,697 units permitted in Los Angeles County in 2024 (9,426 in 5+ unit buildings).
Forward outlook
- In year one you build about $3k of equity ($2k loan paydown + $697 appreciation (0.3% local appreciation)).
- Los Angeles County population projected at +9% by 2050 — modest demand growth; plan on rents tracking national, not racing it.
- At projected returns (0.3% appreciation + 3.0% rent growth), your $76k cash investment doubles in ~9 years — after that, you're playing with house money.
- By year 10, paydown + projected appreciation supports a ~$32k cash-out refi (75% LTV) — recoverable capital for the next deal without selling this one.
Negotiation context
- It's been on market 45 days — a 3% lower offer ($262k) is reasonable based on typical stale-listing flexibility.
- 14 sale attempts since 28y ago with the ask held roughly flat each time — persistent listings suggest the price (not the market) is what's stuck; bring a comps-based counter.
- Current owner paid $46k; list at $270k implies a 487% gain — meaningful room to come down on a strong offer.
Risks & watch-outs
- Climate carrying-cost: major wildfire risk — expect insurance premiums to compound above CPI over the hold.
Questions for the listing agent
- It's been on market 45 days. Have you received any prior offers? Is the seller open to a 4% concession, seller financing, or rate buy-down credit?
- Is there a deadline driving the sale (1031 exchange, divorce, estate, relocation)? That informs how much negotiation room exists.
- What's the average days-on-market for RENTAL listings here right now (not sales)? A rising rental-DOM trend means longer vacancies and softer asking-rent achievability than the comps imply.
- What's the recent tenant-quality profile in this submarket — average credit score on applications, eviction rate, late-payment / NSF rate, and stable-employment percentage? A property-management company in the area should have these aggregated.
- How much new for-sale + rental construction is in the pipeline within 1–3 miles? Heavy new supply typically softens prices + rents 12–24 months out; constrained supply supports both.
Investment metrics
- 1% rule
- 0.96% ✗
- Cap rate
- 7.41%
- Cash-on-cash
- 3.99%
- DSCR
- 1.18
- GRM
- 8.7
CMA / ARV
- ARV (on-the-fly)
- $362,275
- Comps found
- 1
Show comp detail 1 sale within ~0.75 mi
| Address | Dist | Beds/Ba | Sqft | Sold | Price | $/sf | Match |
|---|---|---|---|---|---|---|---|
| 32033 207th E | 0.50mi | 3/2.0 | 1,560 (-7%) | 0mo | $335,000 | $215 | 64 |
Match score weights: distance 35% · size 25% · config 20% · recency 20%. Top-matched comps best support the ARV.
Projected returns pro-forma
0.26% appreciation · 3.0% rent growth · sell at horizon
- IRR
- 3.1%
- Equity multiple
- 1.15×
- Total profit
- $11,389
- Equity at exit
- $81,902
- IRR
- 8.2%
- Equity multiple
- 1.92×
- Total profit
- $69,675
- Equity at exit
- $101,290
Cash invested: $75,600 (down + closing). Projections, not guarantees.
Landlord ↔ Tenant lean methodology
- Overall (STATE)
- 18 Strongly Tenant-Friendly
- State California
- 18 Strongly Tenant-Friendly · D+13
- County
- — inherits STATE
- City
- — inherits STATE
ZIP-level market 93544
- Home prices YoY
- 0.1%
- Active inventory
- 128
- Price-to-rent
- 8.7×
Monthly cashflow live
- Estimated rent
- $2,585 medium interval (Pro) →
- Mortgage (P&I)
- −$1,416
- Tax from tax record
- −$262 /mo · $3,148/yr
- Insurance
- −$112
- HOA
- −$0
- Vacancy / Maint / Mgmt
- −$543
- Net cashflow
- $251
Break-even live
Sensitivity live
| Price | -10% $404 | -5% $328 | +0% $251 | +5% $175 | +10% $98 |
|---|---|---|---|---|---|
| Rent | -10% $47 | -5% $149 | +0% $251 | +5% $353 | +10% $455 |
| Rate | -1.0pp $387 | -0.5pp $320 | base $251 | +0.5pp $181 | +1.0pp $110 |
UW: 25.0% down · 7.5% · 30yr · 1.5% tax · 5.0% vac · 8.0% maint · 8.0% mgmt
Financing live
Cash to close
- Down payment
- $67,500
- Closing costs
- $8,100
- Reserves months
- —
- Total cash needed
- —
Loan-product check · same deal, 3 products live
Conventional
25% down · 7.5% · 30yr
- Down + closing
- —
- Monthly P&I
- —
- Monthly cashflow
- —
- DSCR
- —
- Eligible?
- —
Personal DTI + credit; lowest rate.
DSCR
20% down · 8.5% · 30yr
- Down + closing
- —
- Monthly P&I
- —
- Monthly cashflow
- —
- DSCR
- —
- Eligible?
- —
No personal income docs; deal must DSCR.
Hard money
10% down · 12.0% · 12mo
- Down + closing
- —
- Monthly P&I
- —
- Monthly cashflow
- —
- DSCR
- —
- Eligible?
- —
Short-term bridge; refi at stabilization.
Listing history 50 events
-
2026-06-18days on market $270,000 Active 45 DOM
-
2026-06-17days on market $270,000 Active 44 DOM
-
2026-06-16days on market $270,000 Active 43 DOM
-
2026-06-15days on market $270,000 Active 42 DOM
-
2026-06-13days on market $270,000 Active 40 DOM
-
2026-06-13days on market $270,000 Active 39 DOM
-
2026-06-09days on market $270,000 Active 36 DOM
-
2026-06-08days on market $270,000 Active 35 DOM
-
2026-06-07days on market $270,000 Active 34 DOM
-
2026-06-04days on market $270,000 Active 31 DOM
-
2026-06-03days on market $270,000 Active 30 DOM
-
2026-06-02days on market $270,000 Active 29 DOM
-
2026-06-01days on market $270,000 Active 28 DOM
-
2026-05-31days on market $270,000 Active 27 DOM
-
2026-05-02$270,000 Active
-
2015-03-28historical
-
2015-03-27historical
-
2015-03-27historical
-
2015-03-17historical
-
2015-03-13historical
-
2014-09-30historical Expired
-
2014-09-10price
-
2014-05-22Active
-
2014-05-22historical Cancelled
-
2014-05-21Active
-
2012-01-03soldstatus $46,000
-
2011-07-15$64,900
-
2011-02-01historical
-
2010-12-29price $100,000
-
2010-10-13price $120,000
-
2010-08-17$140,000 Active
-
2010-05-20historical
-
2009-12-30price $75,000
-
2009-12-14$110,000 Active
-
2008-07-04historical
-
2008-04-03price $280,000
-
2008-03-06price $329,000
-
2008-02-05price $349,000
-
2008-01-06$380,000
-
2005-05-04soldstatus $220,000
-
2005-05-03soldstatus $220,000
-
2005-03-30$220,000
-
2002-02-01soldstatus $118,000
-
2002-02-01soldstatus $118,000
-
2001-05-11$120,000
-
2000-09-14$105,000
-
2000-06-22$115,000
-
1999-08-10$107,500
-
1999-03-20$105,000
-
1998-08-27$110,000
ⓘ Source: listings_history table (triggers on properties + properties_extension) + one-shot
backfill from property_details.listing_events for pre-trigger history.
Tax reassessment forecast CA · Resets to sale price
- Current annual tax
- $3,148 · $262/mo
- Projected year-2 tax
- $3,148 · $262/mo
- Expected delta
- $0/yr ($0/mo · 0.0%)
ⓘ Screening estimate from a state-policy table — verify with the county assessor before closing.
Climate risk First Street
- Flood 1/10 Low FEMA zone X (unshaded) · 0% chance over 30 yrs
- Wildfire 7/10 Severe
- Heat 6/10 Major
- Wind 1/10 Low
- Air quality 9/10 Extreme 25 unhealthy d/yr today · 28 by 30 yrs out
Nearby sold comps map
Loading sold comps map…
Walkable amenities ~0.75 mi
Loading nearby amenities…
Taxation est. · year 1
- Rental income
- $31,017
- − Mortgage interest
- −$15,124
- − Property taxes
- −$3,148
- − Insurance
- −$1,350
- − Repairs & maintenance
- −$2,481
- − Management
- −$2,481
- − Depreciation
- −$7,855
- Taxable loss
- −$1,422
- Est. tax savings @ 24.0%
- +$341
- After-tax cash flow
- $3,356/yr
For passive investors: Depreciation is non-cash, so a rental often shows a tax loss while cash-flowing — sheltering income. Rental losses are passive: they offset passive income freely, and up to $25,000/yr can offset ordinary (W-2) income if you actively participate and your MAGI is under $100k (phasing out to $0 by $150k); unused losses carry forward. On sale, claimed depreciation is recaptured at up to 25%, and gains may owe capital-gains tax (a 1031 exchange can defer both). Figures are a year-1 estimate at your 24.0% rate — not tax advice; consult a CPA.
Schools (NCES district)
- District
- Keppel Union Elementary
- NCES district ID
- 0619440
- Math proficiency
- 23% ▼ -2.00%
- Reading proficiency
- 33% ▲ 1.00%
- Median HH income
- $48,099
- Composite
- 27.26/100
- National rank
- #12432
- State rank
- #1089 of 1400 in CA
Livability — Piñon Hills
No livability data for this city. (Only ~50 U.S. cities are tracked.)
Census & demographics
- City population
- 4,854
- Population (ZIP)
- 1,201
Population outlook (Los Angeles County) Hauer SSP2
- Today (2025)
- 10,940,515 people
- By 2030
- 11,256,481 · +2.9%
- By 2040
- 11,729,929 · +7.2%
- By 2050
- 11,948,407 · +9.2%
- By 2075
- 11,818,114 · +8.0%
- By 2100
- 10,842,928 · -0.9%
Race, ethnicity, and origin ACS 2023
- Neighborhood character
- Majority White (50%)
- Race & ethnicity
- White 50% Hispanic / Latino 50% Two or more races 24%
- Hispanic origin (detail)
- Mexican 47% Salvadoran 1%
- Common ancestry
- Scottish 4% Portuguese 3% Serbian 2%
- Foreign-born
- 16% · Canada, Dominican Republic
- Languages at home
- 69% English-only · Spanish 23% Other Indo-European 8%
Political lean MEDSL · Los Angeles
- 2024 margin
- Solid D (+32.9) · D 64.8% · R 31.9% · Other 3.3%
- 2008→2024 swing
- -7.4pp toward R · 2008: 40.4pp · 2024: 32.9pp
- All cycles
- 2024: D+32.9 2020: D+44.2 2016: D+48.0 2012: D+40.0 2008: D+40.4
Not yet ingested
- Civics
- —
Market trends
- HPI YoY
- ▲ 0.26%
- Current HPI
- 310.0573
- Rent YoY
- —
- Metro
- —
- State GDP YoY
- ▲ 3.21%
- F500 in state
- 116
Industry mix (Fortune 500 HQ in CA)
| Industry | F500 HQs | Revenue |
|---|---|---|
| Technology | 27 | $1,492B |
|
||
| Financial Services | 3 | $174B |
|
||
| Retail | 3 | $44B |
|
||
| Insurance | 3 | $26B |
|
||
| Media / Entertainment | 2 | $115B |
|
||
| Pharmaceuticals / Biotech | 2 | $62B |
|
||
Price history
+1762.1% since first listed38 events — show timeline
- 2026-05-02 Listed $270,000 TheMLS
- 2015-03-28 Listing Removed — AVMLS
- 2015-03-27 Listing Removed — AVMLS
- 2015-03-27 Listing Removed — AVMLS
- 2015-03-17 Listing Removed — AVMLS
- 2015-03-13 Listing Removed — AVMLS
- 2014-09-30 Delisted — TheMLS
- 2014-09-10 Price Changed — TheMLS
- 2014-05-22 Listed — TheMLS
- 2014-05-22 Delisted — TheMLS
- 2014-05-21 Listed — TheMLS
- 2012-01-03 Sold (MLS) $46,000 AVMLS
- 2011-07-15 Listed $64,900 AVMLS
- 2011-02-01 Listing Removed — CRMLS
- 2010-12-29 Price Changed $100,000 CRMLS
- 2010-10-13 Price Changed $120,000 CRMLS
- 2010-08-17 Listed $140,000 CRMLS
- 2010-05-20 Listing Removed — CRMLS
- 2009-12-30 Price Changed $75,000 CRMLS
- 2009-12-14 Listed $110,000 CRMLS
- 2008-07-04 Listing Removed — CRMLS
- 2008-04-03 Price Changed $280,000 CRMLS
- 2008-03-06 Price Changed $329,000 CRMLS
- 2008-02-05 Price Changed $349,000 CRMLS
- 2008-01-06 Listed $380,000 CRMLS
- 2005-05-04 Sold (MLS) $220,000 CRMLS
- 2005-05-03 Sold (Public Records) $220,000 Public Records
- 2005-03-30 Listed $220,000 CRMLS
- 2002-02-01 Sold (Public Records) $118,000 Public Records
- 2002-02-01 Sold (MLS) $118,000 AVMLS
- 2001-05-11 Listed $120,000 AVMLS
- 2000-09-14 Listed $105,000 AVMLS
- 2000-06-22 Listed $115,000 AVMLS
- 1999-08-10 Listed $107,500 AVMLS
- 1999-03-20 Listed $105,000 AVMLS
- 1998-08-27 Listed $110,000 AVMLS
- 1990-11-30 Sold (Public Records) $25,000 Public Records
- 1989-04-24 Sold (Public Records) $14,500 Public Records
Property tax history
+1.0%/yrLatest (2025): $3,148 · +8.1% YoY. Source: county tax records.
Cash-flow waterfall
monthlySold comps — $/sqft
last 12 mo · ≤1 miLoading sold comps…