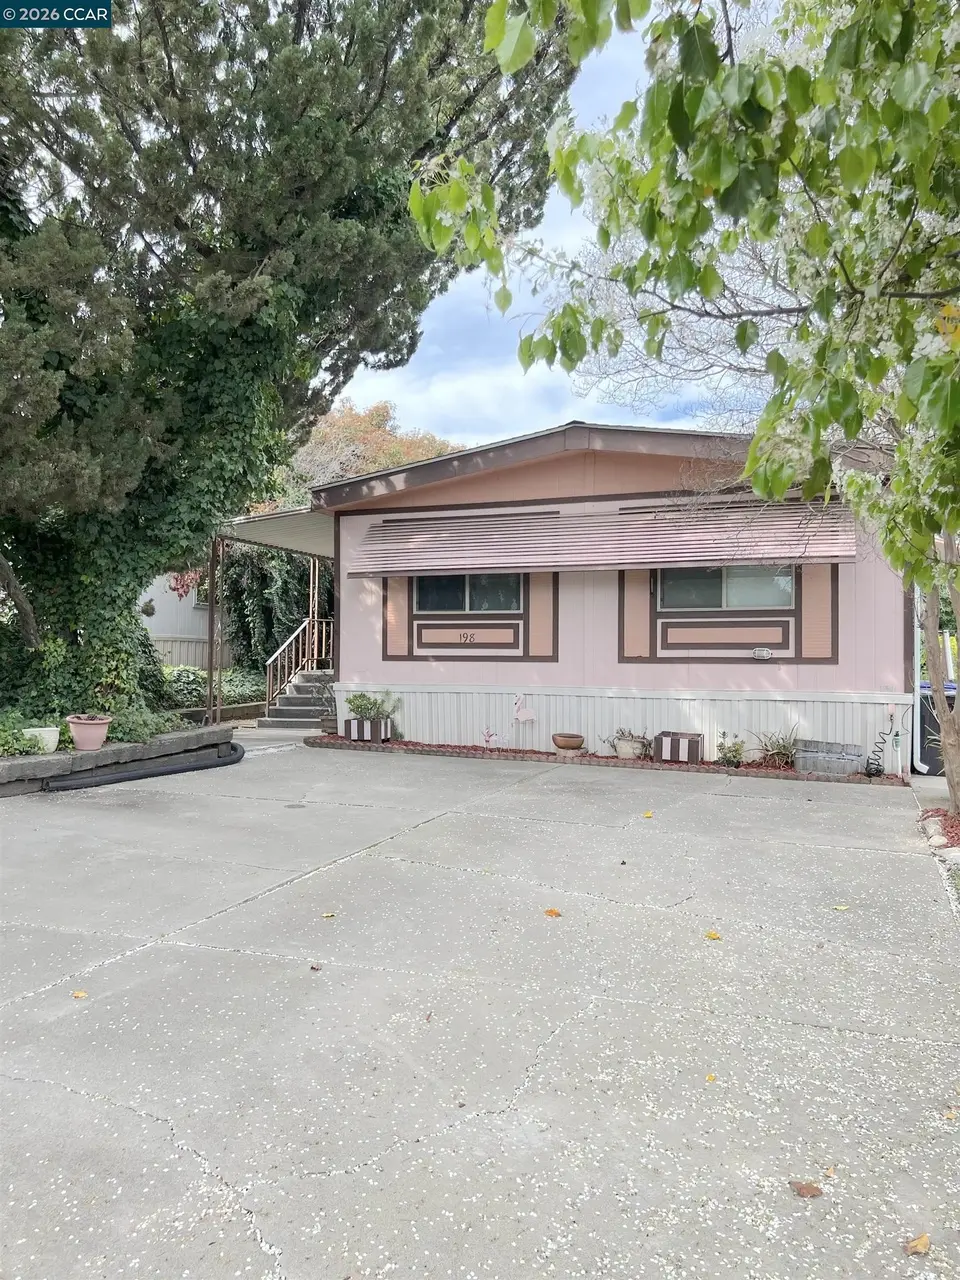
198 Kona Cir #198 · Pittsburg, CA
Flood risk 1/10 · Minimal
- FEMA flood zone
- X (unshaded)
- Chance of flooding over 30 yrs
- 0.0%
- Est. flood insurance / yr
- $507 – $1,088
Fire risk 6/10 · Moderate
- Est. fire insurance / yr
- $659 – $1,223
Heat risk 5/10 · Moderate
- Hot days now (above 99°F)
- 7 days/yr
- Hot days in 30 yrs
- 14 days/yr
Wind risk 1/10 · Minimal
- Chance of severe wind over 30 yrs
- —
Air-quality risk 8/10 · Major
- Unhealthy air days now
- 14 days/yr
- Unhealthy air days in 30 yrs
- 14 days/yr
Risk factors via First Street. Map © Google.
Why this score? — see what drove the B- grade
The composite is a weighted blend of 9 inputs, each scored 0–100. Each bar is that input's sub-score; the figure is the points it added to the 100-point composite (weight × sub-score).
- Cash flow +30.0/30.0
- 1% rule +10.0/10.0
- DSCR +10.0/10.0
- ARV discount +7.5/15.0
- Livability +2.9/5.0
- Rent growth +2.8/5.0
- Schools +2.8/10.0
- Condition / age +2.2/5.0
- Appreciation +0.0/10.0
$144,900
🖨 Deal sheet 📄 Offer letter ✓ Due diligence
Listing remarks MLS
In the beautiful 55-and-over park of Delta Hawaii, you'll find many places to live but not all have the privacy and peace of a perimeter property on the circle! Not only is 198 Kona circle situated among the trees backing up to the creek, but it is a very large 3 bedroom layout with more living area than most homes. At 1560sqft, you have separate dining area, living room, and family room, as well as attached craft/hobby area in the expanded laundry room. 2 bedrooms on one end of the home and the primary bed with attached bathroom on the other make it ideal for live in care provider, or use the rooms for office/gym for active adult. In addition to location and it's size which set this home apart, you also step into upgraded windows throughout, new comp shingle roof in 2020 (better than metal with coating), new AC unit 2018, and new 92% high efficiency furnace 2015. Unit was leveled in 2021. So the big ticket items are done which allow you to keep your long term costs down and your store of value more secure. Delta Hawaii is a great place to call home, with pool and clubhouse and active community, and 198 Kona circle is a wonderful spot! Come have a look!
Key facts
- Perimeter property
- Upgraded windows
- Separate dining area
Tags
Neighborhood map
What this means for you Summary
Snapshot
- This is a 3-bed/2.0-bath manufactured listed at $145k. Condition is rated fair.
Deal economics
- At list price, monthly cash flow is $1k ($18k/yr) — positive.
- The deal already cash-flows at list — no discount required.
- Meets the 1% rule at list price ($3k rent vs $145k).
- Recommended offer: $132k (9.0% below list) — sets the bar for market timing.
- Cap rate 18.5% vs local median 3.4% in Pittsburg — top-decile yield for the area; either an underpriced asset or a hidden risk that comps aren't pricing in. Stress-test before assuming the spread holds.
Location & tenants
- Location reads 58/100 on livability (#687 in CA) — a working-class tenant base; expect higher turnover. Strengths: employment A+, housing A+; Watch: schools F, crime D-, amenities F.
- Pittsburg Unified (suburban): math 21% / reading 35% proficiency, ranked #1,069 of 1,400 in CA (top 76%) — low school quality limits family demand, transient renter base, plan for 1-2y turnover; 66% free/reduced lunch — lower-income household profile, screen leases tightly.
- Market conditions: Rents rising (+1.1%/yr); 265 active listings in the ZIP; 16 comparable units currently listed for rent nearby; rentals at typical pace (median 25d on market — plan ~3-4 weeks tenant-placement turnaround); 44% of comp listings sitting > 30 days — soft ceiling on asking rent; solid renter incomes; 2,169 units permitted in Contra Costa County in 2024 (896 in 5+ unit buildings).
- This rent runs 39% of the median local income ($96k/yr) — at the standard rent-burdened threshold; future hikes will face affordability resistance.
Forward outlook
- Local home prices are declining (-3.0%/yr); year-one equity from $1k of loan paydown is wiped out by about $4k of value loss. Plan a longer hold.
- Contra Costa County population projected at +26% by 2050 — long-run rental-demand tailwind backs the buy-and-hold thesis.
- At projected returns (-3.0% appreciation + 1.1% rent growth), your $41k cash investment doubles in ~3 years — after that, you're playing with house money.
Negotiation context
- It's been on market 91 days — a 9% lower offer ($132k) is reasonable based on typical stale-listing flexibility.
Risks & watch-outs
- Climate carrying-cost: major wildfire risk; extreme-heat days projected 7→14/yr by 2055 (HVAC capex compounding) — expect insurance premiums to compound above CPI over the hold.
Questions for the listing agent
- It's been on market 91 days. Have you received any prior offers? Is the seller open to a 9% concession, seller financing, or rate buy-down credit?
- Have any recent inspections been done? Can we get a copy of the seller's disclosures and any deferred-maintenance estimates?
- Built in 1978 — when were the roof, HVAC, electrical panel, plumbing, and water heater last replaced?
- Why hasn't it sold? Are there any deal-killer items the seller is aware of (foundation, flood, title, zoning, code violations)?
- Is there a deadline driving the sale (1031 exchange, divorce, estate, relocation)? That informs how much negotiation room exists.
- Schools are F-rated, which usually means shorter tenancies and higher turnover. Who's the typical renter profile here, and what's been the actual vacancy rate?
- Crime grade is D in this area — have there been break-ins, vandalism, or insurance claims at this property in the last 3 years? What carrier currently insures it and at what premium?
- What's the average days-on-market for RENTAL listings here right now (not sales)? A rising rental-DOM trend means longer vacancies and softer asking-rent achievability than the comps imply.
- What's the recent tenant-quality profile in this submarket — average credit score on applications, eviction rate, late-payment / NSF rate, and stable-employment percentage? A property-management company in the area should have these aggregated.
- How much new for-sale + rental construction is in the pipeline within 1–3 miles? Heavy new supply typically softens prices + rents 12–24 months out; constrained supply supports both.
Investment metrics
- 1% rule
- 2.16% ✓
- Cap rate
- 18.50%
- Cash-on-cash
- 43.59%
- DSCR
- 2.94
- GRM
- 3.9
CMA / ARV
- ARV (median comp)
- $87,500
- List price
- $144,900
- Delta
- 65.60%
- Verdict
- OVERPRICED
- Comps
- 19 within 1.0 mi
Show comp detail 12 sales within ~0.75 mi
| Address | Dist | Beds/Ba | Sqft | Sold | Price | $/sf | Match |
|---|---|---|---|---|---|---|---|
| 77 Hilo Dr | 0.22mi | 3/2.0 | 1,566 (+0%) | 2mo | $270,000 | $172 | 88 |
| 210 Kona Crk | 0.07mi | 3/2.0 | 1,440 (-8%) | 1mo | $70,000 | $49 | 83 |
| 211 Kona Cir | 0.08mi | 2/2.0 (-1) | 1,536 (-2%) | 13mo | $90,000 | $59 | 78 |
| 237 Aloha Way | 0.07mi | 2/2.0 (-1) | 1,464 (-6%) | 4mo | $175,000 | $120 | 78 |
| 141 Maui Dr | 0.10mi | 2/2.0 (-1) | 1,440 (-8%) | 2mo | $84,000 | $58 | 76 |
| 215 Maui Dr #215 | 0.10mi | 2/2.0 (-1) | 1,440 (-8%) | 4mo | $85,500 | $59 | 74 |
| 232 Queens Way | 0.05mi | 2/2.0 (-1) | 1,400 (-10%) | 4mo | $87,500 | $63 | 72 |
| 16 Surf Dr | 0.29mi | 2/2.0 (-1) | 1,440 (-8%) | 0mo | $54,900 | $38 | 69 |
| 224 Queens Way #224 | 0.06mi | 2/2.0 (-1) | 1,344 (-14%) | 2mo | $85,900 | $64 | 67 |
| 223 Queens Way | 0.08mi | 3/2.0 | 1,740 (+12%) | 12mo | $149,500 | $86 | 67 |
| 61 Pali Way | 0.26mi | 2/2.0 (-1) | 1,400 (-10%) | 3mo | $50,000 | $36 | 63 |
| 134 Banyon Dr | 0.13mi | 2/2.0 (-1) | 1,344 (-14%) | 3mo | $133,000 | $99 | 63 |
Match score weights: distance 35% · size 25% · config 20% · recency 20%. Top-matched comps best support the ARV.
Projected returns pro-forma
-3.0% appreciation · 1.11% rent growth · sell at horizon
- IRR
- 38.3%
- Equity multiple
- 2.59×
- Total profit
- $64,578
- Equity at exit
- $21,605
- IRR
- 43.9%
- Equity multiple
- 4.80×
- Total profit
- $154,182
- Equity at exit
- $12,528
Cash invested: $40,572 (down + closing). Projections, not guarantees.
Landlord ↔ Tenant lean methodology
- Overall (STATE)
- 18 Strongly Tenant-Friendly
- State California
- 18 Strongly Tenant-Friendly · D+13
- County
- — inherits STATE
- City
- — inherits STATE
ZIP-level market 94565
- Rents YoY
- 1.1%
- Active inventory
- 265
- Price-to-rent
- 3.9×
Monthly cashflow live
- Estimated rent
- $3,133 high interval (Pro) →
- Mortgage (P&I)
- −$760
- Tax est. 1.5%
- −$181 /mo · $2,174/yr
- Insurance
- −$60
- HOA
- −$0
- Vacancy / Maint / Mgmt
- −$658
- Net cashflow
- $1,474
Break-even live
UW: 25.0% down · 7.5% · 30yr · 1.5% tax · 5.0% vac · 8.0% maint · 8.0% mgmt
Financing live
Cash to close
- Down payment
- $36,225
- Closing costs
- $4,347
- Reserves months
- —
- Total cash needed
- —
Loan-product check · same deal, 3 products live
Conventional
25% down · 7.5% · 30yr
- Down + closing
- —
- Monthly P&I
- —
- Monthly cashflow
- —
- DSCR
- —
- Eligible?
- —
Personal DTI + credit; lowest rate.
DSCR
20% down · 8.5% · 30yr
- Down + closing
- —
- Monthly P&I
- —
- Monthly cashflow
- —
- DSCR
- —
- Eligible?
- —
No personal income docs; deal must DSCR.
Hard money
10% down · 12.0% · 12mo
- Down + closing
- —
- Monthly P&I
- —
- Monthly cashflow
- —
- DSCR
- —
- Eligible?
- —
Short-term bridge; refi at stabilization.
Rent comps 16 comps
| Address | Beds | Baths | Sqft | Rent | $/sqft | DOM | Units | Dist |
|---|---|---|---|---|---|---|---|---|
| 4 Meadowbrook Ave Pittsburg, CA | 2.0 | 2.0 | 1122 | $2,600 | $2.32 | 44d | 1 | 0.23mi |
| 948 Golden Leaf Way Pittsburg, CA | 3.0 | 2.0 | 1386 | $3,400 | $2.45 | 44d | 1 | 0.33mi |
| 2221 Lynbrook Dr Pittsburg, CA | 3.0 | 2.0 | 1365 | $3,195 | $2.34 | 44d | 1 | 0.41mi |
| 3809 Lassen Dr Pittsburg, CA | 3.0 | 1.5 | 1650 | $2,995 | $1.82 | 3d | 1 | 0.46mi |
| 1 Addison Ct Pittsburg, CA | 4.0 | 2.5 | 1805 | $3,295 | $1.83 | 24d | 1 | 0.50mi |
| 17 Lorraine Ave Pittsburg, CA | 3.0 | 1.5 | 1180 | $2,700 | $2.29 | 18d | 1 | 0.68mi |
| 4225 McFaul Dr Pittsburg, CA | 4.0 | 2.0 | 1500 | $4,100 | $2.73 | 24d | 1 | 0.73mi |
| 240 Benjamin Ave Pittsburg, CA | 3.0 | 2.0 | 1379 | $3,139 | $2.28 | 3d | 1 | 0.78mi |
| 4317 Campbell Dr Pittsburg, CA | 4.0 | 3.0 | 1965 | $3,400 | $1.73 | 44d | 1 | 0.82mi |
| 60 Xena Ct Pittsburg, CA | 3.0 | 2.5 | 1805 | $3,200 | $1.77 | 44d | 1 | 0.90mi |
| 1000 Pheasant Dr Pittsburg, CA | 1.0–2.0 | 1.0–2.5 | 879 | $2,795 | $3.18 | 24d | 29 | 1.06mi |
| 1353 Pine St Pittsburg, CA | 3.0 | 2.0 | 1369 | $2,750 | $2.01 | 5d | 1 | 1.14mi |
| 1341 Maple St Pittsburg, CA | 2.0 | 1.0 | 1299 | $2,550 | $1.96 | 22d | 1 | 1.15mi |
| 1346 Redwood St Pittsburg, CA | 3.0 | 1.5 | 1066 | $2,915 | $2.73 | 17d | 1 | 1.16mi |
| 99 Liberty Ct Pittsburg, CA | 3.0 | 2.5 | 1802 | $3,600 | $2.00 | 44d | 1 | 1.21mi |
| 34 Kingswood Dr Pittsburg, CA | 4.0 | 2.0 | 1755 | $3,900 | $2.22 | 44d | 1 | 1.25mi |
Listing history 16 events
-
2026-06-18days on market $144,900 Active 91 DOM
-
2026-06-17days on market $144,900 Active 90 DOM
-
2026-06-16days on market $144,900 Active 89 DOM
-
2026-06-15days on market $144,900 Active 88 DOM
-
2026-06-13days on market $144,900 Active 86 DOM
-
2026-06-13days on market $144,900 Active 85 DOM
-
2026-06-09days on market $144,900 Active 82 DOM
-
2026-06-08days on market $144,900 Active 81 DOM
-
2026-06-07days on market $144,900 Active 80 DOM
-
2026-06-04days on market $144,900 Active 77 DOM
-
2026-06-03days on market $144,900 Active 76 DOM
-
2026-06-02days on market $144,900 Active 75 DOM
-
2026-06-01days on market $144,900 Active 74 DOM
-
2026-05-31days on market $144,900 Active 73 DOM
-
2026-05-19price $144,900 1173-char remark
Show marketing remark (1173 chars)
In the beautiful 55-and-over park of Delta Hawaii, you'll find many places to live but not all have the privacy and peace of a perimeter property on the circle! Not only is 198 Kona circle situated among the trees backing up to the creek, but it is a very large 3 bedroom layout with more living area than most homes. At 1560sqft, you have separate dining area, living room, and family room, as well as attached craft/hobby area in the expanded laundry room. 2 bedrooms on one end of the home and the primary bed with attached bathroom on the other make it ideal for live in care provider, or use the rooms for office/gym for active adult. In addition to location and it's size which set this home apart, you also step into upgraded windows throughout, new comp shingle roof in 2020 (better than metal with coating), new AC unit 2018, and new 92% high efficiency furnace 2015. Unit was leveled in 2021. So the big ticket items are done which allow you to keep your long term costs down and your store of value more secure. Delta Hawaii is a great place to call home, with pool and clubhouse and active community, and 198 Kona circle is a wonderful spot! Come have a look!
-
2026-03-19$149,900 Active 1173-char remark
Show marketing remark (1173 chars)
In the beautiful 55-and-over park of Delta Hawaii, you'll find many places to live but not all have the privacy and peace of a perimeter property on the circle! Not only is 198 Kona circle situated among the trees backing up to the creek, but it is a very large 3 bedroom layout with more living area than most homes. At 1560sqft, you have separate dining area, living room, and family room, as well as attached craft/hobby area in the expanded laundry room. 2 bedrooms on one end of the home and the primary bed with attached bathroom on the other make it ideal for live in care provider, or use the rooms for office/gym for active adult. In addition to location and it's size which set this home apart, you also step into upgraded windows throughout, new comp shingle roof in 2020 (better than metal with coating), new AC unit 2018, and new 92% high efficiency furnace 2015. Unit was leveled in 2021. So the big ticket items are done which allow you to keep your long term costs down and your store of value more secure. Delta Hawaii is a great place to call home, with pool and clubhouse and active community, and 198 Kona circle is a wonderful spot! Come have a look!
ⓘ Source: listings_history table (triggers on properties + properties_extension) + one-shot
backfill from property_details.listing_events for pre-trigger history.
Climate risk First Street
- Flood 1/10 Low FEMA zone X (unshaded) · 0% chance over 30 yrs
- Wildfire 6/10 Major
- Heat 5/10 Major 7 d/yr ≥99°F today · 14 d/yr by 30 yrs out
- Wind 1/10 Low
- Air quality 8/10 Severe 14 unhealthy d/yr today · 14 by 30 yrs out
Nearby sold comps map
Loading sold comps map…
Walkable amenities ~0.75 mi
Loading nearby amenities…
Taxation est. · year 1
- Rental income
- $37,596
- − Mortgage interest
- −$8,117
- − Property taxes
- −$2,174
- − Insurance
- −$724
- − Repairs & maintenance
- −$3,008
- − Management
- −$3,008
- − Depreciation
- −$4,215
- Taxable income
- $16,350
- Est. tax owed @ 24.0%
- −$3,924
- After-tax cash flow
- $13,760/yr
For passive investors: Depreciation is non-cash, so a rental often shows a tax loss while cash-flowing — sheltering income. Rental losses are passive: they offset passive income freely, and up to $25,000/yr can offset ordinary (W-2) income if you actively participate and your MAGI is under $100k (phasing out to $0 by $150k); unused losses carry forward. On sale, claimed depreciation is recaptured at up to 25%, and gains may owe capital-gains tax (a 1031 exchange can defer both). Figures are a year-1 estimate at your 24.0% rate — not tax advice; consult a CPA.
Condition & rehab AI · 12 photos
This home requires significant repairs and updates to improve its condition and value. Exterior and interior repairs are needed, along with flooring and kitchen/bathroom updates.
Repairs flagged
- Major exterior siding — Severe weathering
- Major roof — Severe weathering
- Major flooring — Severe wear
- Major interior walls/paint — Severe wear
- Major kitchen cabinets — Severe wear
- Major bathroom fixtures — Severe wear
Value-add opportunities
- Both exterior siding and roof replacement — Improves curb appeal and value
- Both flooring replacement — Improves living space and value
- Both paint and interior updates — Improves living space and value
- Both kitchen and bathroom updates — Improves living space and value
Renovation cost estimate screening
| Repair item | Severity | Est. cost |
|---|---|---|
| exterior siding · Severe weathering | Major | $15,000–50,000 |
| roof · Severe weathering | Major | $15,000–50,000 |
| flooring · Severe wear | Major | $15,000–50,000 |
| interior walls/paint · Severe wear | Major | $15,000–50,000 |
| kitchen cabinets · Severe wear | Major | $15,000–50,000 |
| bathroom fixtures · Severe wear | Major | $15,000–50,000 |
| Total estimated repair cost · 6 items | $90,000–300,000 |
Value-add ROI direction
- Both exterior siding and roof replacement — Improves curb appeal and value ↑
- Both flooring replacement — Improves living space and value ↑
- Both paint and interior updates — Improves living space and value ↑
- Both kitchen and bathroom updates — Improves living space and value ↑
ⓘ Cost ranges are severity-bucket heuristics (US national rule-of-thumb). Get contractor quotes + a written scope before underwriting a rehab budget.
Schools (NCES district)
- District
- Pittsburg Unified
- NCES district ID
- 0630600
- Math proficiency
- 21% ▲ 1.00%
- Reading proficiency
- 35% ▲ 1.00%
- Median HH income
- $55,872
- Composite
- 27.99/100
- National rank
- #12238
- State rank
- #1069 of 1400 in CA
Livability — Pittsburg
- Score
- 58/100
- State rank
- #687
- US rank
- #20922
Category grades
Schools grade is shown separately in the Schools card above.
Census & demographics
- Census place
- Pittsburg, CA
- County
- Contra Costa County · 1,059,880 people
- City population
- 100,488
- Metro
- San Francisco-Oakland-Berkeley, CA
- Population (ZIP)
- 100,488
- Household income
- $95,556
- Rent vs Own
- Severe rent burden
- 3942.0
Population outlook (Contra Costa County) Hauer SSP2
- Today (2025)
- 1,287,720 people
- By 2030
- 1,364,937 · +6.0%
- By 2040
- 1,506,209 · +17.0%
- By 2050
- 1,624,373 · +26.1%
- By 2075
- 1,853,193 · +43.9%
- By 2100
- 1,901,231 · +47.6%
Race, ethnicity, and origin ACS 2023
- Neighborhood character
- Diverse neighborhood (Simpson 0.70)
- Race & ethnicity
- Hispanic / Latino 48% Two or more races 19% Asian 17% White 16% Black 13% Pacific Islander 1% Native American 1%
- Hispanic origin (detail)
- Mexican 38% Puerto Rican 1%
- Common ancestry
- Italian 1% Russian 1% Lithuanian 1%
- Foreign-born
- 34% · Canada, China, Vietnam
- Languages at home
- 47% English-only · Spanish 37% Tagalog/Filipino 6% Other Indo-European 4%
Political lean MEDSL · Contra Costa
- 2024 margin
- Solid D (+38.0) · D 67.3% · R 29.4% · Other 3.3%
- 2008→2024 swing
- +0.2pp no change · 2008: 37.8pp · 2024: 38.0pp
- All cycles
- 2024: D+38.0 2020: D+45.3 2016: D+43.5 2012: D+33.7 2008: D+37.8
Not yet ingested
- Civics
- —
Market trends
- HPI YoY
- ▼ -478.40%
- Current HPI
- 376.2576
- Rent YoY
- ▲ 1.11%
- Metro
- San Francisco-Oakland-Berkeley, CA
- State GDP YoY
- ▲ 3.21%
- F500 in state
- 116
Industry mix (Fortune 500 HQ in CA)
| Industry | F500 HQs | Revenue |
|---|---|---|
| Technology | 27 | $1,492B |
|
||
| Financial Services | 3 | $174B |
|
||
| Retail | 3 | $44B |
|
||
| Insurance | 3 | $26B |
|
||
| Media / Entertainment | 2 | $115B |
|
||
| Pharmaceuticals / Biotech | 2 | $62B |
|
||
Price history
-3.3% since first listed2 events — show timeline
- 2026-05-19 Price Changed $144,900 bridgeMLS, Bay East AOR, or Contra Costa AOR
- 2026-03-19 Listed $149,900 bridgeMLS, Bay East AOR, or Contra Costa AOR
Cash-flow waterfall
monthlySold comps — $/sqft
last 12 mo · ≤1 miLoading sold comps…