416 21st St · Wilson, KS
Flood risk 1/10 · Minimal
- FEMA flood zone
- X (unshaded)
- Chance of flooding over 30 yrs
- 0.0%
- Est. flood insurance / yr
- $473 – $860
Fire risk 4/10 · Minor
- Est. fire insurance / yr
- $1,154 – $2,142
Heat risk 5/10 · Moderate
- Hot days now (above 106°F)
- 7 days/yr
- Hot days in 30 yrs
- 17 days/yr
Wind risk 2/10 · Minimal
- Chance of severe wind over 30 yrs
- —
Air-quality risk 2/10 · Minimal
- Unhealthy air days now
- 1 days/yr
- Unhealthy air days in 30 yrs
- 1 days/yr
Risk factors via First Street. Map © Google.
Why this score? — see what drove the C- grade
The composite is a weighted blend of 9 inputs, each scored 0–100. Each bar is that input's sub-score; the figure is the points it added to the 100-point composite (weight × sub-score).
- Cash flow +16.2/30.0
- ARV discount +7.5/15.0
- DSCR +5.0/10.0
- Appreciation +5.0/10.0
- Schools +5.0/10.0
- 1% rule +4.4/10.0
- Livability +3.6/5.0
- Rent growth +2.5/5.0
- Condition / age +2.5/5.0
$130,000
🖨 Deal sheet (PDF) 📄 Offer letter ✓ Due diligence
Key facts
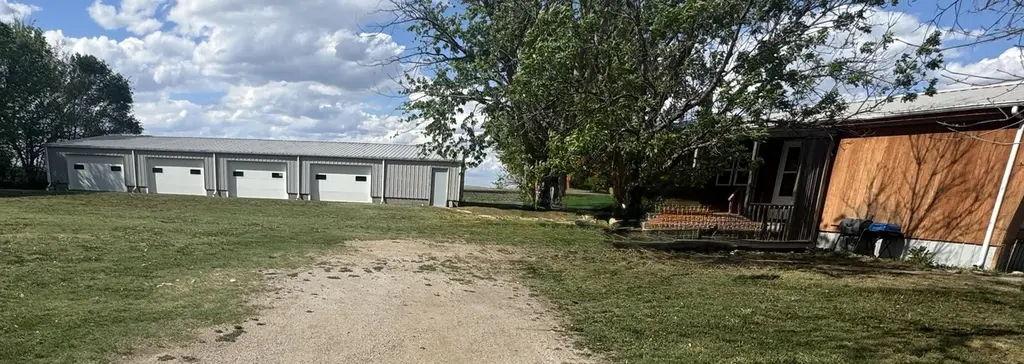
- Lake access
- Large shed
- 1,624 sq ft lot
Tags
Property features AI
Exterior
- Utilities: Public water; Public sewer
- Home design: Manufactured home; Entry level: 1
- Exterior features: Lot approximately 0.82 acres; Lot dimensions include W100' of 24 Lots, 2, 4 & 6 and 15' lot 8; Zoning: NC.1 / R-1
Interior
- Kitchen: Range; Oven; Microwave; Refrigerator; Dishwasher not listed
- Bedrooms: 3 main-level bedrooms
- Heating & cooling: Central air (cooling)
- Interior features: Window coverings; 8 total rooms
- Laundry & utility: Washer; Dryer
Neighborhood map
What this means for you Summary
Snapshot
- This is a 3-bed/2.0-bath other listed at $130k.
Deal economics
- At list price, monthly cash flow is $69 ($833/yr) — positive.
- The deal already cash-flows at list — no discount required.
- To meet the 1% rule (rent ≥ 1% of price), the offer needs to be $123k (5.8% below list).
- Recommended offer: $122k (6.0% below list) — sets the bar for market timing.
Location & tenants
- Location reads 71/100 on livability (#140 in KS) — a middle-class / working-renter tenant base. Strengths: cost of living A+, housing A+, health & safety A+; Watch: employment C-, crime F, amenities D-.
- Market conditions: 1 active listings in the ZIP; 2 units permitted in Ellsworth County in 2024 (0 in 5+ unit buildings).
Forward outlook
- In year one you build about $5k of equity ($899 loan paydown + $4k appreciation (3.0% local appreciation)).
- At projected returns (3.0% appreciation + 3.0% rent growth), your $36k cash investment doubles in ~6 years — after that, you're playing with house money.
- By year 7, paydown + projected appreciation supports a ~$30k cash-out refi (75% LTV) — recoverable capital for the next deal without selling this one.
Negotiation context
- It's been on market 62 days — a 6% lower offer ($122k) is reasonable based on typical stale-listing flexibility.
- Current owner paid $5k; list at $130k implies a 2500% gain — meaningful room to come down on a strong offer.
Risks & watch-outs
- Climate carrying-cost: extreme-heat days projected 7→17/yr by 2055 (HVAC capex compounding) — expect insurance premiums to compound above CPI over the hold.
Questions for the listing agent
- It's been on market 62 days. Have you received any prior offers? Is the seller open to a 6% concession, seller financing, or rate buy-down credit?
- Why hasn't it sold? Are there any deal-killer items the seller is aware of (foundation, flood, title, zoning, code violations)?
- Is there a deadline driving the sale (1031 exchange, divorce, estate, relocation)? That informs how much negotiation room exists.
- Crime grade is F in this area — have there been break-ins, vandalism, or insurance claims at this property in the last 3 years? What carrier currently insures it and at what premium?
- What's the average days-on-market for RENTAL listings here right now (not sales)? A rising rental-DOM trend means longer vacancies and softer asking-rent achievability than the comps imply.
- What's the recent tenant-quality profile in this submarket — average credit score on applications, eviction rate, late-payment / NSF rate, and stable-employment percentage? A property-management company in the area should have these aggregated.
- How much new for-sale + rental construction is in the pipeline within 1–3 miles? Heavy new supply typically softens prices + rents 12–24 months out; constrained supply supports both.
Investment metrics
- 1% rule
- 0.94% ✗
- Cap rate
- 6.93%
- Cash-on-cash
- 2.29%
- DSCR
- 1.10
- GRM
- 8.8
CMA / ARV
No comps found within radius.
Projected returns pro-forma
3.0% appreciation · 3.0% rent growth · sell at horizon
- IRR
- 9.6%
- Equity multiple
- 1.55×
- Total profit
- $20,099
- Equity at exit
- $58,454
- IRR
- 12.0%
- Equity multiple
- 2.80×
- Total profit
- $65,401
- Equity at exit
- $90,084
Cash invested: $36,400 (down + closing). Projections, not guarantees.
Landlord ↔ Tenant lean methodology
- Overall (STATE)
- 83 Strongly Landlord-Friendly
- State Kansas
- 83 Strongly Landlord-Friendly · R+10
- County
- — inherits STATE
- City
- — inherits STATE
ZIP-level market 67590
- Active inventory
- 1
- Price-to-rent
- 8.8×
Monthly cashflow live
- Estimated rent
- $1,225 medium interval (Pro) →
- Mortgage (P&I)
- −$682
- Tax est. 1.5%
- −$162 /mo · $1,950/yr
- Insurance
- −$54
- HOA
- −$0
- Vacancy / Maint / Mgmt
- −$257
- Net cashflow
- $69
Break-even live
Sensitivity live
| Price | -10% $159 | -5% $114 | +0% $69 | +5% $24 | +10% $-20 |
|---|---|---|---|---|---|
| Rent | -10% $-27 | -5% $21 | +0% $69 | +5% $118 | +10% $166 |
| Rate | -1.0pp $135 | -0.5pp $102 | base $69 | +0.5pp $36 | +1.0pp $1 |
UW: 25.0% down · 7.5% · 30yr · 1.5% tax · 5.0% vac · 8.0% maint · 8.0% mgmt
Financing live
Cash to close
- Down payment
- $32,500
- Closing costs
- $3,900
- Reserves months
- —
- Total cash needed
- —
Loan-product check · same deal, 3 products live
Conventional
25% down · 7.5% · 30yr
- Down + closing
- —
- Monthly P&I
- —
- Monthly cashflow
- —
- DSCR
- —
- Eligible?
- —
Personal DTI + credit; lowest rate.
DSCR
20% down · 8.5% · 30yr
- Down + closing
- —
- Monthly P&I
- —
- Monthly cashflow
- —
- DSCR
- —
- Eligible?
- —
No personal income docs; deal must DSCR.
Hard money
10% down · 12.0% · 12mo
- Down + closing
- —
- Monthly P&I
- —
- Monthly cashflow
- —
- DSCR
- —
- Eligible?
- —
Short-term bridge; refi at stabilization.
Listing history 21 events
-
2026-06-21days on market $130,000 Active 62 DOM
-
2026-06-21days on market $130,000 Active 61 DOM
-
2026-06-18days on market $130,000 Active 59 DOM
-
2026-06-17days on market $130,000 Active 58 DOM
-
2026-06-16days on market $130,000 Active 57 DOM
-
2026-06-15days on market $130,000 Active 56 DOM
-
2026-06-13days on market $130,000 Active 54 DOM
-
2026-06-12days on market $130,000 Active 53 DOM
-
2026-06-09days on market $130,000 Active 50 DOM
-
2026-06-08days on market $130,000 Active 49 DOM
-
2026-06-07days on market $130,000 Active 48 DOM
-
2026-06-05days on market $130,000 Active 46 DOM
-
2026-06-04days on market $130,000 Active 44 DOM
-
2026-06-02days on market $130,000 Active 43 DOM
-
2026-06-01days on market $130,000 Active 42 DOM
-
2026-05-31days on market $130,000 Active 41 DOM
-
2026-05-31days on market $130,000 Active 40 DOM
-
2026-04-15$130,000 Active
-
1999-12-01soldstatus
-
1998-08-01soldstatus $5,000
-
1996-09-01soldstatus $14,000
ⓘ Source: listings_history table (triggers on properties + properties_extension) + one-shot
backfill from property_details.listing_events for pre-trigger history.
Climate risk First Street
- Flood 1/10 Low FEMA zone X (unshaded) · 0% chance over 30 yrs
- Wildfire 4/10 Moderate
- Heat 5/10 Major 7 d/yr ≥106°F today · 17 d/yr by 30 yrs out
- Wind 2/10 Low
- Air quality 2/10 Low 1 unhealthy d/yr today · 1 by 30 yrs out
Nearby sold comps map
Loading sold comps map…
Walkable amenities ~0.75 mi
Loading nearby amenities…
Taxation est. · year 1
- Rental income
- $14,701
- − Mortgage interest
- −$7,282
- − Property taxes
- −$1,950
- − Insurance
- −$650
- − Repairs & maintenance
- −$1,176
- − Management
- −$1,176
- − Depreciation
- −$3,782
- Taxable loss
- −$1,315
- Est. tax savings @ 24.0%
- +$316
- After-tax cash flow
- $1,148/yr
For passive investors: Depreciation is non-cash, so a rental often shows a tax loss while cash-flowing — sheltering income. Rental losses are passive: they offset passive income freely, and up to $25,000/yr can offset ordinary (W-2) income if you actively participate and your MAGI is under $100k (phasing out to $0 by $150k); unused losses carry forward. On sale, claimed depreciation is recaptured at up to 25%, and gains may owe capital-gains tax (a 1031 exchange can defer both). Figures are a year-1 estimate at your 24.0% rate — not tax advice; consult a CPA.
Schools (NCES district)
No district data.
Livability — Wilson
- Score
- 71/100
- State rank
- #140
- US rank
- #6925
Category grades
Schools grade is shown separately in the Schools card above.
Census & demographics
- Census place
- Wilson, KS
Population outlook (Ellsworth County) Hauer SSP2
- Today (2025)
- 6,172 people
- By 2030
- 6,115 · -0.9%
- By 2040
- 6,002 · -2.8%
- By 2050
- 6,064 · -1.7%
- By 2075
- 6,342 · +2.8%
- By 2100
- 6,304 · +2.1%
Not yet ingested
- Political lean
- —
- Race & ethnicity
- —
- Common origin
- —
- Civics
- —
Market trends
- HPI YoY
- —
- Current HPI
- —
- Rent YoY
- —
- Metro
- —
- State GDP YoY
- —
- F500 in state
- 0
Price history
+828.6% since first listed4 events — show timeline
- 2026-04-15 Listed $130,000 Hays MLS
- 1999-12-01 Sold (Public Records) — Public Records
- 1998-08-01 Sold (Public Records) $5,000 Public Records
- 1996-09-01 Sold (Public Records) $14,000 Public Records
Cash-flow waterfall
monthlySold comps — $/sqft
last 12 mo · ≤1 miLoading sold comps…