 Multi-family
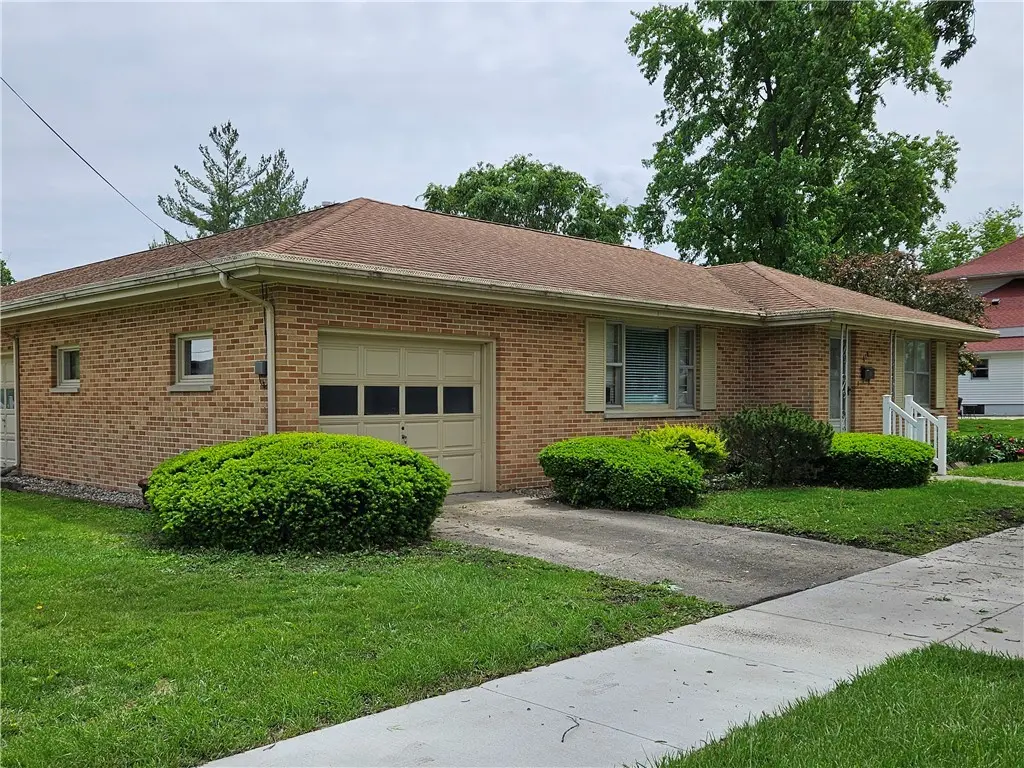
414 N Main St · Sullivan, IL
Flood risk 1/10 · Minimal
- FEMA flood zone
- X (unshaded)
- Chance of flooding over 30 yrs
- 0.0%
- Est. flood insurance / yr
- $507 – $1,088
Fire risk 1/10 · Minimal
- Est. fire insurance / yr
- $804 – $1,492
Heat risk 4/10 · Minor
- Hot days now (above 104°F)
- 7 days/yr
- Hot days in 30 yrs
- 20 days/yr
Wind risk 2/10 · Minimal
- Chance of severe wind over 30 yrs
- 1.0%
Air-quality risk 2/10 · Minimal
- Unhealthy air days now
- 1 days/yr
- Unhealthy air days in 30 yrs
- 1 days/yr
Risk factors via First Street. Map © Google.
Why this score? — see what drove the C grade
The composite is a weighted blend of 9 inputs, each scored 0–100. Each bar is that input's sub-score; the figure is the points it added to the 100-point composite (weight × sub-score).
- Cash flow +28.5/30.0
- DSCR +10.0/10.0
- 1% rule +7.9/10.0
- Livability +3.2/5.0
- Rent growth +2.5/5.0
- Condition / age +2.5/5.0
- Schools +2.1/10.0
- ARV discount +0.0/15.0
- Appreciation +0.0/10.0
$129,900
🖨 Deal sheet (PDF) 📄 Offer letter ✓ Due diligence
Multi-family units
County records classify this as Multi-Family (5+ Unit). Listing-text estimate: 1 unit. estimate disagrees with records
5+ unit building — per-unit beds/baths from public records are typically unavailable; the breakdown below (if shown) is an estimate from the listing text.
Listing remarks
LOCATION, LOCATION! WALK TO PARKS, SCHOOLS, CIVIC CENTER AND DOWNTOWN! THIS IS THE WEST UNIT OF A WELL BUILT BRICK DUPLEX. IT HAS 2 BEDROOMS, A REMODELED BATHROOM, A LARGE LIVINGROOM, A SPACIOUS EAT-IN KITCHEN AND A UTILITY ROOM LEADING TO THE ATTACHED GARAGE! THE HOME HAS OAK HARDWOOD FLOORS THOUGHOUT! NEW FURNACE 2024, HOTWATER HEATER 2025, ROOF 2011. COME TAKE A LOOK!
Key facts
- Remodeled bathroom
- Walk to downtown
- Walk to parks
Tags
Property features AI
Exterior
- Parking: Attached garage (1 car)
- Utilities: Public water; Public sewer; Gas and electric available
- Home design: Single-family residence; One story
- Construction: Brick construction; Asphalt shingle roof; Built on crawl space foundation
- Exterior features: Patio; Concrete road access
Interior
- Kitchen: Range; Refrigerator
- Bedrooms: 5 total rooms (includes bedrooms and living areas)
- Bathrooms: 1 full bathroom
- Heating & cooling: Natural gas heating with forced air; Central air conditioning
- Interior features: Gas water heater; Range; Refrigerator; Crawl space basement
- Laundry & utility: Laundry on main level
Neighborhood map
What this means for you Summary
Snapshot
- This is a 2-bed/1.0-bath multifamily listed at $130k.
Deal economics
- At list price, monthly cash flow is $425 ($5k/yr) — positive.
- The deal already cash-flows at list — no discount required.
- Meets the 1% rule at list price ($2k rent vs $130k).
- Recommended offer: $128k (1.5% below list) — sets the bar for market timing.
- Cap rate 10.2% vs local median 6.4% in Sullivan — top-decile yield for the area; either an underpriced asset or a hidden risk that comps aren't pricing in. Stress-test before assuming the spread holds.
Location & tenants
- Location reads 65/100 on livability (#647 in IL) — a middle-class / working-renter tenant base. Strengths: crime A+, cost of living A+, housing A+; Watch: employment C-, schools F, amenities F.
- Sullivan CUSD 300 (town): math 21% / reading 28% proficiency, ranked #338 of 620 in IL (top 54%) — low school quality limits family demand, transient renter base, plan for 1-2y turnover.
- Market conditions: 42 active listings in the ZIP; 1 comparable units currently listed for rent nearby; 42 units permitted in Moultrie County in 2024 (20 in 5+ unit buildings).
Forward outlook
- Local home prices are declining (-3.0%/yr); year-one equity from $898 of loan paydown is wiped out by about $4k of value loss. Plan a longer hold.
- Moultrie County population projected at -12% by 2050 — secular population decline; favor cash flow + early exit over multi-decade hold.
- At projected returns (-3.0% appreciation + 3.0% rent growth), your $36k cash investment doubles in ~9 years — after that, you're playing with house money.
Negotiation context
- It's been on market 23 days — a 2% lower offer ($128k) is reasonable based on typical stale-listing flexibility.
Questions for the listing agent
- Built in 1963 — when were the roof, HVAC, electrical panel, plumbing, and water heater last replaced?
- Is there a deadline driving the sale (1031 exchange, divorce, estate, relocation)? That informs how much negotiation room exists.
- Schools are F-rated, which usually means shorter tenancies and higher turnover. Who's the typical renter profile here, and what's been the actual vacancy rate?
- What's the average days-on-market for RENTAL listings here right now (not sales)? A rising rental-DOM trend means longer vacancies and softer asking-rent achievability than the comps imply.
- What's the recent tenant-quality profile in this submarket — average credit score on applications, eviction rate, late-payment / NSF rate, and stable-employment percentage? A property-management company in the area should have these aggregated.
- How much new apartment / multifamily construction is in the pipeline within 1–3 miles? Heavy new supply (>2% of stock underway) typically softens rents 12–24 months out; light construction supports rent growth.
Investment metrics
- 1% rule
- 1.29% ✓
- Cap rate
- 10.22%
- Cash-on-cash
- 14.02%
- DSCR
- 1.62
- GRM
- 6.5
CMA / ARV
- ARV (median comp)
- $106,627
- List price
- $129,900
- Delta
- 21.83%
- Verdict
- OVERPRICED
- Comps
- 20 within 1.0 mi
Projected returns pro-forma
-3.0% appreciation · 3.0% rent growth · sell at horizon
- IRR
- 4.3%
- Equity multiple
- 1.17×
- Total profit
- $6,036
- Equity at exit
- $19,369
- IRR
- 13.8%
- Equity multiple
- 2.11×
- Total profit
- $40,200
- Equity at exit
- $11,231
Cash invested: $36,372 (down + closing). Projections, not guarantees.
Landlord ↔ Tenant lean methodology
- Overall (STATE)
- 43 Moderately Tenant-Leaning
- State Illinois
- 43 Moderately Tenant-Leaning · D+7
- County
- — inherits STATE
- City
- — inherits STATE
ZIP-level market 61951
- Home prices YoY
- -7.6%
- Active inventory
- 42
- Price-to-rent
- 13.0×
Monthly cashflow live
- Estimated rent
- $1,672 medium interval (Pro) →
- Mortgage (P&I)
- −$681
- Tax from tax record
- −$161 /mo · $1,928/yr
- Insurance
- −$54
- HOA
- −$0
- Vacancy / Maint / Mgmt
- −$351
- Net cashflow
- $425
Break-even live
Sensitivity live
| Price | -10% $498 | -5% $462 | +0% $425 | +5% $388 | +10% $351 |
|---|---|---|---|---|---|
| Rent | -10% $293 | -5% $359 | +0% $425 | +5% $491 | +10% $557 |
| Rate | -1.0pp $490 | -0.5pp $458 | base $425 | +0.5pp $391 | +1.0pp $357 |
2-unit breakdown (identical units grouped — click to expand)
| Units | Beds | Baths | Est. rent |
|---|---|---|---|
| 2× units | 2 | 1 | $1,672 |
| #1 | 2 | 1 | $836 |
| #2 | 2 | 1 | $836 |
| Total (2 units) | $1,672 | ||
UW: 25.0% down · 7.5% · 30yr · 1.5% tax · 5.0% vac · 8.0% maint · 8.0% mgmt
Financing live
Cash to close
- Down payment
- $32,475
- Closing costs
- $3,897
- Reserves months
- —
- Total cash needed
- —
Loan-product check · same deal, 3 products live
Conventional
25% down · 7.5% · 30yr
- Down + closing
- —
- Monthly P&I
- —
- Monthly cashflow
- —
- DSCR
- —
- Eligible?
- —
Personal DTI + credit; lowest rate.
DSCR
20% down · 8.5% · 30yr
- Down + closing
- —
- Monthly P&I
- —
- Monthly cashflow
- —
- DSCR
- —
- Eligible?
- —
No personal income docs; deal must DSCR.
Hard money
10% down · 12.0% · 12mo
- Down + closing
- —
- Monthly P&I
- —
- Monthly cashflow
- —
- DSCR
- —
- Eligible?
- —
Short-term bridge; refi at stabilization.
Rent comps 1 comps
| Address | Beds | Baths | Sqft | Rent | $/sqft | DOM | Units | Dist |
|---|---|---|---|---|---|---|---|---|
| 1612 S Hamilton St Sullivan, IL | 2.0–3.0 | 2.0 | 1057 | $1,250 | $1.18 | 14d | 3 | 1.45mi |
Listing history 4 events
-
2026-05-17historical Active Under Contract 373-char remark
-
2026-05-06$129,900 Active 373-char remark
-
2026-03-02soldstatus $160,000
-
2011-06-17soldstatus $89,000
ⓘ Source: listings_history table (triggers on properties + properties_extension) + one-shot
backfill from property_details.listing_events for pre-trigger history.
Tax reassessment forecast IL · Partial reset (capped growth)
- Current annual tax
- $1,928 · $161/mo
- Projected year-2 tax
- $2,438 · $203/mo
- Expected delta
- +$510/yr (+$43/mo · 26.5%)
ⓘ Screening estimate from a state-policy table — verify with the county assessor before closing.
Climate risk First Street
- Flood 1/10 Low FEMA zone X (unshaded) · 0% chance over 30 yrs
- Wildfire 1/10 Low
- Heat 4/10 Moderate 7 d/yr ≥104°F today · 20 d/yr by 30 yrs out
- Wind 2/10 Low 100% chance of damaging wind over 30 yrs
- Air quality 2/10 Low 1 unhealthy d/yr today · 1 by 30 yrs out
Nearby sold comps map
Loading sold comps map…
Walkable amenities ~0.75 mi
Loading nearby amenities…
Taxation est. · year 1
- Rental income
- $20,064
- − Mortgage interest
- −$7,276
- − Property taxes
- −$1,928
- − Insurance
- −$650
- − Repairs & maintenance
- −$1,605
- − Management
- −$1,605
- − Depreciation
- −$3,779
- Taxable income
- $3,221
- Est. tax owed @ 24.0%
- −$773
- After-tax cash flow
- $4,326/yr
For passive investors: Depreciation is non-cash, so a rental often shows a tax loss while cash-flowing — sheltering income. Rental losses are passive: they offset passive income freely, and up to $25,000/yr can offset ordinary (W-2) income if you actively participate and your MAGI is under $100k (phasing out to $0 by $150k); unused losses carry forward. On sale, claimed depreciation is recaptured at up to 25%, and gains may owe capital-gains tax (a 1031 exchange can defer both). Figures are a year-1 estimate at your 24.0% rate — not tax advice; consult a CPA.
Schools (NCES district)
- District
- Sullivan CUSD 300
- NCES district ID
- 1738130
- Math proficiency
- 21% ▬ 0.00%
- Reading proficiency
- 28% ▼ -10.00%
- Median HH income
- $47,763
- Composite
- 21.41/100
- National rank
- #8346
- State rank
- #338 of 620 in IL
Livability — Sullivan
- Score
- 65/100
- State rank
- #647
- US rank
- #13204
Category grades
Schools grade is shown separately in the Schools card above.
Census & demographics
- Census place
- Sullivan, IL
- Population (ZIP)
- 7,654
Population outlook (Moultrie County) Hauer SSP2
- Today (2025)
- 14,766 people
- By 2030
- 14,490 · -1.9%
- By 2040
- 13,848 · -6.2%
- By 2050
- 13,063 · -11.5%
- By 2075
- 10,862 · -26.4%
- By 2100
- 7,963 · -46.1%
Race, ethnicity, and origin ACS 2023
- Neighborhood character
- Predominantly White (97%)
- Race & ethnicity
- White 97% Two or more races 2% Black 1%
- Common ancestry
- Lithuanian 1% Italian 1% Slovak 1%
- Foreign-born
- 1%
- Languages at home
- 90% English-only · German/W. Germanic 8% Other Indo-European 1% Spanish 1%
Political lean MEDSL · Moultrie
- 2024 margin
- Solid R (+49.1) · D 24.8% · R 73.8% · Other 1.4%
- 2008→2024 swing
- -36.2pp toward R · 2008: -12.8pp · 2024: -49.1pp
- All cycles
- 2024: R+49.1 2020: R+49.0 2016: R+48.0 2012: R+27.1 2008: R+12.8
Not yet ingested
- Civics
- —
Market trends
- HPI YoY
- ▼ -17.15%
- Current HPI
- 208.2808
- Rent YoY
- —
- Metro
- —
- State GDP YoY
- ▲ 1.59%
- F500 in state
- 60
Industry mix (Fortune 500 HQ in IL)
| Industry | F500 HQs | Revenue |
|---|---|---|
| Insurance | 4 | $201B |
|
||
| Consumer Goods | 4 | $87B |
|
||
| Industrial Machinery | 3 | $64B |
|
||
| Healthcare | 2 | $55B |
|
||
| Retail / Pharmacy | 1 | $148B |
|
||
| Agriculture / Food | 1 | $86B |
|
||
Price history
+46.0% since first listed5 events — show timeline
- 2026-05-29 Pending — CIBR
- 2026-05-17 Contingent — CIBR
- 2026-05-06 Listed $129,900 CIBR
- 2026-03-02 Sold (Public Records) $160,000 Public Records
- 2011-06-17 Sold (Public Records) $89,000 Public Records
Property tax history
+1.8%/yrLatest (2024): $1,928 · +8.9% YoY. Source: county tax records.
Cash-flow waterfall
monthlySold comps — $/sqft
last 12 mo · ≤1 miLoading sold comps…