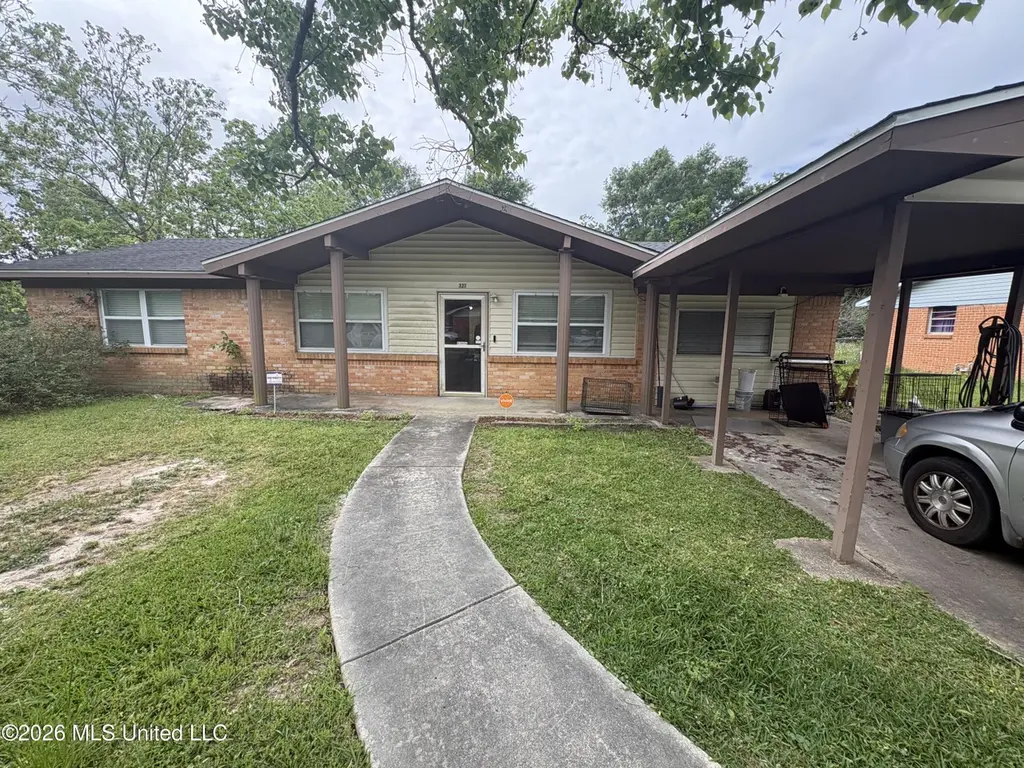
327 Darby St · Gulfport, MS
Flood risk 3/10 · Minor
- FEMA flood zone
- X (unshaded)
- Chance of flooding over 30 yrs
- 0.2%
- Est. flood insurance / yr
- $507 – $1,088
Fire risk 1/10 · Minimal
- Est. fire insurance / yr
- $1,241 – $2,305
Heat risk 10/10 · Severe
- Hot days now (above 107°F)
- 7 days/yr
- Hot days in 30 yrs
- 22 days/yr
Wind risk 9/10 · Severe
- Chance of severe wind over 30 yrs
- 99.0%
Air-quality risk 1/10 · Minimal
- Unhealthy air days now
- 0 days/yr
- Unhealthy air days in 30 yrs
- 0 days/yr
Risk factors via First Street. Map © Google.
Why this score? — see what drove the B+ grade
The composite is a weighted blend of 9 inputs, each scored 0–100. Each bar is that input's sub-score; the figure is the points it added to the 100-point composite (weight × sub-score).
- Cash flow +30.0/30.0
- ARV discount +15.0/15.0
- DSCR +10.0/10.0
- 1% rule +8.2/10.0
- Rent growth +4.2/5.0
- Schools +4.2/10.0
- Livability +3.7/5.0
- Condition / age +2.5/5.0
- Appreciation +0.0/10.0
$116,900
🖨 Deal sheet 📄 Offer letter ✓ Due diligence
Listing remarks
Affordable with great bones! This three bedroom home is primed for its finishing touches and priced to sell! With a five year old HVAC, an office space that could be converted to a fourth bedroom, and a corner lot- the main features of this brick home are ideal for entry level homeowners and rental acquisitions alike. The home features a traditional layout with separate living and dining/kitchen. The exterior impresses with covered carport and back patio that includes privacy fence and shed. Make the finishing touches your own for an instant turnkey rental, rehab, or primary home with affordable taxes and minimal updates.
Key facts
- Shed
- Covered carport
- Privacy fence
Tags
Property features AI
Exterior
- Parking: Carport (1 space)
- Utilities: Public water; Public sewer; Electricity connected; Natural gas connected
- Home design: Single family residence (house); One story
- Construction: Brick construction; Shingle roof; Slab foundation; Built (year from public records)
- Exterior features: Private yard; Corner lot; Shed(s)
Interior
- Kitchen: Oven; Refrigerator
- Bathrooms: 1 full bathroom; 1 half bathroom (1.5 total)
- Heating & cooling: Central heating (natural gas); Central air conditioning
- Interior features: Oven; Refrigerator
Neighborhood map
What this means for you Summary
Snapshot
- This is a 3-bed/1.5-bath single-family listed at $117k.
Deal economics
- At list price, monthly cash flow is $516 ($6k/yr) — positive.
- The deal already cash-flows at list — no discount required.
- Meets the 1% rule at list price ($2k rent vs $117k).
- Cap rate 11.6% vs local median 4.9% in Gulfport — top-decile yield for the area; either an underpriced asset or a hidden risk that comps aren't pricing in. Stress-test before assuming the spread holds.
Location & tenants
- Location reads 73/100 on livability (#15 in MS) — a middle-class / working-renter tenant base. Strengths: cost of living A+, housing A+, health & safety A+; Watch: schools D, amenities F, commute F.
- Harrison County School District (rural): math 52% / reading 46% proficiency, ranked #14 of 130 in MS (top 11%) — families likely to look elsewhere, expect single-tenant / working-renter base with shorter leases; 62% free/reduced lunch — lower-income household profile, screen leases tightly.
- Market conditions: Rents rising fast (+7.0%/yr); 763 active listings in the ZIP; 22 comparable units currently listed for rent nearby; rentals lingering (median 44d on market — plan ~5-8 weeks vacancy on turnover, expect pricing pressure); 64% of comp listings sitting > 30 days — soft ceiling on asking rent; 2,194 units permitted in Harrison County in 2024 (0 in 5+ unit buildings).
Forward outlook
- Local home prices are declining (-3.0%/yr); year-one equity from $808 of loan paydown is wiped out by about $4k of value loss. Plan a longer hold.
- Harrison County population projected at +27% by 2050 — long-run rental-demand tailwind backs the buy-and-hold thesis.
- At projected returns (-3.0% appreciation + 7.0% rent growth), your $33k cash investment doubles in ~6 years — after that, you're playing with house money.
Negotiation context
- Only 5 days on market — expect competitive offers; lowballing is unlikely to land.
Risks & watch-outs
- Climate carrying-cost: severe wind risk, 99% chance of damaging wind over 30y; extreme-heat days projected 7→22/yr by 2055 (HVAC capex compounding) — expect insurance premiums to compound above CPI over the hold.
Questions for the listing agent
- Built in 1968 — when were the roof, HVAC, electrical panel, plumbing, and water heater last replaced?
- Is there a deadline driving the sale (1031 exchange, divorce, estate, relocation)? That informs how much negotiation room exists.
- Schools are D-rated, which usually means shorter tenancies and higher turnover. Who's the typical renter profile here, and what's been the actual vacancy rate?
- What's the average days-on-market for RENTAL listings here right now (not sales)? A rising rental-DOM trend means longer vacancies and softer asking-rent achievability than the comps imply.
- What's the recent tenant-quality profile in this submarket — average credit score on applications, eviction rate, late-payment / NSF rate, and stable-employment percentage? A property-management company in the area should have these aggregated.
- How much new for-sale + rental construction is in the pipeline within 1–3 miles? Heavy new supply typically softens prices + rents 12–24 months out; constrained supply supports both.
Investment metrics
- 1% rule
- 1.32% ✓
- Cap rate
- 11.59%
- Cash-on-cash
- 18.92%
- DSCR
- 1.84
- GRM
- 6.3
CMA / ARV
- ARV (median comp)
- $170,654
- List price
- $116,900
- Delta
- -31.50%
- Verdict
- UNDERPRICED
- Comps
- 20 within 1.0 mi
Show comp detail 12 sales within ~0.75 mi
| Address | Dist | Beds/Ba | Sqft | Sold | Price | $/sf | Match |
|---|---|---|---|---|---|---|---|
| 119 Gahan Dr | 0.33mi | 3/1.5 | 1,100 (+1%) | 3mo | $145,000 | $132 | 81 |
| 11433 Klein Rd | 0.34mi | 3/1.5 | 1,150 (+5%) | 3mo | $70,000 | $61 | 73 |
| 104 Estes St | 0.38mi | 3/2.0 | 1,109 (+2%) | 6mo | $100,000 | $90 | 72 |
| 120 Imilda Dr | 0.20mi | 3/2.0 | 1,200 (+10%) | 3mo | $79,900 | $67 | 70 |
| 11406 Harris Dr | 0.52mi | 3/1.5 | 1,070 (-2%) | 4mo | $165,000 | $154 | 69 |
| 710 Beverly Dr | 0.34mi | 3/2.0 | 1,014 (-7%) | 3mo | $140,000 | $138 | 68 |
| 801 Shirley Dr | 0.40mi | 3/1.5 | 986 (-10%) | 5mo | $80,750 | $82 | 61 |
| 305 Lavelle Dr | 0.61mi | 3/2.0 | 1,050 (-4%) | 3mo | $140,000 | $133 | 61 |
| 103 Phylis Dr | 0.66mi | 3/2.0 | 1,057 (-3%) | 4mo | $99,900 | $95 | 59 |
| 413 N Wilson Blvd | 0.47mi | 3/1.0 | 1,000 (-8%) | 4mo | $125,000 | $125 | 58 |
| 1010 Michelle Dr | 0.29mi | 3/2.0 | 1,252 (+15%) | 4mo | $159,900 | $128 | 57 |
| 12011 Three Rivers Rd | 0.72mi | 2/1.0 (-1) | 960 (-12%) | 2mo | $125,000 | $130 | 37 |
Match score weights: distance 35% · size 25% · config 20% · recency 20%. Top-matched comps best support the ARV.
Projected returns pro-forma
-3.0% appreciation · 6.99% rent growth · sell at horizon
- IRR
- 14.8%
- Equity multiple
- 1.62×
- Total profit
- $20,349
- Equity at exit
- $17,430
- IRR
- 26.2%
- Equity multiple
- 3.71×
- Total profit
- $88,677
- Equity at exit
- $10,107
Cash invested: $32,732 (down + closing). Projections, not guarantees.
Landlord ↔ Tenant lean methodology
- Overall (STATE)
- 90 Strongly Landlord-Friendly
- State Mississippi
- 90 Strongly Landlord-Friendly · R+11
- County
- — inherits STATE
- City
- — inherits STATE
ZIP-level market 39503
- Home prices YoY
- -21.5%
- Rents YoY
- 7.0%
- Active inventory
- 763
- Price-to-rent
- 6.3×
Monthly cashflow live
- Estimated rent
- $1,548 high interval (Pro) →
- Mortgage (P&I)
- −$613
- Tax from tax record
- −$45 /mo · $537/yr
- Insurance
- −$49
- HOA
- −$0
- Vacancy / Maint / Mgmt
- −$325
- Net cashflow
- $516
Break-even live
UW: 25.0% down · 7.5% · 30yr · 1.5% tax · 5.0% vac · 8.0% maint · 8.0% mgmt
Financing live
Cash to close
- Down payment
- $29,225
- Closing costs
- $3,507
- Reserves months
- —
- Total cash needed
- —
Loan-product check · same deal, 3 products live
Conventional
25% down · 7.5% · 30yr
- Down + closing
- —
- Monthly P&I
- —
- Monthly cashflow
- —
- DSCR
- —
- Eligible?
- —
Personal DTI + credit; lowest rate.
DSCR
20% down · 8.5% · 30yr
- Down + closing
- —
- Monthly P&I
- —
- Monthly cashflow
- —
- DSCR
- —
- Eligible?
- —
No personal income docs; deal must DSCR.
Hard money
10% down · 12.0% · 12mo
- Down + closing
- —
- Monthly P&I
- —
- Monthly cashflow
- —
- DSCR
- —
- Eligible?
- —
Short-term bridge; refi at stabilization.
Rent comps 22 comps
| Address | Beds | Baths | Sqft | Rent | $/sqft | DOM | Units | Dist |
|---|---|---|---|---|---|---|---|---|
| 125 Clarence Dr Gulfport, MS | 3.0 | 2.0 | 1300 | $1,500 | $1.15 | 13d | 1 | 0.19mi |
| 1009 Michelle Dr Gulfport, MS | 4.0 | 2.0 | 1254 | $1,650 | $1.32 | 43d | 1 | 0.28mi |
| 101 Fore St Gulfport, MS | 3.0 | 2.0 | 1215 | $1,700 | $1.40 | 13d | 1 | 0.41mi |
| 11200 Three Rivers Rd Gulfport, MS | 3.0 | 2.0 | 1124 | $1,445 | $1.29 | 13d | 1 | 0.59mi |
| 11200 Three Rivers Rd Gulfport, MS | 2.0 | 2.0 | 1042 | $1,147 | $1.10 | 43d | 1 | 0.59mi |
| 11502 Camden Court Cir Gulfport, MS | 3.0 | 2.0 | 1495 | $1,775 | $1.19 | 21d | 1 | 0.70mi |
| 11405 Camden Court Cir Gulfport, MS | 3.0 | 2.0 | 1495 | $1,775 | $1.19 | 43d | 1 | 0.76mi |
| 11413 Camden Court Cir Gulfport, MS | 3.0 | 2.0 | 1495 | $1,775 | $1.19 | 43d | 1 | 0.76mi |
| 11487 Camden Court Cir Gulfport, MS | 3.0 | 2.0 | 1495 | $1,775 | $1.19 | 43d | 1 | 0.76mi |
| 11425 Camden Court Cir Gulfport, MS | 3.0 | 2.0 | 1495 | $1,775 | $1.19 | 21d | 1 | 0.76mi |
| 11213 Dobson Rd Gulfport, MS | 2.0 | 1.0 | 900 | $1,200 | $1.33 | 43d | 1 | 0.80mi |
| 12040 Highland Ave Gulfport, MS | 3.0 | 2.0 | 1019 | $950 | $0.93 | 13d | 1 | 0.87mi |
| 10479 Cal Ln Gulfport, MS | 2.0 | 1.5 | 1200 | $950 | $0.79 | 21d | 1 | 0.95mi |
| 14437 Whitney Dr Gulfport, MS | 2.0 | 1.5 | 1200 | $1,200 | $1.00 | 43d | 1 | 0.95mi |
| 12147 Prudie Cir Gulfport, MS | 3.0 | 2.0 | 1100 | $975 | $0.89 | 43d | 1 | 0.97mi |
| 10471 Three Rivers Rd Gulfport, MS | 1.0–2.0 | 1.0–2.0 | 778 | $1,050 | $1.35 | 43d | 1 | 0.99mi |
| 15373 Saint Charles St Gulfport, MS | 3.0 | 1.0–3.0 | 1075 | $1,350 | $1.26 | 43d | 2 | 1.07mi |
| 15251 Parkwood Dr N Gulfport, MS | 3.0 | 2.5 | 1200 | $1,200 | $1.00 | 43d | 1 | 1.21mi |
| 15235 Oneal Rd Gulfport, MS | 2.0 | 2.0 | 1101 | $1,200 | $1.09 | 13d | 1 | 1.29mi |
| 14180 Oneal Rd Gulfport, MS | 2.0 | 1.0 | 1000 | $1,100 | $1.10 | 43d | 2 | 1.30mi |
| 12450 Three Rivers Rd Gulfport, MS | 3.0 | 2.0 | 1098 | $1,295 | $1.18 | 43d | 1 | 1.30mi |
| 13242 Warren Dr Gulfport, MS | 2.0 | 2.0 | 1012 | $1,100 | $1.09 | 43d | 1 | 1.40mi |
Listing history 4 events
-
2026-05-17status Pending 629-char remark
-
2026-05-14price $116,900 629-char remark
-
2026-05-12$117,500 Active 629-char remark
-
2022-07-18soldstatus
ⓘ Source: listings_history table (triggers on properties + properties_extension) + one-shot
backfill from property_details.listing_events for pre-trigger history.
Tax reassessment forecast MS · Resets to sale price
- Current annual tax
- $537 · $45/mo
- Projected year-2 tax
- $924 · $77/mo
- Expected delta
- +$387/yr (+$32/mo · 72.0%)
ⓘ Screening estimate from a state-policy table — verify with the county assessor before closing.
Climate risk First Street
- Flood 3/10 Moderate FEMA zone X (unshaded) · 20% chance over 30 yrs
- Wildfire 1/10 Low
- Heat 10/10 Extreme 7 d/yr ≥107°F today · 22 d/yr by 30 yrs out
- Wind 9/10 Extreme 99% chance of damaging wind over 30 yrs
- Air quality 1/10 Low 0 unhealthy d/yr today · 0 by 30 yrs out
Nearby sold comps map
Loading sold comps map…
Walkable amenities ~0.75 mi
Loading nearby amenities…
Taxation est. · year 1
- Rental income
- $18,570
- − Mortgage interest
- −$6,548
- − Property taxes
- −$537
- − Insurance
- −$584
- − Repairs & maintenance
- −$1,486
- − Management
- −$1,486
- − Depreciation
- −$3,401
- Taxable income
- $4,529
- Est. tax owed @ 24.0%
- −$1,087
- After-tax cash flow
- $5,106/yr
For passive investors: Depreciation is non-cash, so a rental often shows a tax loss while cash-flowing — sheltering income. Rental losses are passive: they offset passive income freely, and up to $25,000/yr can offset ordinary (W-2) income if you actively participate and your MAGI is under $100k (phasing out to $0 by $150k); unused losses carry forward. On sale, claimed depreciation is recaptured at up to 25%, and gains may owe capital-gains tax (a 1031 exchange can defer both). Figures are a year-1 estimate at your 24.0% rate — not tax advice; consult a CPA.
Schools (NCES district)
- District
- Harrison County School District
- NCES district ID
- 2801770
- Math proficiency
- 52% ▼ -4.00%
- Reading proficiency
- 46% ▼ -4.00%
- Median HH income
- $46,504
- Composite
- 41.66/100
- National rank
- #3419
- State rank
- #14 of 130 in MS
Livability — Gulfport
- Score
- 73/100
- State rank
- #15
- US rank
- #5010
Category grades
Schools grade is shown separately in the Schools card above.
Census & demographics
- Census place
- Gulfport, MS
- County
- Harrison County · 178,171 people
- City population
- 96,188
- Metro
- Gulfport-Biloxi, MS
- Population (ZIP)
- 55,059
- Household income
- $62,641
- Rent vs Own
- Severe rent burden
- 1686.0
Population outlook (Harrison County) Hauer SSP2
- Today (2025)
- 228,444 people
- By 2030
- 241,942 · +5.9%
- By 2040
- 267,531 · +17.1%
- By 2050
- 291,062 · +27.4%
- By 2075
- 346,711 · +51.8%
- By 2100
- 378,165 · +65.5%
Race, ethnicity, and origin ACS 2023
- Neighborhood character
- Diverse neighborhood (Simpson 0.58)
- Race & ethnicity
- White 58% Black 27% Two or more races 9% Hispanic / Latino 6% Asian 2%
- Hispanic origin (detail)
- Mexican 2% Puerto Rican 1%
- Common ancestry
- Lithuanian 5% Slovak 1% Portuguese 1%
- Foreign-born
- 3% · Canada
- Languages at home
- 95% English-only · Spanish 3%
Political lean MEDSL · Harrison
- 2024 margin
- Strong R (+28.9) · D 35.0% · R 63.9% · Other 1.1%
- 2008→2024 swing
- -2.9pp toward R · 2008: -26.0pp · 2024: -28.9pp
- All cycles
- 2024: R+28.9 2020: R+25.2 2016: R+30.7 2012: R+26.6 2008: R+26.0
Not yet ingested
- Civics
- —
Market trends
- HPI YoY
- ▼ -51.39%
- Current HPI
- 187.285
- Rent YoY
- ▲ 6.99%
- Metro
- Gulfport-Biloxi, MS
- State GDP YoY
- —
- F500 in state
- 0
Price history
-0.5% since first listed4 events — show timeline
- 2026-05-17 Pending — MLSU
- 2026-05-14 Price Changed $116,900 MLSU
- 2026-05-12 Listed $117,500 MLSU
- 2022-07-18 Sold (Public Records) — Public Records
Property tax history
-1.3%/yrLatest (2023): $537 · -0.9% YoY. Source: county tax records.
Cash-flow waterfall
monthlySold comps — $/sqft
last 12 mo · ≤1 miLoading sold comps…