2422 Jeffries St · Dallas, TX
Flood risk No data
- FEMA flood zone
- —
- Chance of flooding over 30 yrs
- —
- Est. flood insurance / yr
- —
Fire risk No data
- Est. fire insurance / yr
- —
Heat risk No data
- Hot days now (above threshold)
- —
- Hot days in 30 yrs
- —
Wind risk No data
- Chance of severe wind over 30 yrs
- —
Air-quality risk No data
- Unhealthy air days now
- —
- Unhealthy air days in 30 yrs
- —
Risk factors via First Street. Map © Google.
Why this score? — see what drove the D grade
The composite is a weighted blend of 9 inputs, each scored 0–100. Each bar is that input's sub-score; the figure is the points it added to the 100-point composite (weight × sub-score).
- Cash flow +7.8/30.0
- ARV discount +7.5/15.0
- Appreciation +5.4/10.0
- Condition / age +4.8/5.0
- Rent growth +4.3/5.0
- Livability +4.0/5.0
- Schools +2.8/10.0
- 1% rule +2.3/10.0
- DSCR +1.9/10.0
$399,000
🖨 Deal sheet 📄 Offer letter ✓ Due diligence
Listing remarks
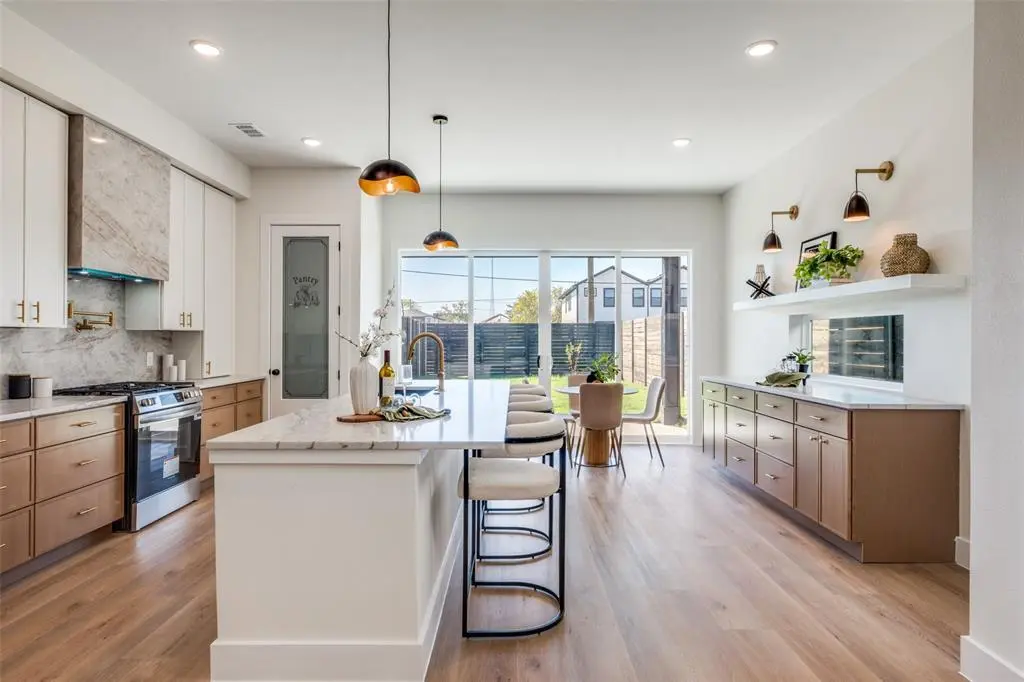
A rare gem and the first of its kind in this rapidly evolving Dallas pocket — minutes from Downtown, Deep Ellum, and Fair Park. This single family attached delivers custom-home quality at an attainable price. Every finish has been hand-selected to reflect high-end design: sleek fixtures, premium flooring, and modern architecture that stands out from the rest. Perfect for a first-time buyer or investor, this home represents the next level of urban living in one of Dallas’s fastest-growing areas.
Key facts
- 3,750 sq ft lot
- 2 garage spots
- Built 2026
Property features AI
Finance
- Financial info: Second mortgage present; Listing accepts Cash, Conventional, FHA, VA Loan, and 1031 Exchange
- HOA & community: No association (no HOA)
Exterior
- Parking: Attached 2-car garage; 2 covered parking spaces
- Security: Smoke detectors; Carbon monoxide detectors; Fire alarm; Security gate
- Utilities: City water; City sewer; Municipal utility district not present
- Home design: Single family residence (attached); Two stories; New construction completed in 2026
- Construction: Brick and siding exterior; Composition roof; Slab foundation; Built in 2026 (new construction - complete)
- Exterior features: Covered porch(es); Private entrance; Property attached (townhome/attached unit)
Interior
- Kitchen: Commercial grade vent; Gas cooktop and gas range; Electric oven; Microwave; Dishwasher; Disposal; Kitchen island; Eat-in kitchen
- Bedrooms: Primary bedroom (upstairs) with ensuite bath, garden tub, separate shower, dual sinks, built-in cabinets, and walk-in closet; Second bedroom (upstairs) with walk-in closet; Third bedroom (upstairs)
- Flooring: Luxury vinyl plank; Tile; Wood
- Bathrooms: Two full bathrooms and one half bath; Primary bath features garden tub, separate shower and dual sinks
- Heating & cooling: Central heating (electric); Central air conditioning (electric); Ceiling fans
- Interior features: Open floorplan with vaulted ceilings; Built-in features including built-in cabinets and wine cooler; Chandelier and decorative lighting; Cable TV available; Eat-in kitchen with kitchen island; Double vanity in primary bath; Natural woodwork; Walk-in closets
- Laundry & utility: Electric water heater
Neighborhood map
What this means for you Summary
Snapshot
- This is a 3-bed/2.5-bath single-family listed at $399k. Condition is rated excellent.
Deal economics
- At list price, monthly cash flow is $-443 ($-5k/yr) — negative.
- To cash-flow at today's rent, offer at most $335k (16.1% below list).
- To meet the 1% rule (rent ≥ 1% of price), the offer needs to be $293k (26.6% below list).
- Recommended offer: $293k (26.6% below list) — sets the bar for 1% rule.
- Cap rate 5.0% vs local median 2.3% in Dallas — top-decile yield for the area; either an underpriced asset or a hidden risk that comps aren't pricing in. Stress-test before assuming the spread holds.
Location & tenants
- Location reads 81/100 on livability (#24 in TX, #1,380 nationally) — a professional / high-income tenant draw. Strengths: amenities A+, commute A+, housing A+; Watch: crime F.
- Dallas ISD (urban): math 31% / reading 36% proficiency, ranked #559 of 826 in TX (top 68%) — families likely to look elsewhere, expect single-tenant / working-renter base with shorter leases; 83% free/reduced lunch — lower-income household profile, screen leases tightly.
- Zoned schools: Paul L Dunbar Learning Center (math 27% / reading 22%, grade F, #3,052 of 4,322 statewide, top 74%, 531 students, 95% FRL).
- Market conditions: Rents rising fast (+7.2%/yr); 248 active listings in the ZIP; 40 comparable units currently listed for rent nearby; rentals at typical pace (median 24d on market — plan ~3-4 weeks tenant-placement turnaround); 12,577 units permitted in Dallas County in 2024 (6,829 in 5+ unit buildings).
- At $2,930/mo this rent would consume 77% of the median local household income ($46k/yr) (locally 1464% of renters already pay >50% of income on rent) — very limited rent-growth headroom before tenants either downsize or default.
Forward outlook
- In year one you build about $6k of equity ($3k loan paydown + $3k appreciation (0.8% local appreciation)).
- Dallas County population projected at +35% by 2050 — long-run rental-demand tailwind backs the buy-and-hold thesis.
- By year 6, paydown + projected appreciation supports a ~$35k cash-out refi (75% LTV) — recoverable capital for the next deal without selling this one.
Negotiation context
- Only 2 days on market — expect competitive offers; lowballing is unlikely to land.
Questions for the listing agent
- What do current leases actually rent for vs. the listed asking? Can we see a recent rent roll and the last 12 months of T-12 income?
- Is there a deadline driving the sale (1031 exchange, divorce, estate, relocation)? That informs how much negotiation room exists.
- Crime grade is F in this area — have there been break-ins, vandalism, or insurance claims at this property in the last 3 years? What carrier currently insures it and at what premium?
- The area grade is low — what's the realistic commute time and amenity access for the typical tenant pool here? Any planned neighborhood developments (good or bad) we should know about?
- What's the average days-on-market for RENTAL listings here right now (not sales)? A rising rental-DOM trend means longer vacancies and softer asking-rent achievability than the comps imply.
- What's the recent tenant-quality profile in this submarket — average credit score on applications, eviction rate, late-payment / NSF rate, and stable-employment percentage? A property-management company in the area should have these aggregated.
- How much new for-sale + rental construction is in the pipeline within 1–3 miles? Heavy new supply typically softens prices + rents 12–24 months out; constrained supply supports both.
Investment metrics
- 1% rule
- 0.73% ✗
- Cap rate
- 4.96%
- Cash-on-cash
- -4.76%
- DSCR
- 0.79
- GRM
- 11.3
CMA / ARV
- ARV (on-the-fly)
- $399,317
- Comps found
- 12
Show comp detail 12 sales within ~0.75 mi
| Address | Dist | Beds/Ba | Sqft | Sold | Price | $/sf | Match |
|---|---|---|---|---|---|---|---|
| 2422 Jeffries St | 0.00mi | 3/2.5 | 2,069 (0%) | 0mo | $399,000 | $193 | 100 |
| 2424 Jeffries St | 0.01mi | 3/2.5 | 2,069 (0%) | 1mo | $399,000 | $193 | 99 |
| 2415 Meyers St | 0.06mi | 3/2.5 | 2,069 (0%) | 6mo | $399,000 | $193 | 92 |
| 2419 Merlin St | 0.09mi | 3/2.5 | 1,874 (-9%) | 6mo | $375,000 | $200 | 75 |
| 2417 Merlin St | 0.09mi | 3/2.5 | 1,874 (-9%) | 6mo | $375,000 | $200 | 75 |
| 2410 Jeffries St | 0.03mi | 3/3.5 | 1,800 (-13%) | 6mo | $360,000 | $200 | 68 |
| 2412 Jeffries St | 0.02mi | 3/3.5 | 1,800 (-13%) | 8mo | $369,000 | $205 | 67 |
| 2022 Bourbon St | 0.28mi | 4/2.0 (+1) | 1,950 (-6%) | 5mo | $119,500 | $61 | 66 |
| 2508 Park Row Ave | 0.53mi | 3/1.0 | 1,943 (-6%) | 5mo | $210,000 | $108 | 55 |
| 2620 Peabody Ave | 0.65mi | 3/3.5 | 1,850 (-11%) | 3mo | $345,000 | $186 | 45 |
| 2527 Pennsylvania Ave | 0.72mi | 3/2.5 | 1,883 (-9%) | 10mo | $355,000 | $189 | 43 |
| 2812 Pennsylvania Ave | 0.68mi | 4/2.0 (+1) | 1,772 (-14%) | 6mo | $290,700 | $164 | 32 |
Match score weights: distance 35% · size 25% · config 20% · recency 20%. Top-matched comps best support the ARV.
Projected returns pro-forma
0.79% appreciation · 7.19% rent growth · sell at horizon
- IRR
- -2.1%
- Equity multiple
- 0.89×
- Total profit
- $-11,920
- Equity at exit
- $131,852
- IRR
- 5.6%
- Equity multiple
- 1.73×
- Total profit
- $81,010
- Equity at exit
- $171,897
Cash invested: $111,720 (down + closing). Projections, not guarantees.
Landlord ↔ Tenant lean methodology
- Overall (STATE)
- 87 Strongly Landlord-Friendly
- State Texas
- 87 Strongly Landlord-Friendly · R+5
- County
- — inherits STATE
- City
- — inherits STATE
ZIP-level market 75215
- Home prices YoY
- 0.3%
- Rents YoY
- 7.2%
- Active inventory
- 248
- Price-to-rent
- 11.3×
Monthly cashflow live
- Estimated rent
- $2,930 high interval (Pro) →
- Mortgage (P&I)
- −$2,092
- Tax est. 1.5%
- −$499 /mo · $5,985/yr
- Insurance
- −$166
- HOA
- −$0
- Vacancy / Maint / Mgmt
- −$615
- Net cashflow
- $-443
Break-even live
UW: 25.0% down · 7.5% · 30yr · 1.5% tax · 5.0% vac · 8.0% maint · 8.0% mgmt
Financing live
Cash to close
- Down payment
- $99,750
- Closing costs
- $11,970
- Reserves months
- —
- Total cash needed
- —
Loan-product check · same deal, 3 products live
Conventional
25% down · 7.5% · 30yr
- Down + closing
- —
- Monthly P&I
- —
- Monthly cashflow
- —
- DSCR
- —
- Eligible?
- —
Personal DTI + credit; lowest rate.
DSCR
20% down · 8.5% · 30yr
- Down + closing
- —
- Monthly P&I
- —
- Monthly cashflow
- —
- DSCR
- —
- Eligible?
- —
No personal income docs; deal must DSCR.
Hard money
10% down · 12.0% · 12mo
- Down + closing
- —
- Monthly P&I
- —
- Monthly cashflow
- —
- DSCR
- —
- Eligible?
- —
Short-term bridge; refi at stabilization.
Rent comps 40 comps
| Address | Beds | Baths | Sqft | Rent | $/sqft | DOM | Units | Dist |
|---|---|---|---|---|---|---|---|---|
| 2408 Meyers St Unit 204 Dallas, TX | 2.0 | 1.0 | 2375 | $770 | $0.32 | 2d | 1 | 0.05mi |
| 2406 Merlin St Dallas, TX | 3.0 | 2.5 | 2004 | $2,500 | $1.25 | 7d | 1 | 0.10mi |
| 3230 Elihu St #5 Dallas, TX | 2.0 | 3.5 | 1400 | $2,700 | $1.93 | 43d | 1 | 0.39mi |
| 3230 Elihu St #2 Dallas, TX | 2.0 | 3.5 | 1400 | $2,300 | $1.64 | 43d | 1 | 0.39mi |
| 3900 Commerce St Dallas, TX | 2.0 | 1.0–2.0 | 1217 | $3,925 | $3.22 | 6d | 10 | 0.61mi |
| 2900 Canton St Dallas, TX | 1.0–2.0 | 1.0–2.0 | 1029 | $2,525 | $2.45 | 1d | 14 | 0.63mi |
| 3131 Main St Dallas, TX | 2.0 | 1.0–2.0 | 989 | $3,400 | $3.44 | 1d | 28 | 0.70mi |
| 835 S Good Latimer Expy Dallas, TX | 2.0 | 1.0–2.0 | 1198 | $2,680 | $2.24 | 2d | 26 | 0.75mi |
| 1874 Beaumont St Dallas, TX | 4.0 | 5.0 | 2578 | $4,900 | $1.90 | 43d | 1 | 0.77mi |
| 2507 Birmingham Ave Dallas, TX | 3.0 | 2.5 | 1516 | $2,500 | $1.65 | 24d | 1 | 0.83mi |
| 3308 Birmingham Ave Unit 1 Dallas, TX | 2.0 | 2.5 | 1451 | $2,275 | $1.57 | 24d | 1 | 0.84mi |
| 3308 Birmingham Ave Unit 11 Dallas, TX | 2.0 | 2.5 | 1505 | $2,375 | $1.58 | 43d | 1 | 0.84mi |
| 3308 Birmingham Ave Unit 03 Dallas, TX | 2.0 | 2.5 | 1451 | $2,275 | $1.57 | 43d | 1 | 0.84mi |
| 2210 Canton St Dallas, TX | 1.0–2.0 | 1.0–2.0 | 1138 | $2,349 | $2.06 | 1d | 55 | 0.89mi |
| 1512 Seegar St Unit 1508 Dallas, TX | 3.0 | 3.5 | 2003 | $3,250 | $1.62 | 43d | 1 | 0.97mi |
| 1508 Seegar St Dallas, TX | 3.0 | 3.5 | 1966 | $3,124 | $1.59 | 14d | 9 | 0.98mi |
| 2531 Elm St Dallas, TX | 3.0 | 3.0 | 1732 | $4,616 | $2.67 | 18d | 1 | 0.99mi |
| 2531 Elm St Dallas, TX | 3.0 | 3.0 | 1732 | $4,616 | $2.67 | 22d | 1 | 0.99mi |
| 2525 Elm St Dallas, TX | 3.0 | 1.0–3.0 | 1191 | $4,096 | $3.44 | 1d | 36 | 1.01mi |
| 3502 Edgewood St Dallas, TX | 4.0 | 2.0 | 1866 | $2,523 | $1.35 | 1d | 1 | 1.03mi |
| 1805 Browder St #103 Dallas, TX | 3.0 | 3.5 | 2358 | $8,000 | $3.39 | 43d | 1 | 1.06mi |
| 1805 Browder St Unit 1019612P Dallas, TX | 3.0 | 3.5 | 2357 | $6,830 | $2.90 | 6d | 1 | 1.06mi |
| 2121 Albany St Dallas, TX | 2.0 | 2.5 | 2414 | $4,200 | $1.74 | 43d | 1 | 1.07mi |
| 2121 Albany St Dallas, TX | 2.0 | 2.5 | 1997 | $4,150 | $2.08 | 24d | 1 | 1.07mi |
| 1552 Cosette Dr Dallas, TX | 2.0 | 2.5 | 2344 | $3,355 | $1.43 | 16d | 1 | 1.08mi |
| 3413 Wendelkin St Dallas, TX | 3.0 | 2.5 | 1724 | $2,650 | $1.54 | 1d | 1 | 1.14mi |
| 317 Alcalde St Unit 1018276P Dallas, TX | 4.0 | 2.5 | 2292 | $22,489 | $9.81 | 24d | 1 | 1.15mi |
| 1514 Washington St Unit 105 Dallas, TX | 2.0 | 2.5 | 1404 | $2,950 | $2.10 | 7d | 1 | 1.16mi |
| 3521 S Harwood St Dallas, TX | 3.0 | 2.5 | 1750 | $2,700 | $1.54 | 2d | 1 | 1.16mi |
| 1100 Corinth St Dallas, TX | 2.0–3.0 | 2.5–3.5 | 1572 | $3,595 | $2.29 | 43d | 10 | 1.17mi |
| 4502 Reiger Ave Unit 2 Dallas, TX | 4.0 | 3.0 | 1500 | $6,750 | $4.50 | 43d | 1 | 1.18mi |
| 4717 Garland Ave Dallas, TX | 3.0 | 2.5 | 2356 | $3,000 | $1.27 | 43d | 1 | 1.20mi |
| 1245 Gano St #602 Dallas, TX | 2.0 | 2.5 | 2465 | $2,800 | $1.14 | 22d | 1 | 1.22mi |
| 4807 Parry Ave Dallas, TX | 4.0 | 3.0 | 2024 | $2,800 | $1.38 | 43d | 1 | 1.22mi |
| 4526 Reiger Ave Dallas, TX | 4.0 | 2.5 | 2728 | $3,000 | $1.10 | 24d | 1 | 1.23mi |
| 3915 Coolidge St Dallas, TX | 4.0 | 2.0 | 1416 | $2,100 | $1.48 | 43d | 1 | 1.25mi |
| 400 S Saint Paul St Dallas, TX | 3.0 | 1.0–3.0 | 1036 | $4,375 | $4.22 | 2d | 116 | 1.29mi |
| 1111 S Akard St Unit 9258 Dallas, TX | 2.0 | 2.0 | 1426 | $2,142 | $1.50 | 43d | 1 | 1.31mi |
| 1919 Jackson St Dallas, TX | 3.0 | 1.0–3.5 | 1543 | $5,485 | $3.55 | 1d | 20 | 1.31mi |
| 3028 Carmel St Dallas, TX | 3.0 | 3.5 | 1947 | $3,450 | $1.77 | 24d | 1 | 1.32mi |
Listing history 2 events
-
2026-05-09status Pending
-
2026-05-07$399,000 Active
ⓘ Source: listings_history table (triggers on properties + properties_extension) + one-shot
backfill from property_details.listing_events for pre-trigger history.
Nearby sold comps map
Loading sold comps map…
Walkable amenities ~0.75 mi
Loading nearby amenities…
Taxation est. · year 1
- Rental income
- $35,159
- − Mortgage interest
- −$22,350
- − Property taxes
- −$5,985
- − Insurance
- −$1,995
- − Repairs & maintenance
- −$2,813
- − Management
- −$2,813
- − Depreciation
- −$11,607
- Taxable loss
- −$12,404
- Est. tax savings @ 24.0%
- +$2,977
- After-tax cash flow
- $-2,336/yr
For passive investors: Depreciation is non-cash, so a rental often shows a tax loss while cash-flowing — sheltering income. Rental losses are passive: they offset passive income freely, and up to $25,000/yr can offset ordinary (W-2) income if you actively participate and your MAGI is under $100k (phasing out to $0 by $150k); unused losses carry forward. On sale, claimed depreciation is recaptured at up to 25%, and gains may owe capital-gains tax (a 1031 exchange can defer both). Figures are a year-1 estimate at your 24.0% rate — not tax advice; consult a CPA.
Condition & rehab AI · 12 photos
This single-family home in Dallas is in excellent condition with modern finishes and a prime location. It's move-in ready and offers high ROI potential for both resale and rental.
Value-add opportunities
- Both Painting the exterior and interior walls — Fresh paint can enhance curb appeal and interior aesthetics.
- Both Adding smart home features — Smart home features can increase both resale and rental value.
- Resale Upgrading the kitchen appliances — Modern, high-end appliances can attract more buyers.
- Rental Installing a smart thermostat — Smart thermostats can help reduce energy costs and attract eco-conscious renters.
Renovation cost estimate screening
Value-add ROI direction
- Both Painting the exterior and interior walls — Fresh paint can enhance curb appeal and interior aesthetics. ↑
- Both Adding smart home features — Smart home features can increase both resale and rental value. ↑
- Resale Upgrading the kitchen appliances — Modern, high-end appliances can attract more buyers. ↑
- Rental Installing a smart thermostat — Smart thermostats can help reduce energy costs and attract eco-conscious renters. ↑
ⓘ Cost ranges are severity-bucket heuristics (US national rule-of-thumb). Get contractor quotes + a written scope before underwriting a rehab budget.
Schools (NCES district)
- District
- Dallas ISD
- NCES district ID
- 4816230
- Math proficiency
- 31% ▼ -16.00%
- Reading proficiency
- 36% ▼ -4.00%
- Median HH income
- $42,881
- Composite
- 28.41/100
- National rank
- #6763
- State rank
- #559 of 826 in TX
Livability — Dallas
- Score
- 81/100
- State rank
- #24
- US rank
- #1380
Category grades
Schools grade is shown separately in the Schools card above.
Census & demographics
- Census place
- Dallas, TX
- County
- Dallas County · 2,612,404 people
- City population
- 1,168,437
- Metro
- Dallas-Fort Worth-Arlington, TX
- Population (ZIP)
- 18,895
- Household income
- $45,557
- Rent vs Own
- Severe rent burden
- 1464.0
Population outlook (Dallas County) Hauer SSP2
- Today (2025)
- 2,979,839 people
- By 2030
- 3,191,823 · +7.1%
- By 2040
- 3,619,611 · +21.5%
- By 2050
- 4,026,915 · +35.1%
- By 2075
- 4,957,073 · +66.4%
- By 2100
- 5,508,725 · +84.9%
Race, ethnicity, and origin ACS 2023
- Neighborhood character
- Diverse neighborhood (Simpson 0.58)
- Race & ethnicity
- Black 59% Hispanic / Latino 25% White 11% Two or more races 10%
- Hispanic origin (detail)
- Mexican 21%
- Common ancestry
- Italian 1% Hispanic 1%
- Foreign-born
- 16% · Canada
- Languages at home
- 74% English-only · Spanish 26%
Political lean MEDSL · Dallas
- 2024 margin
- Strong D (+22.2) · D 60.2% · R 38.0% · Other 1.8%
- 2008→2024 swing
- +6.9pp toward D · 2008: 15.3pp · 2024: 22.2pp
- All cycles
- 2024: D+22.2 2020: D+31.6 2016: D+26.2 2012: D+15.4 2008: D+15.3
Not yet ingested
- Civics
- —
Market trends
- HPI YoY
- ▲ 0.79%
- Current HPI
- 224.2955
- Rent YoY
- ▲ 7.19%
- Metro
- Dallas-Fort Worth-Arlington, TX
- State GDP YoY
- ▲ 3.95%
- F500 in state
- 110
Industry mix (Fortune 500 HQ in TX)
| Industry | F500 HQs | Revenue |
|---|---|---|
| Energy | 16 | $1,198B |
|
||
| Technology | 5 | $198B |
|
||
| Engineering / Construction | 4 | $72B |
|
||
| Energy Services | 3 | $60B |
|
||
| Utilities | 3 | $41B |
|
||
| Healthcare | 2 | $330B |
|
||
Price history
2 events — show timeline
- 2026-05-09 Pending — NTREIS
- 2026-05-07 Listed $399,000 NTREIS
Cash-flow waterfall
monthlySold comps — $/sqft
last 12 mo · ≤1 miLoading sold comps…