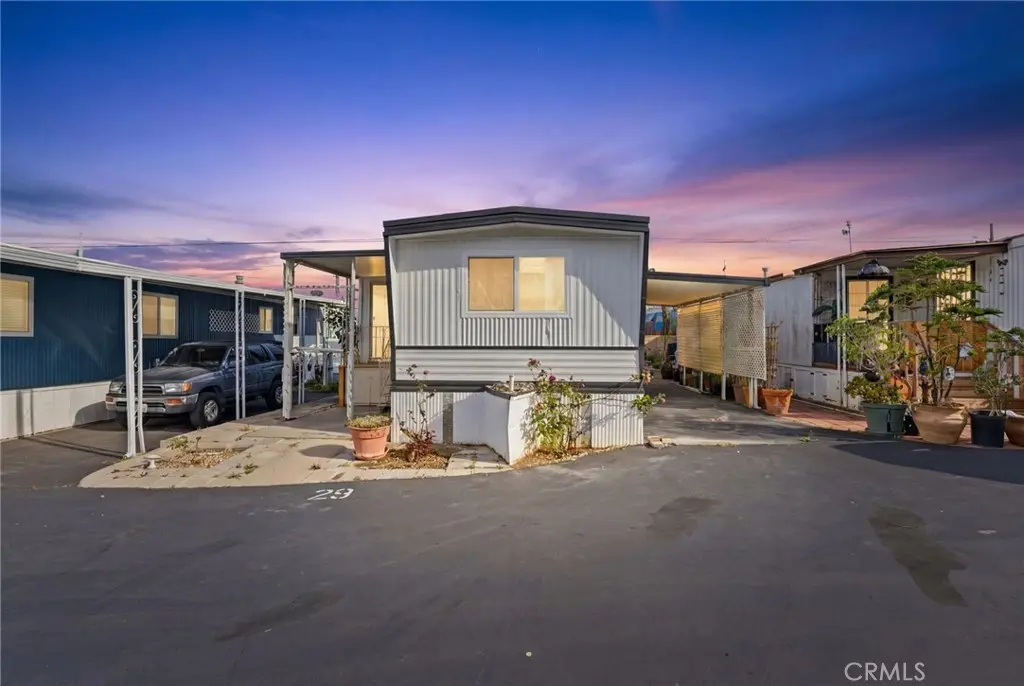
1660 Whittier Ave Spc 29 #29 · Costa Mesa, CA
Flood risk 1/10 · Minimal
- FEMA flood zone
- X (unshaded)
- Chance of flooding over 30 yrs
- 0.0%
- Est. flood insurance / yr
- $507 – $1,088
Fire risk 1/10 · Minimal
- Est. fire insurance / yr
- $659 – $1,223
Heat risk 5/10 · Moderate
- Hot days now (above 82°F)
- 6 days/yr
- Hot days in 30 yrs
- 17 days/yr
Wind risk 1/10 · Minimal
- Chance of severe wind over 30 yrs
- —
Air-quality risk 4/10 · Minor
- Unhealthy air days now
- 6 days/yr
- Unhealthy air days in 30 yrs
- 6 days/yr
Risk factors via First Street. Map © Google.
Why this score? — see what drove the B grade
The composite is a weighted blend of 9 inputs, each scored 0–100. Each bar is that input's sub-score; the figure is the points it added to the 100-point composite (weight × sub-score).
- Cash flow +30.0/30.0
- DSCR +10.0/10.0
- 1% rule +9.3/10.0
- ARV discount +7.5/15.0
- Schools +4.8/10.0
- Livability +3.1/5.0
- Rent growth +2.9/5.0
- Condition / age +2.5/5.0
- Appreciation +0.0/10.0
$210,000
🖨 Deal sheet (PDF) 📄 Offer letter ✓ Due diligence
Listing remarks MLS
Fully remodeled, turnkey coastal home with beautiful ocean views! Located in the highly desirable 55+ Island View Mobile Home Park, this 2-bedroom, 1-bath home offers approximately 720 sq. ft. of move-in ready living space. The home has been completely renovated from top to bottom, with upgrades including a new roof, updated plumbing, new windows, new flooring, new cabinetry, and updated appliances. The bright, modern kitchen features new cabinets, countertops, and appliances, creating a stylish and functional space for everyday living. The bathroom has been fully remodeled with elegant finishes and a new vanity. Additional highlights include a dedicated laundry room for added convenience. Ocean views are visible from the living area and outdoor spaces, while the home is conveniently located just minutes from the beach, shopping, dining, and local amenities. This beautifully updated home is turnkey and ready for its next owner, offering a wonderful opportunity to enjoy affordable coastal living in a welcoming 55+ community.
Key facts
- New flooring
- Ocean views
- New cabinetry
Tags
Neighborhood map
What this means for you Summary
Snapshot
- This is a 2-bed/1.0-bath manufactured listed at $210k.
Deal economics
- At list price, monthly cash flow is $918 ($11k/yr) — positive.
- The deal already cash-flows at list — no discount required.
- Meets the 1% rule at list price ($3k rent vs $210k).
- Recommended offer: $191k (9.0% below list) — sets the bar for market timing.
- Cap rate 11.5% vs local median 1.8% in Costa Mesa — top-decile yield for the area; either an underpriced asset or a hidden risk that comps aren't pricing in. Stress-test before assuming the spread holds.
Location & tenants
- Location reads 61/100 on livability (#558 in CA) — a middle-class / working-renter tenant base. Strengths: employment A+, amenities B; Watch: schools C-, health & safety D+, crime F.
- Newport-Mesa Unified (urban): math 46% / reading 58% proficiency, ranked #106 of 517 in CA (top 20%) — acceptable for families but not a draw, mixed tenant base, ~2y average lease.
- Market conditions: Rents rising (+1.7%/yr); 100 active listings in the ZIP; 32 comparable units currently listed for rent nearby; rentals at typical pace (median 16d on market — plan ~3-4 weeks tenant-placement turnaround); solid renter incomes; 6,974 units permitted in Orange County in 2024 (3,839 in 5+ unit buildings).
- This rent runs 33% of the median local income ($109k/yr) — at the standard rent-burdened threshold; future hikes will face affordability resistance.
Forward outlook
- Local home prices are declining (-3.0%/yr); year-one equity from $1k of loan paydown is wiped out by about $6k of value loss. Plan a longer hold.
- Orange County population projected at +14% by 2050 — modest demand growth; plan on rents tracking national, not racing it.
- At projected returns (-3.0% appreciation + 1.7% rent growth), your $59k cash investment doubles in ~8 years — after that, you're playing with house money.
Negotiation context
- It's been on market 94 days — a 9% lower offer ($191k) is reasonable based on typical stale-listing flexibility.
- 3 sale attempts since 12y ago; this cycle's ask has dropped $15k (7%) from the opening price — seller is motivated, your offer sets the floor, not the list.
- Current owner paid $25k; list at $210k implies a 740% gain — meaningful room to come down on a strong offer.
Risks & watch-outs
- Climate carrying-cost: extreme-heat days projected 6→17/yr by 2055 (HVAC capex compounding) — expect insurance premiums to compound above CPI over the hold.
Questions for the listing agent
- It's been on market 94 days. Have you received any prior offers? Is the seller open to a 9% concession, seller financing, or rate buy-down credit?
- Built in 1969 — when were the roof, HVAC, electrical panel, plumbing, and water heater last replaced?
- Why hasn't it sold? Are there any deal-killer items the seller is aware of (foundation, flood, title, zoning, code violations)?
- Is there a deadline driving the sale (1031 exchange, divorce, estate, relocation)? That informs how much negotiation room exists.
- Crime grade is F in this area — have there been break-ins, vandalism, or insurance claims at this property in the last 3 years? What carrier currently insures it and at what premium?
- What's the average days-on-market for RENTAL listings here right now (not sales)? A rising rental-DOM trend means longer vacancies and softer asking-rent achievability than the comps imply.
- What's the recent tenant-quality profile in this submarket — average credit score on applications, eviction rate, late-payment / NSF rate, and stable-employment percentage? A property-management company in the area should have these aggregated.
- How much new for-sale + rental construction is in the pipeline within 1–3 miles? Heavy new supply typically softens prices + rents 12–24 months out; constrained supply supports both.
Investment metrics
- 1% rule
- 1.43% ✓
- Cap rate
- 11.54%
- Cash-on-cash
- 18.74%
- DSCR
- 1.83
- GRM
- 5.8
CMA / ARV
- ARV (median comp)
- $113,241
- List price
- $210,000
- Delta
- 85.45%
- Verdict
- OVERPRICED
- Comps
- 3 within 1.0 mi
Show comp detail 5 sales within ~0.75 mi
| Address | Dist | Beds/Ba | Sqft | Sold | Price | $/sf | Match |
|---|---|---|---|---|---|---|---|
| 1660 Whittier Ave #30 | 0.00mi | 2/1.0 | 696 (-3%) | 11mo | $168,000 | $241 | 85 |
| 1750 Whittier Ave #27 | 0.19mi | 2/1.0 | 800 (+11%) | 2mo | $80,000 | $100 | 71 |
| 1660 Whittier Ave. #35 #35 | 0.00mi | 2/1.0 | 800 (+11%) | 18mo | $129,000 | $161 | 67 |
| 1535 Superior Ave #33 | 0.63mi | 2/2.0 | 720 (0%) | 11mo | $115,000 | $160 | 57 |
| 1660 Whittier Ave #27 | 0.01mi | 1/1.0 (-1) | 624 (-13%) | 23mo | $145,000 | $232 | 53 |
Match score weights: distance 35% · size 25% · config 20% · recency 20%. Top-matched comps best support the ARV.
Projected returns pro-forma
-3.0% appreciation · 1.71% rent growth · sell at horizon
- IRR
- 9.1%
- Equity multiple
- 1.35×
- Total profit
- $20,659
- Equity at exit
- $31,312
- IRR
- 17.2%
- Equity multiple
- 2.33×
- Total profit
- $78,116
- Equity at exit
- $18,157
Cash invested: $58,800 (down + closing). Projections, not guarantees.
Landlord ↔ Tenant lean methodology
- Overall (STATE)
- 18 Strongly Tenant-Friendly
- State California
- 18 Strongly Tenant-Friendly · D+13
- County
- — inherits STATE
- City
- — inherits STATE
ZIP-level market 92627
- Rents YoY
- 1.7%
- Active inventory
- 100
- Price-to-rent
- 5.8×
Monthly cashflow live
- Estimated rent
- $2,999 high interval (Pro) →
- Mortgage (P&I)
- −$1,101
- Tax est. 1.5%
- −$262 /mo · $3,150/yr
- Insurance
- −$88
- HOA
- −$0
- Vacancy / Maint / Mgmt
- −$630
- Net cashflow
- $918
Break-even live
Sensitivity live
| Price | -10% $1,063 | -5% $991 | +0% $918 | +5% $846 | +10% $773 |
|---|---|---|---|---|---|
| Rent | -10% $681 | -5% $800 | +0% $918 | +5% $1,037 | +10% $1,155 |
| Rate | -1.0pp $1,024 | -0.5pp $972 | base $918 | +0.5pp $864 | +1.0pp $809 |
UW: 25.0% down · 7.5% · 30yr · 1.5% tax · 5.0% vac · 8.0% maint · 8.0% mgmt
Financing live
Cash to close
- Down payment
- $52,500
- Closing costs
- $6,300
- Reserves months
- —
- Total cash needed
- —
Loan-product check · same deal, 3 products live
Conventional
25% down · 7.5% · 30yr
- Down + closing
- —
- Monthly P&I
- —
- Monthly cashflow
- —
- DSCR
- —
- Eligible?
- —
Personal DTI + credit; lowest rate.
DSCR
20% down · 8.5% · 30yr
- Down + closing
- —
- Monthly P&I
- —
- Monthly cashflow
- —
- DSCR
- —
- Eligible?
- —
No personal income docs; deal must DSCR.
Hard money
10% down · 12.0% · 12mo
- Down + closing
- —
- Monthly P&I
- —
- Monthly cashflow
- —
- DSCR
- —
- Eligible?
- —
Short-term bridge; refi at stabilization.
Rent comps 32 comps
| Address | Beds | Baths | Sqft | Rent | $/sqft | DOM | Units | Dist |
|---|---|---|---|---|---|---|---|---|
| 1819 Monrovia Ave Costa Mesa, CA | 1.0–2.0 | 1.0 | 821 | $2,805 | $3.42 | 5d | 1 | 0.40mi |
| 1850 Whittier Ave Costa Mesa, CA | 1.0–2.0 | 1.0–2.0 | 775 | $3,657 | $4.72 | 0d | 7 | 0.49mi |
| 1525 Placentia Ave Newport Beach, CA | 2.0 | 1.0–1.5 | 635 | $3,200 | $5.04 | 6d | 3 | 0.53mi |
| 1530 Placentia Ave Newport Beach, CA | 2.0 | 1.0 | 715 | $2,995 | $4.19 | 25d | 1 | 0.60mi |
| 825 Center St Costa Mesa, CA | 1.0–2.0 | 1.0–2.0 | 925 | $3,200 | $3.46 | 0d | 1 | 0.61mi |
| 1433 Superior Ave Newport Beach, CA | 1.0 | 1.0 | 600 | $2,845 | $4.74 | 44d | 3 | 0.64mi |
| 1846 Placentia Ave Apt D Costa Mesa, CA | 1.0 | 1.0 | 625 | $2,595 | $4.15 | 44d | 1 | 0.65mi |
| 724 W 18th St Unit 3 Costa Mesa, CA | 1.0 | 1.0 | 650 | $1,850 | $2.85 | 44d | 1 | 0.73mi |
| 102 Scholz Plz Newport Beach, CA | 1.0 | 1.0 | 726 | $3,045 | $4.19 | 3d | 1 | 0.79mi |
| 102 Scholz Plz Newport Beach, CA | 1.0 | 1.0 | 726 | $3,200 | $4.41 | 44d | 1 | 0.79mi |
| 1975 Pomona Ave Costa Mesa, CA | 1.0 | 1.0 | 650 | $1,995 | $3.07 | 15d | 1 | 1.02mi |
| 1612 Orange Ave Costa Mesa, CA | 2.0 | 1.0 | 738 | $3,795 | $5.14 | 25d | 1 | 1.11mi |
| 1614 Orange Ave Costa Mesa, CA | 2.0 | 1.0 | 738 | $3,795 | $5.14 | 25d | 1 | 1.11mi |
| 2115 Placentia Ave Costa Mesa, CA | 1.0–2.0 | 1.0–2.0 | 725 | $2,595 | $3.58 | 3d | 4 | 1.19mi |
| 626 Clubhouse Ave Unit 626 Clubhouse D Newport Beach, CA | 2.0 | 1.0 | 700 | $4,750 | $6.79 | 16d | 1 | 1.20mi |
| 1919 Maple Ave Unit 1917-14 Costa Mesa, CA | 1.0 | 1.0 | 440 | $1,975 | $4.49 | 12d | 1 | 1.20mi |
| 1919 Maple Ave Unit 1917-06 Costa Mesa, CA | 1.0 | 1.0 | 440 | $1,975 | $4.49 | 25d | 1 | 1.21mi |
| 790 Hamilton St Costa Mesa, CA | 1.0 | 1.0 | 555 | $2,300 | $4.14 | 23d | 1 | 1.21mi |
| 140 Cabrillo St Costa Mesa, CA | 1.0 | 1.0 | 337 | $1,795 | $5.32 | 18d | 2 | 1.21mi |
| 1999 Maple Ave Unit 202 Costa Mesa, CA | 2.0 | 1.0 | 704 | $2,575 | $3.66 | 8d | 1 | 1.31mi |
| 187 E 18th St Costa Mesa, CA | 1.0 | 1.0 | 725 | $2,400 | $3.31 | 20d | 1 | 1.37mi |
| 187 E 18th St Costa Mesa, CA | 1.0 | 1.0 | 600 | $2,400 | $4.00 | 25d | 1 | 1.37mi |
| 307 33rd St Unit B Newport Beach, CA | 1.0 | 1.0 | 700 | $3,300 | $4.71 | 16d | 1 | 1.38mi |
| 2244 Canyon Dr Unit 2244 D Costa Mesa, CA | 2.0 | 1.0 | 740 | $2,750 | $3.72 | 23d | 1 | 1.41mi |
| 673 Victoria St Costa Mesa, CA | 2.0 | 1.0 | 700 | $3,000 | $4.29 | 18d | 1 | 1.41mi |
| 2250 Canyon Dr Costa Mesa, CA | 2.0 | 1.0 | 740 | $2,750 | $3.72 | 16d | 1 | 1.43mi |
| 21372 Brookhurst St Huntington Beach, CA | 1.0–3.0 | 1.0–2.0 | 743 | $2,650 | $3.56 | 0d | 6 | 1.45mi |
| 21372 Brookhurst St Unit O Huntington Beach, CA | 1.0 | 1.0 | 560 | $2,099 | $3.75 | 4d | 1 | 1.45mi |
| 2029 Harbor Blvd Unit 7 Costa Mesa, CA | 2.0 | 1.0 | 616 | $2,850 | $4.63 | 8d | 1 | 1.48mi |
| 1765 Santa Ana Ave Costa Mesa, CA | 3.0 | 1.0–2.0 | 760 | $3,893 | $5.12 | 0d | 1 | 1.48mi |
| 313 W 17th St Costa Mesa, CA | 1.0–2.0 | 1.0 | 750 | $4,225 | $5.63 | 7d | 7 | 1.49mi |
| 2029 Harbor Blvd Unit 8 Costa Mesa, CA | 2.0 | 1.0 | 638 | $2,750 | $4.31 | 25d | 1 | 1.50mi |
Listing history 24 events
-
2026-06-21days on market $210,000 Active 94 DOM
-
2026-06-18days on market $210,000 Active 91 DOM
-
2026-06-17days on market $210,000 Active 90 DOM
-
2026-06-16days on market $210,000 Active 89 DOM
-
2026-06-15days on market $210,000 Active 88 DOM
-
2026-06-13days on market $210,000 Active 86 DOM
-
2026-06-13days on market $210,000 Active 85 DOM
-
2026-06-09days on market $210,000 Active 82 DOM
-
2026-06-08days on market $210,000 Active 81 DOM
-
2026-06-07pricedays on market $210,000 Active 80 DOM
-
2026-06-04days on market $220,000 Active 77 DOM
-
2026-06-03days on market $220,000 Active 76 DOM
-
2026-06-02days on market $220,000 Active 75 DOM
-
2026-06-01days on market $220,000 Active 74 DOM
-
2026-05-31days on market $220,000 Active 73 DOM
-
2026-05-14price $220,000 1039-char remark
Show marketing remark (1039 chars)
Fully remodeled, turnkey coastal home with beautiful ocean views! Located in the highly desirable 55+ Island View Mobile Home Park, this 2-bedroom, 1-bath home offers approximately 720 sq. ft. of move-in ready living space. The home has been completely renovated from top to bottom, with upgrades including a new roof, updated plumbing, new windows, new flooring, new cabinetry, and updated appliances. The bright, modern kitchen features new cabinets, countertops, and appliances, creating a stylish and functional space for everyday living. The bathroom has been fully remodeled with elegant finishes and a new vanity. Additional highlights include a dedicated laundry room for added convenience. Ocean views are visible from the living area and outdoor spaces, while the home is conveniently located just minutes from the beach, shopping, dining, and local amenities. This beautifully updated home is turnkey and ready for its next owner, offering a wonderful opportunity to enjoy affordable coastal living in a welcoming 55+ community.
-
2026-03-19$225,000 Active 1039-char remark
Show marketing remark (1039 chars)
Fully remodeled, turnkey coastal home with beautiful ocean views! Located in the highly desirable 55+ Island View Mobile Home Park, this 2-bedroom, 1-bath home offers approximately 720 sq. ft. of move-in ready living space. The home has been completely renovated from top to bottom, with upgrades including a new roof, updated plumbing, new windows, new flooring, new cabinetry, and updated appliances. The bright, modern kitchen features new cabinets, countertops, and appliances, creating a stylish and functional space for everyday living. The bathroom has been fully remodeled with elegant finishes and a new vanity. Additional highlights include a dedicated laundry room for added convenience. Ocean views are visible from the living area and outdoor spaces, while the home is conveniently located just minutes from the beach, shopping, dining, and local amenities. This beautifully updated home is turnkey and ready for its next owner, offering a wonderful opportunity to enjoy affordable coastal living in a welcoming 55+ community.
-
2026-03-16historical
-
2026-03-05$225,000 Active
-
2026-03-05historical
-
2015-03-20soldstatus $25,000 Closed Sale
-
2015-03-10historical Active Under Contract
-
2015-02-16price $34,700
-
2014-12-04$28,500 Active
ⓘ Source: listings_history table (triggers on properties + properties_extension) + one-shot
backfill from property_details.listing_events for pre-trigger history.
Climate risk First Street
- Flood 1/10 Low FEMA zone X (unshaded) · 0% chance over 30 yrs
- Wildfire 1/10 Low
- Heat 5/10 Major 6 d/yr ≥82°F today · 17 d/yr by 30 yrs out
- Wind 1/10 Low
- Air quality 4/10 Moderate 6 unhealthy d/yr today · 6 by 30 yrs out
Nearby sold comps map
Loading sold comps map…
Walkable amenities ~0.75 mi
Loading nearby amenities…
Taxation est. · year 1
- Rental income
- $35,993
- − Mortgage interest
- −$11,763
- − Property taxes
- −$3,150
- − Insurance
- −$1,050
- − Repairs & maintenance
- −$2,879
- − Management
- −$2,879
- − Depreciation
- −$6,109
- Taxable income
- $8,162
- Est. tax owed @ 24.0%
- −$1,959
- After-tax cash flow
- $9,061/yr
For passive investors: Depreciation is non-cash, so a rental often shows a tax loss while cash-flowing — sheltering income. Rental losses are passive: they offset passive income freely, and up to $25,000/yr can offset ordinary (W-2) income if you actively participate and your MAGI is under $100k (phasing out to $0 by $150k); unused losses carry forward. On sale, claimed depreciation is recaptured at up to 25%, and gains may owe capital-gains tax (a 1031 exchange can defer both). Figures are a year-1 estimate at your 24.0% rate — not tax advice; consult a CPA.
Schools (NCES district)
- District
- Newport-Mesa Unified
- NCES district ID
- 0627240
- Math proficiency
- 46% ▼ -6.00%
- Reading proficiency
- 58% ▼ -5.00%
- Median HH income
- $83,922
- Composite
- 47.64/100
- National rank
- #2248
- State rank
- #106 of 517 in CA
Livability — Costa Mesa
- Score
- 61/100
- State rank
- #558
- US rank
- #18441
Category grades
Schools grade is shown separately in the Schools card above.
Census & demographics
- Census place
- Costa Mesa, CA
- County
- Orange County · 3,096,323 people
- City population
- 111,101
- Metro
- Los Angeles-Long Beach-Anaheim, CA
- Population (ZIP)
- 60,393
- Household income
- $108,994
- Rent vs Own
- Severe rent burden
- 2889.0
Population outlook (Orange County) Hauer SSP2
- Today (2025)
- 3,477,456 people
- By 2030
- 3,613,117 · +3.9%
- By 2040
- 3,835,945 · +10.3%
- By 2050
- 3,968,736 · +14.1%
- By 2075
- 4,097,053 · +17.8%
- By 2100
- 3,903,633 · +12.3%
Race, ethnicity, and origin ACS 2023
- Neighborhood character
- Diverse neighborhood (Simpson 0.60)
- Race & ethnicity
- White 48% Hispanic / Latino 41% Two or more races 18% Asian 4% Native American 1%
- Hispanic origin (detail)
- Mexican 32%
- Common ancestry
- Italian 4% Slovak 2% Romanian 2%
- Foreign-born
- 22% · Canada, Vietnam, Jamaica
- Languages at home
- 62% English-only · Spanish 32% Other Indo-European 1% Other Asian/Pacific 1%
Political lean MEDSL · Orange
- 2024 margin
- Toss-up / Even · D 49.7% · R 47.1% · Other 3.2%
- 2008→2024 swing
- +5.2pp toward D · 2008: -2.6pp · 2024: 2.6pp
- All cycles
- 2024: D+2.6 2020: D+9.0 2016: D+7.7 2012: R+8.3 2008: R+2.6
Not yet ingested
- Civics
- —
Market trends
- HPI YoY
- ▼ -1520.53%
- Current HPI
- 455.1299
- Rent YoY
- ▲ 1.71%
- Metro
- Los Angeles-Long Beach-Anaheim, CA
- State GDP YoY
- ▲ 3.21%
- F500 in state
- 116
Industry mix (Fortune 500 HQ in CA)
| Industry | F500 HQs | Revenue |
|---|---|---|
| Technology | 27 | $1,492B |
|
||
| Financial Services | 3 | $174B |
|
||
| Retail | 3 | $44B |
|
||
| Insurance | 3 | $26B |
|
||
| Media / Entertainment | 2 | $115B |
|
||
| Pharmaceuticals / Biotech | 2 | $62B |
|
||
Price history
+671.9% since first listed9 events — show timeline
- 2026-05-14 Price Changed $220,000 CRMLS
- 2026-03-19 Listed $225,000 CRMLS
- 2026-03-16 Listing Removed — CRMLS
- 2026-03-05 Listed $225,000 CRMLS
- 2026-03-05 Coming Soon — CRMLS
- 2015-03-20 Sold (MLS) $25,000 CRMLS
- 2015-03-10 Contingent — CRMLS
- 2015-02-16 Price Changed $34,700 CRMLS
- 2014-12-04 Listed $28,500 CRMLS
Property tax history
-0.1%/yrLatest (2025): $48 · -0.5% YoY. Source: county tax records.
Cash-flow waterfall
monthlySold comps — $/sqft
last 12 mo · ≤1 miLoading sold comps…