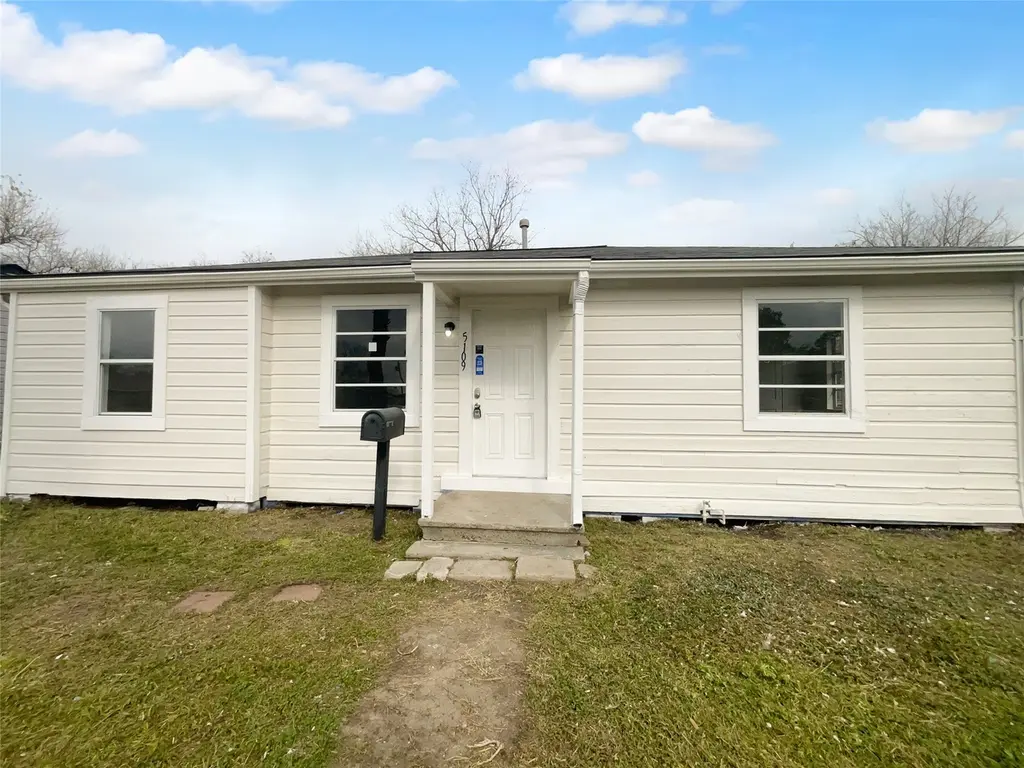
5109 Wilmington St · Houston, TX
Flood risk 1/10 · Minimal
- FEMA flood zone
- X (unshaded)
- Chance of flooding over 30 yrs
- 0.0%
- Est. flood insurance / yr
- $507 – $1,088
Fire risk 1/10 · Minimal
- Est. fire insurance / yr
- $1,222 – $2,270
Heat risk 9/10 · Severe
- Hot days now (above 109°F)
- 7 days/yr
- Hot days in 30 yrs
- 24 days/yr
Wind risk 9/10 · Severe
- Chance of severe wind over 30 yrs
- 99.0%
Air-quality risk 2/10 · Minimal
- Unhealthy air days now
- 2 days/yr
- Unhealthy air days in 30 yrs
- 2 days/yr
Risk factors via First Street. Map © Google.
Why this score? — see what drove the C- grade
The composite is a weighted blend of 9 inputs, each scored 0–100. Each bar is that input's sub-score; the figure is the points it added to the 100-point composite (weight × sub-score).
- Cash flow +20.4/30.0
- DSCR +6.5/10.0
- ARV discount +6.2/15.0
- 1% rule +5.9/10.0
- Rent growth +3.9/5.0
- Livability +3.7/5.0
- Schools +2.7/10.0
- Condition / age +2.5/5.0
- Appreciation +0.0/10.0
$177,000
🖨 Deal sheet (PDF) 📄 Offer letter ✓ Due diligence
Listing remarks MLS
Welcome to 5109 Wilmington St, a beautifully updated home that is sure to impress. The kitchen is a chef's dream, boasting an accent backsplash for a sleek, modern look. The fenced-in backyard provides a oasis for outdoor enjoyment. The interior of the home is freshly painted, providing a clean and bright living space. The exterior has also been freshly painted, enhancing the home's curb appeal. New flooring throughout the home adds a touch of elegance and ensures durability. This home is a perfect blend of style and comfort, making it a must-see property. Included 100-Day Home Warranty with buyer activation.
Key facts
- New flooring
- Fenced-in backyard
- Accent backsplash
Tags
Neighborhood map
What this means for you Summary
Snapshot
- This is a 2-bed/1.5-bath single-family listed at $177k.
Deal economics
- At list price, monthly cash flow is $232 ($3k/yr) — positive.
- The deal already cash-flows at list — no discount required.
- Meets the 1% rule at list price ($2k rent vs $177k).
- Recommended offer: $161k (9.0% below list) — sets the bar for market timing.
- Cap rate 7.9% vs local median 3.1% in Houston — top-decile yield for the area; either an underpriced asset or a hidden risk that comps aren't pricing in. Stress-test before assuming the spread holds.
Location & tenants
- Location reads 74/100 on livability (#184 in TX, #4,771 nationally) — a middle-class / working-renter tenant base. Strengths: amenities A+, cost of living A+, housing A+; Watch: crime F.
- Houston ISD (urban): math 27% / reading 35% proficiency, ranked #593 of 826 in TX (top 72%) — families likely to look elsewhere, expect single-tenant / working-renter base with shorter leases; 71% free/reduced lunch — lower-income household profile, screen leases tightly.
- Zoned schools: Woodson School (math 17% / reading 22%, grade F, #3,583 of 4,322 statewide, top 86%, 572 students, 99% FRL); Thomas Middle (math 3% / reading 13%, grade F, #1,654 of 1,662 statewide, top 100%, 526 students, 98% FRL); Sterling H S (math 16% / reading 27%, grade F, #1,377 of 1,632 statewide, top 85%, 1,421 students, 92% FRL) — zoned schools average 96% FRL vs 71% district-wide (25 pts higher); higher-poverty schools than district average — tighter screening recommended.
- Zoned-school proficiency averages 16% at this address vs 31% district-wide (-15 pts) — the specific schools serving this property underperform the Houston ISD average; the district grade overstates school quality for this exact location.
- Market conditions: Rents rising fast (+5.5%/yr); 345 active listings in the ZIP; 25 comparable units currently listed for rent nearby; rentals at typical pace (median 23d on market — plan ~3-4 weeks tenant-placement turnaround); lower-income renter base — watch delinquency; 29,883 units permitted in Harris County in 2024 (8,621 in 5+ unit buildings).
Forward outlook
- Local home prices are declining (-3.0%/yr); year-one equity from $1k of loan paydown is wiped out by about $5k of value loss. Plan a longer hold.
- Harris County population projected at +47% by 2050 — long-run rental-demand tailwind backs the buy-and-hold thesis.
Negotiation context
- It's been on market 104 days — a 9% lower offer ($161k) is reasonable based on typical stale-listing flexibility.
- 7 sale attempts since 16y ago; this cycle's ask is 13149% above the opening price — seller raised mid-cycle; expect resistance to lowballs.
- Current owner paid $14k; list at $177k implies a 1164% gain — meaningful room to come down on a strong offer.
Risks & watch-outs
- Watch-outs: built in 1950 — expect roof / HVAC / electrical / plumbing capex.
- Climate carrying-cost: severe wind risk, 99% chance of damaging wind over 30y; extreme-heat days projected 7→24/yr by 2055 (HVAC capex compounding) — expect insurance premiums to compound above CPI over the hold.
Questions for the listing agent
- It's been on market 104 days. Have you received any prior offers? Is the seller open to a 9% concession, seller financing, or rate buy-down credit?
- Built in 1950 — when were the roof, HVAC, electrical panel, plumbing, and water heater last replaced?
- Why hasn't it sold? Are there any deal-killer items the seller is aware of (foundation, flood, title, zoning, code violations)?
- Is there a deadline driving the sale (1031 exchange, divorce, estate, relocation)? That informs how much negotiation room exists.
- Schools are D-rated, which usually means shorter tenancies and higher turnover. Who's the typical renter profile here, and what's been the actual vacancy rate?
- Crime grade is F in this area — have there been break-ins, vandalism, or insurance claims at this property in the last 3 years? What carrier currently insures it and at what premium?
- What's the average days-on-market for RENTAL listings here right now (not sales)? A rising rental-DOM trend means longer vacancies and softer asking-rent achievability than the comps imply.
- What's the recent tenant-quality profile in this submarket — average credit score on applications, eviction rate, late-payment / NSF rate, and stable-employment percentage? A property-management company in the area should have these aggregated.
- How much new for-sale + rental construction is in the pipeline within 1–3 miles? Heavy new supply typically softens prices + rents 12–24 months out; constrained supply supports both.
Investment metrics
- 1% rule
- 1.09% ✓
- Cap rate
- 7.86%
- Cash-on-cash
- 5.61%
- DSCR
- 1.25
- GRM
- 7.6
CMA / ARV
- ARV (median comp)
- $171,857
- List price
- $177,000
- Delta
- 2.99%
- Verdict
- FAIR
- Comps
- 20 within 1.0 mi
Show comp detail 12 sales within ~0.75 mi
| Address | Dist | Beds/Ba | Sqft | Sold | Price | $/sf | Match |
|---|---|---|---|---|---|---|---|
| 4918 Carmen St | 0.25mi | 3/2.0 (+1) | 1,258 (-1%) | 1mo | $213,000 | $169 | 78 |
| 5234 Wilmington St | 0.22mi | 3/1.0 (+1) | 1,230 (-4%) | 1mo | $76,500 | $62 | 76 |
| 4817 Wenda St | 0.39mi | 3/1.0 (+1) | 1,310 (+3%) | 1mo | $85,000 | $65 | 70 |
| 5217 Pederson St | 0.22mi | 3/2.0 (+1) | 1,158 (-9%) | 7mo | $179,000 | $155 | 62 |
| 5602 Beldart St | 0.52mi | 3/1.5 (+1) | 1,173 (-8%) | 3mo | $160,000 | $136 | 55 |
| 4813 Larkspur St | 0.55mi | 3/2.0 (+1) | 1,224 (-4%) | 7mo | $175,000 | $143 | 54 |
| 4821 Alvin St | 0.69mi | 3/2.0 (+1) | 1,307 (+2%) | 4mo | $174,000 | $133 | 53 |
| 4826 Airport Blvd | 0.71mi | 3/1.0 (+1) | 1,260 (-1%) | 6mo | $164,900 | $131 | 52 |
| 9211 Vinearbor St | 0.63mi | 3/1.0 (+1) | 1,192 (-6%) | 1mo | $179,900 | $151 | 52 |
| 9413 Arden Ct | 0.46mi | 3/1.0 (+1) | 1,440 (+13%) | 1mo | $214,900 | $149 | 49 |
| 5503 Ricky St | 0.51mi | 3/1.0 (+1) | 1,102 (-14%) | 5mo | $110,000 | $100 | 43 |
| 4637 Carmen St | 0.65mi | 2/1.0 | 1,084 (-15%) | 2mo | $135,000 | $125 | 41 |
Match score weights: distance 35% · size 25% · config 20% · recency 20%. Top-matched comps best support the ARV.
Projected returns pro-forma
-3.0% appreciation · 5.45% rent growth · sell at horizon
- IRR
- -4.7%
- Equity multiple
- 0.82×
- Total profit
- $-8,974
- Equity at exit
- $26,391
- IRR
- 7.8%
- Equity multiple
- 1.66×
- Total profit
- $32,551
- Equity at exit
- $15,304
Cash invested: $49,560 (down + closing). Projections, not guarantees.
Landlord ↔ Tenant lean methodology
- Overall (STATE)
- 87 Strongly Landlord-Friendly
- State Texas
- 87 Strongly Landlord-Friendly · R+5
- County
- — inherits STATE
- City
- — inherits STATE
ZIP-level market 77033
- Home prices YoY
- -16.3%
- Rents YoY
- 5.5%
- Active inventory
- 345
- Price-to-rent
- 7.6×
Monthly cashflow live
- Estimated rent
- $1,934 high interval (Pro) →
- Mortgage (P&I)
- −$928
- Tax from tax record
- −$294 /mo · $3,530/yr
- Insurance
- −$74
- HOA
- −$0
- Vacancy / Maint / Mgmt
- −$406
- Net cashflow
- $232
Break-even live
Sensitivity live
| Price | -10% $332 | -5% $282 | +0% $232 | +5% $181 | +10% $131 |
|---|---|---|---|---|---|
| Rent | -10% $79 | -5% $155 | +0% $232 | +5% $308 | +10% $384 |
| Rate | -1.0pp $321 | -0.5pp $277 | base $232 | +0.5pp $186 | +1.0pp $139 |
UW: 25.0% down · 7.5% · 30yr · 1.5% tax · 5.0% vac · 8.0% maint · 8.0% mgmt
Financing live
Cash to close
- Down payment
- $44,250
- Closing costs
- $5,310
- Reserves months
- —
- Total cash needed
- —
Loan-product check · same deal, 3 products live
Conventional
25% down · 7.5% · 30yr
- Down + closing
- —
- Monthly P&I
- —
- Monthly cashflow
- —
- DSCR
- —
- Eligible?
- —
Personal DTI + credit; lowest rate.
DSCR
20% down · 8.5% · 30yr
- Down + closing
- —
- Monthly P&I
- —
- Monthly cashflow
- —
- DSCR
- —
- Eligible?
- —
No personal income docs; deal must DSCR.
Hard money
10% down · 12.0% · 12mo
- Down + closing
- —
- Monthly P&I
- —
- Monthly cashflow
- —
- DSCR
- —
- Eligible?
- —
Short-term bridge; refi at stabilization.
Rent comps 25 comps
| Address | Beds | Baths | Sqft | Rent | $/sqft | DOM | Units | Dist |
|---|---|---|---|---|---|---|---|---|
| 5012 Higgins St Unit B Houston, TX | 3.0 | 2.5 | 1611 | $1,650 | $1.02 | 26d | 1 | 0.18mi |
| 4918 Wilmington St Unit A Houston, TX | 3.0 | 3.0 | 1300 | $2,100 | $1.62 | 45d | 1 | 0.23mi |
| 5036 Mallow St Houston, TX | 3.0 | 3.0 | 1472 | $2,050 | $1.39 | 45d | 1 | 0.27mi |
| 4921a Pederson St Unit A Houston, TX | 3.0 | 2.0 | 1765 | $2,150 | $1.22 | 15d | 1 | 0.28mi |
| 4810 Wilmington St Unit A Houston, TX | 3.0 | 2.0 | 1165 | $1,650 | $1.42 | 45d | 1 | 0.36mi |
| 4723 Mallow St Houston, TX | 3.0 | 2.5 | 1472 | $1,850 | $1.26 | 7d | 1 | 0.56mi |
| 7918 Jutland Rd Houston, TX | 3.0 | 1.0 | 996 | $1,295 | $1.30 | 45d | 1 | 0.98mi |
| 4526 Knoxville St Unit A Houston, TX | 3.0 | 2.5 | 1474 | $1,775 | $1.20 | 17d | 1 | 1.00mi |
| 5458 Osprey Dr Houston, TX | 3.0 | 2.0 | 1614 | $1,595 | $0.99 | 22d | 1 | 1.04mi |
| 4514 Galesburg St Unit B Houston, TX | 3.0 | 2.5 | 1680 | $3,500 | $2.08 | 26d | 1 | 1.06mi |
| 8521 Dosia St Houston, TX | 3.0 | 2.0 | 1028 | $1,665 | $1.62 | 15d | 1 | 1.14mi |
| 5426 Greylog Dr Houston, TX | 3.0 | 2.0 | 1205 | $1,750 | $1.45 | 26d | 1 | 1.16mi |
| 10902 Faircroft Dr Houston, TX | 3.0 | 1.0 | 1308 | $1,455 | $1.11 | 1d | 1 | 1.18mi |
| 8107 Calhoun Rd Houston, TX | 3.0 | 2.5 | 1304 | $2,250 | $1.73 | 26d | 1 | 1.20mi |
| 5314 Longmeadow St Houston, TX | 3.0 | 3.0 | 1646 | $1,900 | $1.15 | 45d | 1 | 1.22mi |
| 7710 Darnay Dr Houston, TX | 3.0 | 3.0 | 1635 | $2,095 | $1.28 | 45d | 1 | 1.24mi |
| 4601 White Rock St Unit A Houston, TX | 3.0 | 2.5 | 1700 | $2,500 | $1.47 | 45d | 1 | 1.26mi |
| 5818 Glenhurst Dr Houston, TX | 3.0 | 2.0 | 1441 | $1,790 | $1.24 | 0d | 1 | 1.27mi |
| 5818 Glenhurst Dr Houston, TX | 3.0 | 2.0 | 1441 | $1,750 | $1.21 | 1d | 1 | 1.27mi |
| 4406 Sterling St Houston, TX | 3.0 | 2.5 | 1840 | $1,999 | $1.09 | 19d | 1 | 1.28mi |
| 4613 Bricker St Unit B Houston, TX | 3.0 | 2.5 | 1600 | $2,300 | $1.44 | 45d | 1 | 1.31mi |
| 4609 Bricker St Unit C Houston, TX | 2.0 | 1.5 | 1100 | $3,200 | $2.91 | 15d | 1 | 1.33mi |
| 4609 Bricker St Unit ABC Houston, TX | 3.0 | 2.5 | 1375 | $3,500 | $2.55 | 13d | 1 | 1.33mi |
| 4609 Bricker St Unit B Houston, TX | 3.0 | 2.5 | 1300 | $3,500 | $2.69 | 15d | 1 | 1.33mi |
| 11319 Murr Way Houston, TX | 3.0 | 1.5 | 1213 | $1,699 | $1.40 | 21d | 1 | 1.33mi |
Listing history 38 events
-
2026-06-21days on market $177,000 Active 104 DOM
-
2026-06-18days on market $177,000 Active 101 DOM
-
2026-06-17days on market $177,000 Active 100 DOM
-
2026-06-16days on market $177,000 Active 99 DOM
-
2026-06-15days on market $177,000 Active 98 DOM
-
2026-06-13statusdays on market $177,000 Active 96 DOM
-
2026-05-07price $182,000 616-char remark
Show marketing remark (616 chars)
Welcome to 5109 Wilmington St, a beautifully updated home that is sure to impress. The kitchen is a chef's dream, boasting an accent backsplash for a sleek, modern look. The fenced-in backyard provides a oasis for outdoor enjoyment. The interior of the home is freshly painted, providing a clean and bright living space. The exterior has also been freshly painted, enhancing the home's curb appeal. New flooring throughout the home adds a touch of elegance and ensures durability. This home is a perfect blend of style and comfort, making it a must-see property. Included 100-Day Home Warranty with buyer activation.
-
2026-04-23price $189,000 616-char remark
Show marketing remark (616 chars)
Welcome to 5109 Wilmington St, a beautifully updated home that is sure to impress. The kitchen is a chef's dream, boasting an accent backsplash for a sleek, modern look. The fenced-in backyard provides a oasis for outdoor enjoyment. The interior of the home is freshly painted, providing a clean and bright living space. The exterior has also been freshly painted, enhancing the home's curb appeal. New flooring throughout the home adds a touch of elegance and ensures durability. This home is a perfect blend of style and comfort, making it a must-see property. Included 100-Day Home Warranty with buyer activation.
-
2026-04-09price $195,000 616-char remark
Show marketing remark (616 chars)
Welcome to 5109 Wilmington St, a beautifully updated home that is sure to impress. The kitchen is a chef's dream, boasting an accent backsplash for a sleek, modern look. The fenced-in backyard provides a oasis for outdoor enjoyment. The interior of the home is freshly painted, providing a clean and bright living space. The exterior has also been freshly painted, enhancing the home's curb appeal. New flooring throughout the home adds a touch of elegance and ensures durability. This home is a perfect blend of style and comfort, making it a must-see property. Included 100-Day Home Warranty with buyer activation.
-
2026-03-27historical $1,336
-
2026-03-26price $200,000 616-char remark
Show marketing remark (616 chars)
Welcome to 5109 Wilmington St, a beautifully updated home that is sure to impress. The kitchen is a chef's dream, boasting an accent backsplash for a sleek, modern look. The fenced-in backyard provides a oasis for outdoor enjoyment. The interior of the home is freshly painted, providing a clean and bright living space. The exterior has also been freshly painted, enhancing the home's curb appeal. New flooring throughout the home adds a touch of elegance and ensures durability. This home is a perfect blend of style and comfort, making it a must-see property. Included 100-Day Home Warranty with buyer activation.
-
2026-03-21$1,336
-
2026-03-12price $205,000 616-char remark
Show marketing remark (616 chars)
Welcome to 5109 Wilmington St, a beautifully updated home that is sure to impress. The kitchen is a chef's dream, boasting an accent backsplash for a sleek, modern look. The fenced-in backyard provides a oasis for outdoor enjoyment. The interior of the home is freshly painted, providing a clean and bright living space. The exterior has also been freshly painted, enhancing the home's curb appeal. New flooring throughout the home adds a touch of elegance and ensures durability. This home is a perfect blend of style and comfort, making it a must-see property. Included 100-Day Home Warranty with buyer activation.
-
2026-02-24$209,000 Active 616-char remark
Show marketing remark (616 chars)
Welcome to 5109 Wilmington St, a beautifully updated home that is sure to impress. The kitchen is a chef's dream, boasting an accent backsplash for a sleek, modern look. The fenced-in backyard provides a oasis for outdoor enjoyment. The interior of the home is freshly painted, providing a clean and bright living space. The exterior has also been freshly painted, enhancing the home's curb appeal. New flooring throughout the home adds a touch of elegance and ensures durability. This home is a perfect blend of style and comfort, making it a must-see property. Included 100-Day Home Warranty with buyer activation.
-
2025-09-11soldstatus
-
2023-02-14soldstatus
-
2023-02-07soldstatus Sold 365-char remark
Show marketing remark (365 chars)
Excellent outer loop opportunity in the established Sunnyside area. Close to Hobby Airport and the 1940 Air Terminal Museum. Updated kitchen with quartz countertops, large utilty room with half-bath, and a fantastic storage shed in the back. Some accessibility additions such as entrance ramp at the front door, and roll-in shower with grab-bars. Bring your offers!
-
2023-01-31status Active 365-char remark
Show marketing remark (365 chars)
Excellent outer loop opportunity in the established Sunnyside area. Close to Hobby Airport and the 1940 Air Terminal Museum. Updated kitchen with quartz countertops, large utilty room with half-bath, and a fantastic storage shed in the back. Some accessibility additions such as entrance ramp at the front door, and roll-in shower with grab-bars. Bring your offers!
-
2022-12-07status Pending 365-char remark
Show marketing remark (365 chars)
Excellent outer loop opportunity in the established Sunnyside area. Close to Hobby Airport and the 1940 Air Terminal Museum. Updated kitchen with quartz countertops, large utilty room with half-bath, and a fantastic storage shed in the back. Some accessibility additions such as entrance ramp at the front door, and roll-in shower with grab-bars. Bring your offers!
-
2022-11-22status Option Pending 365-char remark
Show marketing remark (365 chars)
Excellent outer loop opportunity in the established Sunnyside area. Close to Hobby Airport and the 1940 Air Terminal Museum. Updated kitchen with quartz countertops, large utilty room with half-bath, and a fantastic storage shed in the back. Some accessibility additions such as entrance ramp at the front door, and roll-in shower with grab-bars. Bring your offers!
-
2022-11-08$225,000 Active 365-char remark
Show marketing remark (365 chars)
Excellent outer loop opportunity in the established Sunnyside area. Close to Hobby Airport and the 1940 Air Terminal Museum. Updated kitchen with quartz countertops, large utilty room with half-bath, and a fantastic storage shed in the back. Some accessibility additions such as entrance ramp at the front door, and roll-in shower with grab-bars. Bring your offers!
-
2022-03-04soldstatus
-
2021-09-28soldstatus
-
2015-05-19soldstatus
-
2015-05-15soldstatus Sold
-
2015-05-01status Pending
-
2015-03-05status Pending, Continue to Show
-
2015-02-03status Option Pending
-
2015-01-28$45,000 Active
-
2011-03-21soldstatus
-
2011-03-18soldstatus
-
2011-03-11historical
-
2010-11-01$42,000
-
2010-08-02soldstatus
-
2010-08-02soldstatus
-
2010-07-22historical
-
2010-06-01$14,900
-
1995-06-06soldstatus $14,000
ⓘ Source: listings_history table (triggers on properties + properties_extension) + one-shot
backfill from property_details.listing_events for pre-trigger history.
Tax reassessment forecast TX · Resets to sale price
- Current annual tax
- $3,530 · $294/mo
- Projected year-2 tax
- $3,530 · $294/mo
- Expected delta
- $0/yr ($0/mo · 0.0%)
ⓘ Screening estimate from a state-policy table — verify with the county assessor before closing.
Climate risk First Street
- Flood 1/10 Low FEMA zone X (unshaded) · 0% chance over 30 yrs
- Wildfire 1/10 Low
- Heat 9/10 Extreme 7 d/yr ≥109°F today · 24 d/yr by 30 yrs out
- Wind 9/10 Extreme 99% chance of damaging wind over 30 yrs
- Air quality 2/10 Low 2 unhealthy d/yr today · 2 by 30 yrs out
Nearby sold comps map
Loading sold comps map…
Walkable amenities ~0.75 mi
Loading nearby amenities…
Taxation est. · year 1
- Rental income
- $23,206
- − Mortgage interest
- −$9,915
- − Property taxes
- −$3,530
- − Insurance
- −$885
- − Repairs & maintenance
- −$1,857
- − Management
- −$1,857
- − Depreciation
- −$5,149
- Taxable income
- $14
- Est. tax owed @ 24.0%
- −$3
- After-tax cash flow
- $2,776/yr
For passive investors: Depreciation is non-cash, so a rental often shows a tax loss while cash-flowing — sheltering income. Rental losses are passive: they offset passive income freely, and up to $25,000/yr can offset ordinary (W-2) income if you actively participate and your MAGI is under $100k (phasing out to $0 by $150k); unused losses carry forward. On sale, claimed depreciation is recaptured at up to 25%, and gains may owe capital-gains tax (a 1031 exchange can defer both). Figures are a year-1 estimate at your 24.0% rate — not tax advice; consult a CPA.
Schools (NCES district)
- District
- Houston ISD
- NCES district ID
- 4823640
- Math proficiency
- 27% ▼ -18.00%
- Reading proficiency
- 35% ▼ -6.00%
- Median HH income
- $46,054
- Composite
- 26.63/100
- National rank
- #7173
- State rank
- #593 of 826 in TX
Livability — Houston
- Score
- 74/100
- State rank
- #184
- US rank
- #4771
Category grades
Schools grade is shown separately in the Schools card above.
Census & demographics
- Census place
- Houston, TX
- County
- Harris County · 4,702,590 people
- City population
- 3,226,434
- Metro
- Houston-The Woodlands-Sugar Land, TX
- Population (ZIP)
- 29,154
- Household income
- $38,071
- Rent vs Own
- Severe rent burden
- 1728.0
Population outlook (Harris County) Hauer SSP2
- Today (2025)
- 5,571,493 people
- By 2030
- 6,089,821 · +9.3%
- By 2040
- 7,142,806 · +28.2%
- By 2050
- 8,185,864 · +46.9%
- By 2075
- 10,574,329 · +89.8%
- By 2100
- 12,109,958 · +117.4%
Race, ethnicity, and origin ACS 2023
- Neighborhood character
- Majority Black (55%)
- Race & ethnicity
- Black 55% Hispanic / Latino 43% Two or more races 17% Native American 1%
- Hispanic origin (detail)
- Mexican 35%
- Common ancestry
- Lithuanian 1%
- Foreign-born
- 18% · Canada
- Languages at home
- 61% English-only · Spanish 39%
Political lean MEDSL · Harris
- 2024 margin
- Lean D (+5.5) · D 52.0% · R 46.4% · Other 1.6%
- 2008→2024 swing
- +3.9pp toward D · 2008: 1.6pp · 2024: 5.5pp
- All cycles
- 2024: D+5.5 2020: D+13.3 2016: D+12.4 2012: D+0.1 2008: D+1.6
Not yet ingested
- Civics
- —
Market trends
- HPI YoY
- ▼ -41.49%
- Current HPI
- 212.6472
- Rent YoY
- ▲ 5.45%
- Metro
- Houston-The Woodlands-Sugar Land, TX
- State GDP YoY
- ▲ 3.95%
- F500 in state
- 110
Industry mix (Fortune 500 HQ in TX)
| Industry | F500 HQs | Revenue |
|---|---|---|
| Energy | 16 | $1,198B |
|
||
| Technology | 5 | $198B |
|
||
| Engineering / Construction | 4 | $72B |
|
||
| Energy Services | 3 | $60B |
|
||
| Utilities | 3 | $41B |
|
||
| Healthcare | 2 | $330B |
|
||
Price history
+1200.0% since first listed32 events — show timeline
- 2026-05-07 Price Changed $182,000 HARMLS
- 2026-04-23 Price Changed $189,000 HARMLS
- 2026-04-09 Price Changed $195,000 HARMLS
- 2026-03-27 Rental Removed $1,336 RENTSPREE
- 2026-03-26 Price Changed $200,000 HARMLS
- 2026-03-21 Listed for Rent $1,336 RENTSPREE
- 2026-03-12 Price Changed $205,000 HARMLS
- 2026-02-24 Listed $209,000 HARMLS
- 2025-09-11 Sold (Public Records) — Public Records
- 2023-02-14 Sold (Public Records) — Public Records
- 2023-02-07 Sold (MLS) — HARMLS
- 2023-01-31 Relisted — HARMLS
- 2022-12-07 Pending — HARMLS
- 2022-11-22 Pending — HARMLS
- 2022-11-08 Listed $225,000 HARMLS
- 2022-03-04 Sold (Public Records) — Public Records
- 2021-09-28 Sold (Public Records) — Public Records
- 2015-05-19 Sold (Public Records) — Public Records
- 2015-05-15 Sold (MLS) — HARMLS
- 2015-05-01 Pending — HARMLS
- 2015-03-05 Pending — HARMLS
- 2015-02-03 Pending — HARMLS
- 2015-01-28 Listed $45,000 HARMLS
- 2011-03-21 Sold (Public Records) — Public Records
- 2011-03-18 Sold (MLS) — HARMLS
- 2011-03-11 Listing Removed — HARMLS
- 2010-11-01 Listed $42,000 HARMLS
- 2010-08-02 Sold (Public Records) — Public Records
- 2010-08-02 Sold (MLS) — HARMLS
- 2010-07-22 Listing Removed — HARMLS
- 2010-06-01 Listed $14,900 HARMLS
- 1995-06-06 Sold (Public Records) $14,000 Public Records
Property tax history
+7.5%/yrLatest (2025): $3,530 · -0.0% YoY. Source: county tax records.
Cash-flow waterfall
monthlySold comps — $/sqft
last 12 mo · ≤1 miLoading sold comps…