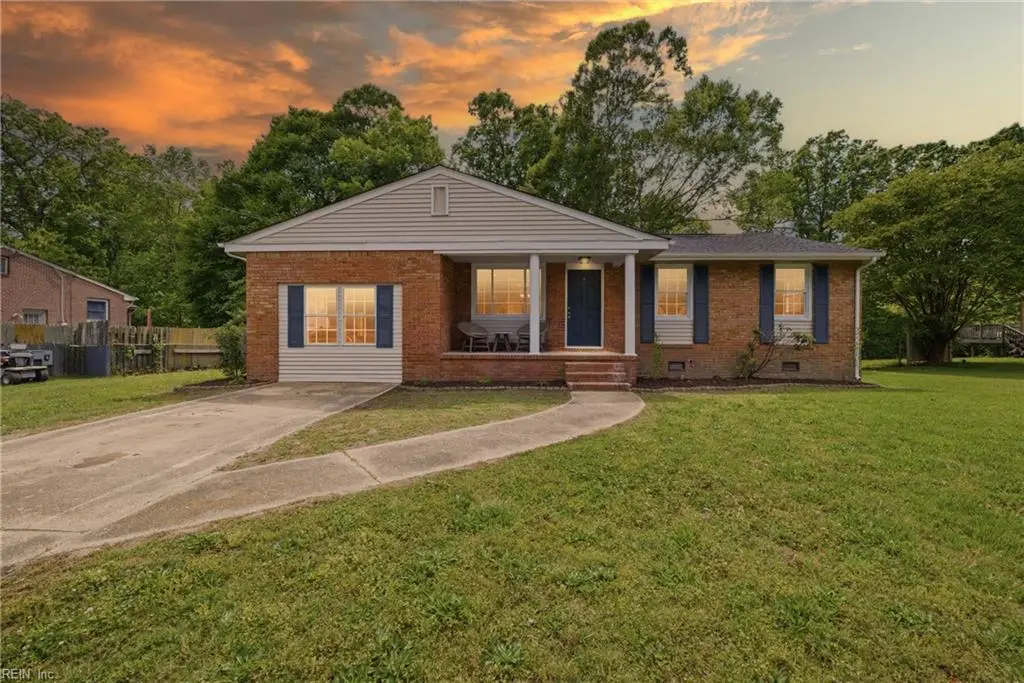
3661 Deerfield Dr · Suffolk, VA
Flood risk 1/10 · Minimal
- FEMA flood zone
- X (unshaded)
- Chance of flooding over 30 yrs
- 0.0%
- Est. flood insurance / yr
- $507 – $1,088
Fire risk 3/10 · Minor
- Est. fire insurance / yr
- $666 – $1,236
Heat risk 8/10 · Major
- Hot days now (above 106°F)
- 7 days/yr
- Hot days in 30 yrs
- 16 days/yr
Wind risk 8/10 · Major
- Chance of severe wind over 30 yrs
- 80.0%
Air-quality risk 2/10 · Minimal
- Unhealthy air days now
- 0 days/yr
- Unhealthy air days in 30 yrs
- 1 days/yr
Risk factors via First Street. Map © Google.
Why this score? — see what drove the D grade
The composite is a weighted blend of 9 inputs, each scored 0–100. Each bar is that input's sub-score; the figure is the points it added to the 100-point composite (weight × sub-score).
- Cash flow +10.8/30.0
- ARV discount +10.8/15.0
- Rent growth +5.0/5.0
- Schools +4.8/10.0
- Livability +3.9/5.0
- DSCR +3.1/10.0
- 1% rule +2.6/10.0
- Condition / age +2.5/5.0
- Appreciation +0.0/10.0
$347,700
🖨 Deal sheet (PDF) 📄 Offer letter ✓ Due diligence
Listing remarks
Beautifully renovated 3-bdrm, 2 full bath Ranch-style home offering approx. 1505 sq. ft. of move-in ready living space! This updated Suffolk home features a bright and inviting floor plan with fresh paint, all new LVP flooring, renovated bathrooms, and a beautifully updated kitchen with modern finishes and fixtures. Spacious living and open dining areas provide great flow for everyday living and entertaining. Enjoy the convenience of one-level living along with a generously sized great for relaxing, gardening, or gatherings. Conveniently located near shopping, dining, schools, and commuter routes. A wonderful opportunity to own a fully updated home that combines comfort, style, and convenie
Key facts
- 0.57 acre lot
- Built 1972
- Listed 34 days
Property features AI
Finance
- HOA & community: No HOA fees reported
Exterior
- Parking: Driveway parking; Street parking
- Utilities: City/County water; City/County sewer; Gas water heater; Natural gas available
- Home design: Detached single-family ranch; One story; Crawl foundation
- Construction: Brick siding; Asphalt shingle roof
- Exterior features: Deck; Wooded lot; Marsh and wooded views; Back privacy fence (chain link and privacy sections)
Interior
- Kitchen: Gas range; Microwave; Refrigerator; Dishwasher
- Bedrooms: First-floor bedroom with full bathroom; Master bedroom (first floor); Additional bedroom
- Flooring: Laminate
- Bathrooms: 2 full bathrooms
- Heating & cooling: Forced hot air (natural gas); Central air
- Interior features: Skylights; Cable hookup; Laminate flooring
- Laundry & utility: Washer hookup; Dryer hookup; Utility room
Neighborhood map
What this means for you Summary
Snapshot
- This is a 3-bed/1.5-bath single-family listed at $348k.
Deal economics
- At list price, monthly cash flow is $-157 ($-2k/yr) — negative.
- To cash-flow at today's rent, offer at most $320k (8.0% below list).
- To meet the 1% rule (rent ≥ 1% of price), the offer needs to be $263k (24.4% below list).
- Recommended offer: $263k (24.4% below list) — sets the bar for 1% rule.
- Cap rate 5.7% vs local median 3.5% in Suffolk — top-decile yield for the area; either an underpriced asset or a hidden risk that comps aren't pricing in. Stress-test before assuming the spread holds.
Location & tenants
- Location reads 77/100 on livability (#88 in VA, #2,896 nationally) — a middle-class / working-renter tenant base. Strengths: housing A+, health & safety A+, employment A-; Watch: crime C-, commute F.
- Suffolk City Public School District (suburban): math 41% / reading 69% proficiency, ranked #72 of 131 in VA (top 55%) — acceptable for families but not a draw, mixed tenant base, ~2y average lease.
- Zoned schools: Creekside Elementary (math 44% / reading 66%, grade C, #643 of 1,108 statewide, top 59%, 752 students, 65% FRL); John Yeates Middle (math 60% / reading 83%, grade A, #72 of 342 statewide, top 22%, 506 students, 64% FRL); Nansemond River High (math 44% / reading 87%, grade B, #204 of 319 statewide, top 65%, 1,698 students, 64% FRL) — zoned schools average 64% FRL vs 39% district-wide (25 pts higher); higher-poverty schools than district average — tighter screening recommended.
- Market conditions: Rents rising fast (+10.6%/yr); 518 active listings in the ZIP; 9 comparable units currently listed for rent nearby; rentals at typical pace (median 15d on market — plan ~3-4 weeks tenant-placement turnaround); high-income renter base; 680 units permitted in Suffolk city in 2024 (0 in 5+ unit buildings).
Forward outlook
- Local home prices are declining (-3.0%/yr); year-one equity from $2k of loan paydown is wiped out by about $10k of value loss. Plan a longer hold.
- Suffolk County population projected at +11% by 2050 — modest demand growth; plan on rents tracking national, not racing it.
Negotiation context
- It's been on market 34 days — a 3% lower offer ($337k) is reasonable based on typical stale-listing flexibility.
Risks & watch-outs
- Climate carrying-cost: severe wind risk, 80% chance of damaging wind over 30y; extreme-heat days projected 7→16/yr by 2055 (HVAC capex compounding) — expect insurance premiums to compound above CPI over the hold.
Questions for the listing agent
- What do current leases actually rent for vs. the listed asking? Can we see a recent rent roll and the last 12 months of T-12 income?
- It's been on market 34 days. Have you received any prior offers? Is the seller open to a 24% concession, seller financing, or rate buy-down credit?
- Built in 1972 — when were the roof, HVAC, electrical panel, plumbing, and water heater last replaced?
- Is there a deadline driving the sale (1031 exchange, divorce, estate, relocation)? That informs how much negotiation room exists.
- Schools are A-rated — typically a magnet for longer-tenancy family renters. What's the average tenant stay here, and is there a school-zone premium baked into asking?
- The area grade is low — what's the realistic commute time and amenity access for the typical tenant pool here? Any planned neighborhood developments (good or bad) we should know about?
- What's the average days-on-market for RENTAL listings here right now (not sales)? A rising rental-DOM trend means longer vacancies and softer asking-rent achievability than the comps imply.
- What's the recent tenant-quality profile in this submarket — average credit score on applications, eviction rate, late-payment / NSF rate, and stable-employment percentage? A property-management company in the area should have these aggregated.
- How much new for-sale + rental construction is in the pipeline within 1–3 miles? Heavy new supply typically softens prices + rents 12–24 months out; constrained supply supports both.
Investment metrics
- 1% rule
- 0.76% ✗
- Cap rate
- 5.75%
- Cash-on-cash
- -1.94%
- DSCR
- 0.91
- GRM
- 11.0
CMA / ARV
- ARV (median comp)
- $375,000
- List price
- $347,700
- Delta
- -7.28%
- Verdict
- FAIR
- Comps
- 20 within 1.0 mi
Show comp detail 12 sales within ~0.75 mi
| Address | Dist | Beds/Ba | Sqft | Sold | Price | $/sf | Match |
|---|---|---|---|---|---|---|---|
| 3681 Deerfield Dr | 0.13mi | 3/1.5 | 1,505 (0%) | 6mo | $290,000 | $193 | 89 |
| 3629 Ithaca Trl | 0.12mi | 3/1.5 | 1,521 (+1%) | 8mo | $330,000 | $217 | 86 |
| 5040 Huntclub Chase | 0.27mi | 3/2.5 | 1,541 (+2%) | 2mo | $375,000 | $243 | 78 |
| 3609 Ithaca Trl | 0.16mi | 3/2.0 | 1,605 (+7%) | 5mo | $310,000 | $193 | 75 |
| 5529 Weatherby Way | 0.16mi | 3/1.5 | 1,377 (-8%) | 7mo | $320,000 | $232 | 72 |
| 5018 Huntclub Chase | 0.35mi | 4/2.5 (+1) | 1,541 (+2%) | 2mo | $349,437 | $227 | 69 |
| 3503 Derby Cv | 0.40mi | 4/2.5 (+1) | 1,556 (+3%) | 1mo | $375,000 | $241 | 66 |
| 5517 Buckhorne Cres | 0.20mi | 3/2.0 | 1,655 (+10%) | 11mo | $407,000 | $246 | 63 |
| 3601 Corral Cv | 0.40mi | 3/2.5 | 1,576 (+5%) | 9mo | $374,999 | $238 | 62 |
| 5051 Huntclub Chase | 0.19mi | 3/2.5 | 1,726 (+15%) | 1mo | $375,000 | $217 | 62 |
| 3515 Farrier Cv | 0.23mi | 3/2.5 | 1,698 (+13%) | 7mo | $390,000 | $230 | 58 |
| 5024 Huntclub Chase | 0.33mi | 4/2.5 (+1) | 1,700 (+13%) | 4mo | $379,000 | $223 | 51 |
Match score weights: distance 35% · size 25% · config 20% · recency 20%. Top-matched comps best support the ARV.
Projected returns pro-forma
-3.0% appreciation · 8.0% rent growth · sell at horizon
- IRR
- -14.5%
- Equity multiple
- 0.46×
- Total profit
- $-52,547
- Equity at exit
- $51,843
- IRR
- 0.5%
- Equity multiple
- 1.04×
- Total profit
- $4,264
- Equity at exit
- $30,063
Cash invested: $97,356 (down + closing). Projections, not guarantees.
Landlord ↔ Tenant lean methodology
- Overall (STATE)
- 55 Moderately Landlord-Leaning
- State Virginia
- 55 Moderately Landlord-Leaning · D+2
- County
- — inherits STATE
- City
- — inherits STATE
ZIP-level market 23435
- Rents YoY
- 10.6%
- Active inventory
- 518
- Price-to-rent
- 11.0×
Monthly cashflow live
- Estimated rent
- $2,627 high interval (Pro) →
- Mortgage (P&I)
- −$1,823
- Tax from tax record
- −$265 /mo · $3,176/yr
- Insurance
- −$145
- HOA
- −$0
- Vacancy / Maint / Mgmt
- −$552
- Net cashflow
- $-157
Break-even live
Sensitivity live
| Price | -10% $39 | -5% $-59 | +0% $-157 | +5% $-256 | +10% $-354 |
|---|---|---|---|---|---|
| Rent | -10% $-365 | -5% $-261 | +0% $-157 | +5% $-54 | +10% $50 |
| Rate | -1.0pp $18 | -0.5pp $-69 | base $-157 | +0.5pp $-247 | +1.0pp $-339 |
UW: 25.0% down · 7.5% · 30yr · 1.5% tax · 5.0% vac · 8.0% maint · 8.0% mgmt
Financing live
Cash to close
- Down payment
- $86,925
- Closing costs
- $10,431
- Reserves months
- —
- Total cash needed
- —
Loan-product check · same deal, 3 products live
Conventional
25% down · 7.5% · 30yr
- Down + closing
- —
- Monthly P&I
- —
- Monthly cashflow
- —
- DSCR
- —
- Eligible?
- —
Personal DTI + credit; lowest rate.
DSCR
20% down · 8.5% · 30yr
- Down + closing
- —
- Monthly P&I
- —
- Monthly cashflow
- —
- DSCR
- —
- Eligible?
- —
No personal income docs; deal must DSCR.
Hard money
10% down · 12.0% · 12mo
- Down + closing
- —
- Monthly P&I
- —
- Monthly cashflow
- —
- DSCR
- —
- Eligible?
- —
Short-term bridge; refi at stabilization.
Rent comps 9 comps
| Address | Beds | Baths | Sqft | Rent | $/sqft | DOM | Units | Dist |
|---|---|---|---|---|---|---|---|---|
| 3111 Burlington St Suffolk, VA | 3.0 | 2.5 | 1638 | $2,700 | $1.65 | 23d | 1 | 0.24mi |
| 604 Teton Cir Suffolk, VA | 3.0 | 2.5 | 1701 | $2,500 | $1.47 | 14d | 1 | 0.27mi |
| 2113 Livingston St Suffolk, VA | 3.0 | 2.5 | 1770 | $2,750 | $1.55 | 6d | 1 | 0.32mi |
| 2230 Livingston St Suffolk, VA | 3.0 | 2.5 | 1659 | $2,500 | $1.51 | 6d | 1 | 0.42mi |
| 2230 Livingston St Suffolk, VA | 3.0 | 2.5 | 1767 | $2,500 | $1.41 | 9d | 1 | 0.42mi |
| 2003 Laycock Ln Suffolk, VA | 3.0 | 2.5 | 1771 | $2,500 | $1.41 | 45d | 1 | 0.86mi |
| 1005 Serene Rd #103 Suffolk, VA | 4.0 | 3.5 | 2071 | $2,900 | $1.40 | 6d | 1 | 1.03mi |
| 371 Canaan Cir Suffolk, VA | 4.0 | 2.5 | 2132 | $3,200 | $1.50 | 45d | 1 | 1.38mi |
| 5109 James St Chesapeake, VA | 3.0 | 1.5 | 1128 | $2,200 | $1.95 | 45d | 1 | 1.49mi |
Listing history 9 events
-
2026-06-10status $347,700 Under Contract 34 DOM
-
2026-06-09days on market $347,700 Active Under Contract 34 DOM
-
2026-06-08days on market $347,700 Active Under Contract 33 DOM
-
2026-06-07days on market $347,700 Active Under Contract 32 DOM
-
2026-06-03days on market $347,700 Active Under Contract 28 DOM
-
2026-06-02days on market $347,700 Active Under Contract 27 DOM
-
2026-06-01days on market $347,700 Active Under Contract 26 DOM
-
2026-05-31days on market $347,700 Active Under Contract 25 DOM
-
2026-05-06$347,700 Active 703-char remark
ⓘ Source: listings_history table (triggers on properties + properties_extension) + one-shot
backfill from property_details.listing_events for pre-trigger history.
Tax reassessment forecast VA · Resets to sale price
- Current annual tax
- $3,176 · $265/mo
- Projected year-2 tax
- $3,176 · $265/mo
- Expected delta
- $0/yr ($0/mo · 0.0%)
ⓘ Screening estimate from a state-policy table — verify with the county assessor before closing.
Climate risk First Street
- Flood 1/10 Low FEMA zone X (unshaded) · 0% chance over 30 yrs
- Wildfire 3/10 Moderate
- Heat 8/10 Severe 7 d/yr ≥106°F today · 16 d/yr by 30 yrs out
- Wind 8/10 Severe 80% chance of damaging wind over 30 yrs
- Air quality 2/10 Low 0 unhealthy d/yr today · 1 by 30 yrs out
Nearby sold comps map
Loading sold comps map…
Walkable amenities ~0.75 mi
Loading nearby amenities…
Taxation est. · year 1
- Rental income
- $31,527
- − Mortgage interest
- −$19,477
- − Property taxes
- −$3,176
- − Insurance
- −$1,738
- − Repairs & maintenance
- −$2,522
- − Management
- −$2,522
- − Depreciation
- −$10,115
- Taxable loss
- −$8,023
- Est. tax savings @ 24.0%
- +$1,926
- After-tax cash flow
- $37/yr
For passive investors: Depreciation is non-cash, so a rental often shows a tax loss while cash-flowing — sheltering income. Rental losses are passive: they offset passive income freely, and up to $25,000/yr can offset ordinary (W-2) income if you actively participate and your MAGI is under $100k (phasing out to $0 by $150k); unused losses carry forward. On sale, claimed depreciation is recaptured at up to 25%, and gains may owe capital-gains tax (a 1031 exchange can defer both). Figures are a year-1 estimate at your 24.0% rate — not tax advice; consult a CPA.
Schools (NCES district)
- District
- Suffolk City Public School District
- NCES district ID
- 5103710
- Math proficiency
- 41% ▼ -43.00%
- Reading proficiency
- 69% ▼ -8.00%
- Median HH income
- $65,573
- Composite
- 48.31/100
- National rank
- #2151
- State rank
- #72 of 131 in VA
Livability — Suffolk
- Score
- 77/100
- State rank
- #88
- US rank
- #2896
Category grades
Schools grade is shown separately in the Schools card above.
Census & demographics
- Census place
- Suffolk, VA
- County
- Suffolk City · 88,108 people
- City population
- 88,108
- Metro
- Virginia Beach-Norfolk-Newport News, VA-NC
- Population (ZIP)
- 33,721
- Household income
- $111,700
- Rent vs Own
- Severe rent burden
- 1074.0
Population outlook (Suffolk County) Hauer SSP2
- Today (2025)
- 95,269 people
- By 2030
- 98,269 · +3.1%
- By 2040
- 103,177 · +8.3%
- By 2050
- 105,777 · +11.0%
- By 2075
- 110,963 · +16.5%
- By 2100
- 103,711 · +8.9%
Race, ethnicity, and origin ACS 2023
- Neighborhood character
- Diverse neighborhood (Simpson 0.64)
- Race & ethnicity
- White 47% Black 36% Two or more races 9% Hispanic / Latino 6% Asian 4%
- Hispanic origin (detail)
- Mexican 2% Puerto Rican 2%
- Common ancestry
- Romanian 2% Italian 2% Slovak 1%
- Foreign-born
- 6% · Canada, Vietnam, China
- Languages at home
- 91% English-only · Spanish 4% Chinese 1% German/W. Germanic 1%
Political lean MEDSL · Suffolk
- 2024 margin
- D (+15.9) · D 57.4% · R 41.5% · Other 1.2%
- 2008→2024 swing
- +2.7pp toward D · 2008: 13.2pp · 2024: 15.9pp
- All cycles
- 2024: D+15.9 2020: D+17.3 2016: D+13.8 2012: D+15.1 2008: D+13.2
Not yet ingested
- Civics
- —
Market trends
- HPI YoY
- ▼ -155.93%
- Current HPI
- 162.3775
- Rent YoY
- ▲ 10.61%
- Metro
- Virginia Beach-Norfolk-Newport News, VA-NC
- State GDP YoY
- ▲ 2.40%
- F500 in state
- 50
Industry mix (Fortune 500 HQ in VA)
| Industry | F500 HQs | Revenue |
|---|---|---|
| Aerospace / Defense | 4 | $236B |
|
||
| Technology / Defense | 3 | $32B |
|
||
| Financial Services | 2 | $176B |
|
||
| Utilities | 2 | $27B |
|
||
| Insurance | 2 | $25B |
|
||
| Technology | 2 | $15B |
|
||
Price history
3 events — show timeline
- 2026-06-09 Pending — REINMLS
- 2026-05-27 Contingent — REINMLS
- 2026-05-06 Listed $347,700 REINMLS
Property tax history
+4.8%/yrLatest (2025): $3,176 · +8.1% YoY. Source: county tax records.
Cash-flow waterfall
monthlySold comps — $/sqft
last 12 mo · ≤1 miLoading sold comps…