1954 Quail Ridge Ct #1701 · Cocoa, FL
Flood risk 1/10 · Minimal
- FEMA flood zone
- X (unshaded)
- Chance of flooding over 30 yrs
- 0.0%
- Est. flood insurance / yr
- $507 – $1,088
Fire risk 5/10 · Moderate
- Est. fire insurance / yr
- $947 – $1,759
Heat risk 10/10 · Severe
- Hot days now (above 106°F)
- 7 days/yr
- Hot days in 30 yrs
- 24 days/yr
Wind risk 10/10 · Severe
- Chance of severe wind over 30 yrs
- 99.0%
Air-quality risk 1/10 · Minimal
- Unhealthy air days now
- 0 days/yr
- Unhealthy air days in 30 yrs
- 0 days/yr
Risk factors via First Street. Map © Google.
Why this score? — see what drove the D- grade
The composite is a weighted blend of 9 inputs, each scored 0–100. Each bar is that input's sub-score; the figure is the points it added to the 100-point composite (weight × sub-score).
- Cash flow +8.7/30.0
- ARV discount +7.5/15.0
- 1% rule +6.7/10.0
- Schools +4.7/10.0
- Rent growth +3.9/5.0
- Livability +3.6/5.0
- Condition / age +2.5/5.0
- DSCR +2.4/10.0
- Appreciation +0.0/10.0
$160,000
🖨 Deal sheet 📄 Offer letter ✓ Due diligence
Listing remarks
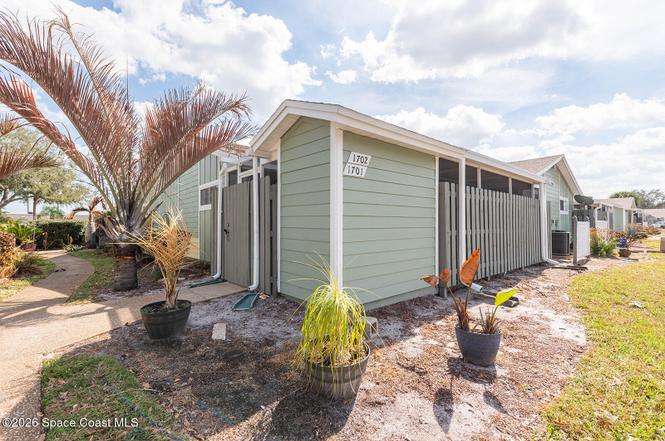
Quail Ridge offers resort-style amenities and charming patio homes that capture the Florida lifestyle. This unique unit features large rooms, an open floor plan, and vaulted ceilings that create a bright and spacious feel. Enjoy year-round outdoor living on the fully covered and screened porch with a private storage shed, accessible through sliding glass doors from both bedrooms. Tile flooring runs throughout the main living areas and primary bedroom, with new carpet planned for the second bedroom. The home sits just across from a peaceful pond and fountain. Residents enjoy three community pools and basic cable included. The community allows rentals with a 30-day minimum, offering added fle
Key facts
- Screened porch
- Tile flooring
- Fully covered porch
Tags
Neighborhood map
What this means for you Summary
Snapshot
- This is a 2-bed/2.0-bath condo listed at $160k.
Deal economics
- At list price, monthly cash flow is $-136 ($-2k/yr) — negative.
- To cash-flow at today's rent, offer at most $136k (15.0% below list).
- Meets the 1% rule at list price ($2k rent vs $160k).
- Recommended offer: $136k (15.0% below list) — sets the bar for cash-flow.
Location & tenants
- Location reads 72/100 on livability (#344 in FL) — a middle-class / working-renter tenant base. Strengths: commute A+, cost of living A+, housing A+; Watch: crime F, amenities F, employment D-.
- Brevard (suburban): math 53% / reading 57% proficiency, ranked #19 of 73 in FL (top 26%) — acceptable for families but not a draw, mixed tenant base, ~2y average lease.
- Zoned schools: Cambridge Elementary Magnet School (math 38% / reading 31%, grade F, #1,709 of 2,144 statewide, top 81%, 495 students, 78% FRL); Cocoa High School (math 21% / reading 27%, grade F, #529 of 667 statewide, top 80%, 1,551 students, 73% FRL) — zoned schools average 76% FRL vs 43% district-wide (33 pts higher); higher-poverty schools than district average — tighter screening recommended.
- Zoned-school proficiency averages 29% at this address vs 55% district-wide (-26 pts) — the specific schools serving this property underperform the Brevard average; the district grade overstates school quality for this exact location.
- Market conditions: Rents rising fast (+5.6%/yr); 291 active listings in the ZIP; 12 comparable units currently listed for rent nearby; rentals at typical pace (median 21d on market — plan ~3-4 weeks tenant-placement turnaround); 4,602 units permitted in Brevard County in 2024 (702 in 5+ unit buildings).
- This rent runs 32% of the median local income ($71k/yr) — at the standard rent-burdened threshold; future hikes will face affordability resistance.
Forward outlook
- Local home prices are declining (-3.0%/yr); year-one equity from $1k of loan paydown is wiped out by about $5k of value loss. Plan a longer hold.
- Brevard County population projected at +15% by 2050 — modest demand growth; plan on rents tracking national, not racing it.
Negotiation context
- Only 7 days on market — expect competitive offers; lowballing is unlikely to land.
- Current owner paid $54k; list at $160k implies a 197% gain — meaningful room to come down on a strong offer.
Risks & watch-outs
- Watch-outs: HOA is 25% of rent.
- Climate carrying-cost: severe wind risk, 99% chance of damaging wind over 30y; moderate wildfire risk; extreme-heat days projected 7→24/yr by 2055 (HVAC capex compounding) — expect insurance premiums to compound above CPI over the hold.
Questions for the listing agent
- What do current leases actually rent for vs. the listed asking? Can we see a recent rent roll and the last 12 months of T-12 income?
- What does the HOA fee cover, when was the last increase, and are there any pending special assessments or reserve-fund shortfalls?
- Any open or pending special assessments — roof, HVAC, plumbing, elevator, façade? What's the per-unit balance and payoff schedule, and is the seller paying it off at close or rolling it to the buyer?
- Is there a deadline driving the sale (1031 exchange, divorce, estate, relocation)? That informs how much negotiation room exists.
- Schools are B-rated — typically a magnet for longer-tenancy family renters. What's the average tenant stay here, and is there a school-zone premium baked into asking?
- Crime grade is F in this area — have there been break-ins, vandalism, or insurance claims at this property in the last 3 years? What carrier currently insures it and at what premium?
- The area grade is low — what's the realistic commute time and amenity access for the typical tenant pool here? Any planned neighborhood developments (good or bad) we should know about?
- What's the average days-on-market for RENTAL listings here right now (not sales)? A rising rental-DOM trend means longer vacancies and softer asking-rent achievability than the comps imply.
- What's the recent tenant-quality profile in this submarket — average credit score on applications, eviction rate, late-payment / NSF rate, and stable-employment percentage? A property-management company in the area should have these aggregated.
- How much new apartment / multifamily construction is in the pipeline within 1–3 miles? Heavy new supply (>2% of stock underway) typically softens rents 12–24 months out; light construction supports rent growth.
Investment metrics
- 1% rule
- 1.17% ✓
- Cap rate
- 5.27%
- Cash-on-cash
- -3.64%
- DSCR
- 0.84
- GRM
- 7.1
CMA / ARV
No comps found within radius.
Projected returns pro-forma
-3.0% appreciation · 5.6% rent growth · sell at horizon
- IRR
- -17.9%
- Equity multiple
- 0.35×
- Total profit
- $-29,216
- Equity at exit
- $23,857
- IRR
- -3.9%
- Equity multiple
- 0.70×
- Total profit
- $-13,432
- Equity at exit
- $13,834
Cash invested: $44,800 (down + closing). Projections, not guarantees.
Landlord ↔ Tenant lean methodology
- Overall (STATE)
- 87 Strongly Landlord-Friendly
- State Florida
- 87 Strongly Landlord-Friendly · R+3
- County
- — inherits STATE
- City
- — inherits STATE
ZIP-level market 32926
- Home prices YoY
- -16.9%
- Rents YoY
- 5.6%
- Active inventory
- 291
- Price-to-rent
- 7.1×
Monthly cashflow live
- Estimated rent
- $1,874 high interval (Pro) →
- Mortgage (P&I)
- −$839
- Tax from tax record
- −$243 /mo · $2,914/yr
- Insurance
- −$67
- HOA
- −$468
- Vacancy / Maint / Mgmt
- −$394
- Net cashflow
- $-136
Break-even live
UW: 25.0% down · 7.5% · 30yr · 1.5% tax · 5.0% vac · 8.0% maint · 8.0% mgmt
Financing live
Cash to close
- Down payment
- $40,000
- Closing costs
- $4,800
- Reserves months
- —
- Total cash needed
- —
Loan-product check · same deal, 3 products live
Conventional
25% down · 7.5% · 30yr
- Down + closing
- —
- Monthly P&I
- —
- Monthly cashflow
- —
- DSCR
- —
- Eligible?
- —
Personal DTI + credit; lowest rate.
DSCR
20% down · 8.5% · 30yr
- Down + closing
- —
- Monthly P&I
- —
- Monthly cashflow
- —
- DSCR
- —
- Eligible?
- —
No personal income docs; deal must DSCR.
Hard money
10% down · 12.0% · 12mo
- Down + closing
- —
- Monthly P&I
- —
- Monthly cashflow
- —
- DSCR
- —
- Eligible?
- —
Short-term bridge; refi at stabilization.
Rent comps 12 comps
| Address | Beds | Baths | Sqft | Rent | $/sqft | DOM | Units | Dist |
|---|---|---|---|---|---|---|---|---|
| 3070 Cirrus Dr Cocoa, FL | 3.0 | 1.0–2.0 | 1002 | $2,326 | $2.32 | 14d | 29 | 0.57mi |
| 1710 University Ln #408 Cocoa, FL | 2.0 | 2.0 | 864 | $1,400 | $1.62 | 14d | 1 | 0.61mi |
| 1704 University Ln #701 Cocoa, FL | 2.0 | 2.0 | 864 | $1,225 | $1.42 | 23d | 1 | 0.66mi |
| 312 Bellair Dr Cocoa, FL | 2.0 | 1.0 | 984 | $1,700 | $1.73 | 23d | 1 | 0.67mi |
| 3028 Winchester Dr Cocoa, FL | 3.0 | 2.0 | 1125 | $1,915 | $1.70 | 21d | 1 | 0.72mi |
| 318 Lucerne Dr Cocoa, FL | 3.0 | 1.0 | 1145 | $1,700 | $1.48 | 19d | 1 | 0.74mi |
| 1524 Clearlake Rd Cocoa, FL | 1.0–2.0 | 1.0 | 720 | $1,822 | $2.53 | 19d | 6 | 0.79mi |
| 214 Lucerne Dr Unit 1381666P Cocoa, FL | 3.0 | 1.0 | 1151 | $3,539 | $3.07 | 14d | 1 | 0.80mi |
| 1514 Clearlake Rd #110 Cocoa, FL | 2.0 | 2.0 | 1070 | $1,295 | $1.21 | 23d | 1 | 0.85mi |
| 1660 Rosetine St Unit 1 Cocoa, FL | 2.0 | 2.0 | 1200 | $1,645 | $1.37 | 19d | 1 | 0.89mi |
| 1202 Princeton Rd Cocoa, FL | 3.0 | 2.0 | 1473 | $2,150 | $1.46 | 23d | 1 | 1.10mi |
| 1706 Pineda St Cocoa, FL | 3.0 | 2.0 | 1020 | $1,700 | $1.67 | 23d | 1 | 1.16mi |
HOA detail condo
- Monthly dues
- $468 · $5,616/yr
- Likely covers
- cablepool
- Assessments
- None detected in remarks — confirm with the listing agent.
Listing history 3 events
-
2026-03-12status Pending
-
2026-03-05$160,000 Active
-
1990-03-01soldstatus $53,900
ⓘ Source: listings_history table (triggers on properties + properties_extension) + one-shot
backfill from property_details.listing_events for pre-trigger history.
Tax reassessment forecast FL · Resets to sale price
- Current annual tax
- $2,914 · $243/mo
- Projected year-2 tax
- $2,914 · $243/mo
- Expected delta
- $0/yr ($0/mo · 0.0%)
ⓘ Screening estimate from a state-policy table — verify with the county assessor before closing.
Climate risk First Street
- Flood 1/10 Low FEMA zone X (unshaded) · 0% chance over 30 yrs
- Wildfire 5/10 Major
- Heat 10/10 Extreme 7 d/yr ≥106°F today · 24 d/yr by 30 yrs out
- Wind 10/10 Extreme 99% chance of damaging wind over 30 yrs
- Air quality 1/10 Low 0 unhealthy d/yr today · 0 by 30 yrs out
Nearby sold comps map
Loading sold comps map…
Walkable amenities ~0.75 mi
Loading nearby amenities…
Taxation est. · year 1
- Rental income
- $22,490
- − Mortgage interest
- −$8,962
- − Property taxes
- −$2,914
- − Insurance
- −$800
- − Repairs & maintenance
- −$1,799
- − Management
- −$1,799
- − HOA
- −$5,616
- − Depreciation
- −$4,655
- Taxable loss
- −$4,056
- Est. tax savings @ 24.0%
- +$973
- After-tax cash flow
- $-658/yr
For passive investors: Depreciation is non-cash, so a rental often shows a tax loss while cash-flowing — sheltering income. Rental losses are passive: they offset passive income freely, and up to $25,000/yr can offset ordinary (W-2) income if you actively participate and your MAGI is under $100k (phasing out to $0 by $150k); unused losses carry forward. On sale, claimed depreciation is recaptured at up to 25%, and gains may owe capital-gains tax (a 1031 exchange can defer both). Figures are a year-1 estimate at your 24.0% rate — not tax advice; consult a CPA.
Schools (NCES district)
- District
- Brevard
- NCES district ID
- 1200150
- Math proficiency
- 53% ▼ -9.00%
- Reading proficiency
- 57% ▼ -4.00%
- Median HH income
- $49,426
- Composite
- 46.86/100
- National rank
- #2370
- State rank
- #19 of 73 in FL
Livability — Cocoa
- Score
- 72/100
- State rank
- #344
- US rank
- #5979
Category grades
Schools grade is shown separately in the Schools card above.
Census & demographics
- Census place
- Cocoa, FL
- County
- Brevard County · 602,871 people
- City population
- 67,424
- Metro
- Palm Bay-Melbourne-Titusville, FL
- Population (ZIP)
- 23,505
- Household income
- $70,735
- Rent vs Own
- Severe rent burden
- 782.0
Population outlook (Brevard County) Hauer SSP2
- Today (2025)
- 623,254 people
- By 2030
- 648,420 · +4.0%
- By 2040
- 690,009 · +10.7%
- By 2050
- 715,669 · +14.8%
- By 2075
- 775,744 · +24.5%
- By 2100
- 776,687 · +24.6%
Race, ethnicity, and origin ACS 2023
- Neighborhood character
- Predominantly White (72%)
- Race & ethnicity
- White 72% Black 11% Hispanic / Latino 10% Two or more races 9% Asian 2%
- Hispanic origin (detail)
- Mexican 5% Puerto Rican 2%
- Common ancestry
- Romanian 2% Lithuanian 2% Italian 2%
- Foreign-born
- 5% · Canada, Vietnam, Jamaica
- Languages at home
- 91% English-only · Spanish 6% Vietnamese 1% German/W. Germanic 1%
Political lean MEDSL · Brevard
- 2024 margin
- Strong R (+20.8) · D 39.1% · R 59.9% · Other 1.0%
- 2008→2024 swing
- -10.4pp toward R · 2008: -10.4pp · 2024: -20.8pp
- All cycles
- 2024: R+20.8 2020: R+16.4 2016: R+19.8 2012: R+12.7 2008: R+10.4
Not yet ingested
- Civics
- —
Market trends
- HPI YoY
- ▼ -68.32%
- Current HPI
- 335.1251
- Rent YoY
- ▲ 5.60%
- Metro
- Palm Bay-Melbourne-Titusville, FL
- State GDP YoY
- ▲ 3.28%
- F500 in state
- 36
Industry mix (Fortune 500 HQ in FL)
| Industry | F500 HQs | Revenue |
|---|---|---|
| Industrial Technology | 2 | $29B |
|
||
| Insurance | 2 | $17B |
|
||
| Retail | 1 | $60B |
|
||
| Technology Distribution | 1 | $58B |
|
||
| Homebuilding | 1 | $35B |
|
||
| Technology Manufacturing | 1 | $35B |
|
||
Price history
+196.8% since first listed3 events — show timeline
- 2026-03-12 Pending — SCMLS
- 2026-03-05 Listed $160,000 SCMLS
- 1990-03-01 Sold (Public Records) $53,900 Public Records
Property tax history
+17.2%/yrLatest (2025): $2,914 · +5.3% YoY. Source: county tax records.
Cash-flow waterfall
monthlySold comps — $/sqft
last 12 mo · ≤1 miLoading sold comps…