704 Pine St · Pleasanton, KS
Flood risk 1/10 · Minimal
- FEMA flood zone
- X (unshaded)
- Chance of flooding over 30 yrs
- 0.0%
- Est. flood insurance / yr
- $507 – $1,088
Fire risk 3/10 · Minor
- Est. fire insurance / yr
- $1,154 – $2,142
Heat risk 4/10 · Minor
- Hot days now (above 108°F)
- 7 days/yr
- Hot days in 30 yrs
- 18 days/yr
Wind risk 2/10 · Minimal
- Chance of severe wind over 30 yrs
- 0.0%
Air-quality risk 2/10 · Minimal
- Unhealthy air days now
- 1 days/yr
- Unhealthy air days in 30 yrs
- 1 days/yr
Risk factors via First Street. Map © Google.
Why this score? — see what drove the B+ grade
The composite is a weighted blend of 9 inputs, each scored 0–100. Each bar is that input's sub-score; the figure is the points it added to the 100-point composite (weight × sub-score).
- Cash flow +30.0/30.0
- 1% rule +10.0/10.0
- DSCR +10.0/10.0
- Appreciation +9.4/10.0
- ARV discount +7.5/15.0
- Livability +3.1/5.0
- Rent growth +2.5/5.0
- Condition / age +2.5/5.0
- Schools +2.2/10.0
$25,000
🖨 Deal sheet (PDF) 📄 Offer letter ✓ Due diligence
Listing remarks
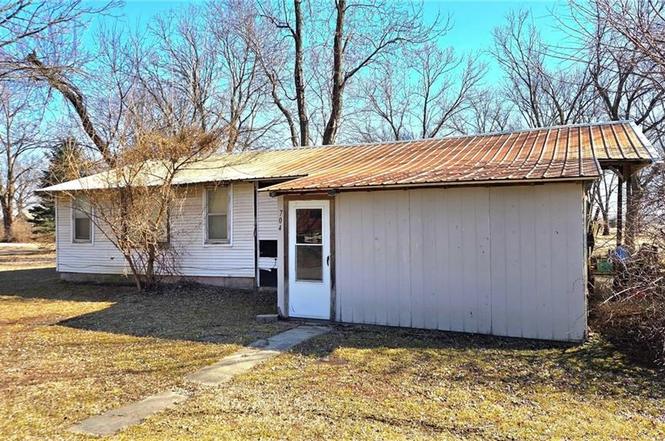
Pleasanton, KS Fixer-upper on a corner level lot with multiple mature hardwood shade trees. This manufactured home has received multiple stick frame additions through the years, including a 2 bay open lean-to garage, a metal roof, and more. The water meter is City of Pleasanton.
Key facts
- Metal roof
- Corner level lot
- 0.32 acre lot
Tags
Property features AI
Finance
- HOA & community: No association fees
Exterior
- Parking: Detached garage (garage present)
- Utilities: Public water; Public sewer
- Home design: Single family residence; Mobile/manufactured home
- Construction: Vinyl siding; Metal roof
- Exterior features: Deck; City limits / city lot; Corner lot; Paved road access with public maintenance
Interior
- Bedrooms: 3 bedrooms
- Flooring: Carpet; Vinyl
- Bathrooms: 1 full bathroom
- Heating & cooling: No listed heating; Has cooling
- Interior features: Crawl space basement; Fireplace in the family room
Neighborhood map
What this means for you Summary
Snapshot
- This is a 3-bed/1.0-bath manufactured listed at $25k.
Deal economics
- At list price, monthly cash flow is $564 ($7k/yr) — positive.
- The deal already cash-flows at list — no discount required.
- Meets the 1% rule at list price ($933 rent vs $25k).
- Recommended offer: $23k (9.0% below list) — sets the bar for market timing.
Location & tenants
- Location reads 62/100 on livability (#360 in KS) — a middle-class / working-renter tenant base. Strengths: cost of living A+, housing A+, crime B+; Watch: health & safety C-, schools F, amenities F.
- Pleasanton (rural): math 25% / reading 20% proficiency, ranked #253 of 280 in KS (top 90%) — low school quality limits family demand, transient renter base, plan for 1-2y turnover.
- Market conditions: 32 active listings in the ZIP; 97 units permitted in Linn County in 2024 (0 in 5+ unit buildings).
Forward outlook
- In year one you build about $2k of equity ($173 loan paydown + $2k appreciation (8.8% local appreciation)).
- At projected returns (8.8% appreciation + 3.0% rent growth), your $7k cash investment doubles in ~1 year — after that, you're playing with house money.
Negotiation context
- It's been on market 120 days — a 9% lower offer ($23k) is reasonable based on typical stale-listing flexibility.
- Current owner paid $5k; list at $25k implies a 400% gain — meaningful room to come down on a strong offer.
Questions for the listing agent
- It's been on market 120 days. Have you received any prior offers? Is the seller open to a 9% concession, seller financing, or rate buy-down credit?
- Built in 1972 — when were the roof, HVAC, electrical panel, plumbing, and water heater last replaced?
- Why hasn't it sold? Are there any deal-killer items the seller is aware of (foundation, flood, title, zoning, code violations)?
- Is there a deadline driving the sale (1031 exchange, divorce, estate, relocation)? That informs how much negotiation room exists.
- Schools are F-rated, which usually means shorter tenancies and higher turnover. Who's the typical renter profile here, and what's been the actual vacancy rate?
- What's the average days-on-market for RENTAL listings here right now (not sales)? A rising rental-DOM trend means longer vacancies and softer asking-rent achievability than the comps imply.
- What's the recent tenant-quality profile in this submarket — average credit score on applications, eviction rate, late-payment / NSF rate, and stable-employment percentage? A property-management company in the area should have these aggregated.
- How much new for-sale + rental construction is in the pipeline within 1–3 miles? Heavy new supply typically softens prices + rents 12–24 months out; constrained supply supports both.
Investment metrics
- 1% rule
- 3.73% ✓
- Cap rate
- 33.39%
- Cash-on-cash
- 96.76%
- DSCR
- 5.31
- GRM
- 2.2
CMA / ARV
No comps found within radius.
Projected returns pro-forma
8.84% appreciation · 3.0% rent growth · sell at horizon
- IRR
- —
- Equity multiple
- 7.80×
- Total profit
- $47,619
- Equity at exit
- $20,437
- IRR
- —
- Equity multiple
- 16.94×
- Total profit
- $111,610
- Equity at exit
- $42,028
Cash invested: $7,000 (down + closing). Projections, not guarantees.
Landlord ↔ Tenant lean methodology
- Overall (STATE)
- 83 Strongly Landlord-Friendly
- State Kansas
- 83 Strongly Landlord-Friendly · R+10
- County
- — inherits STATE
- City
- — inherits STATE
ZIP-level market 66075
- Home prices YoY
- 2.8%
- Active inventory
- 32
- Price-to-rent
- 2.2×
Monthly cashflow live
- Estimated rent
- $933 medium interval (Pro) →
- Mortgage (P&I)
- −$131
- Tax est. 1.5%
- −$31 /mo · $375/yr
- Insurance
- −$10
- HOA
- −$0
- Vacancy / Maint / Mgmt
- −$196
- Net cashflow
- $564
Break-even live
Sensitivity live
| Price | -10% $582 | -5% $573 | +0% $564 | +5% $556 | +10% $547 |
|---|---|---|---|---|---|
| Rent | -10% $491 | -5% $528 | +0% $564 | +5% $601 | +10% $638 |
| Rate | -1.0pp $577 | -0.5pp $571 | base $564 | +0.5pp $558 | +1.0pp $551 |
UW: 25.0% down · 7.5% · 30yr · 1.5% tax · 5.0% vac · 8.0% maint · 8.0% mgmt
Financing live
Cash to close
- Down payment
- $6,250
- Closing costs
- $750
- Reserves months
- —
- Total cash needed
- —
Loan-product check · same deal, 3 products live
Conventional
25% down · 7.5% · 30yr
- Down + closing
- —
- Monthly P&I
- —
- Monthly cashflow
- —
- DSCR
- —
- Eligible?
- —
Personal DTI + credit; lowest rate.
DSCR
20% down · 8.5% · 30yr
- Down + closing
- —
- Monthly P&I
- —
- Monthly cashflow
- —
- DSCR
- —
- Eligible?
- —
No personal income docs; deal must DSCR.
Hard money
10% down · 12.0% · 12mo
- Down + closing
- —
- Monthly P&I
- —
- Monthly cashflow
- —
- DSCR
- —
- Eligible?
- —
Short-term bridge; refi at stabilization.
Listing history 18 events
-
2026-06-21days on market $25,000 Active 120 DOM
-
2026-06-18days on market $25,000 Active 118 DOM
-
2026-06-17days on market $25,000 Active 117 DOM
-
2026-06-16days on market $25,000 Active 116 DOM
-
2026-06-15days on market $25,000 Active 115 DOM
-
2026-06-13days on market $25,000 Active 113 DOM
-
2026-06-12days on market $25,000 Active 112 DOM
-
2026-06-09days on market $25,000 Active 109 DOM
-
2026-06-08days on market $25,000 Active 108 DOM
-
2026-06-07days on market $25,000 Active 107 DOM
-
2026-06-05days on market $25,000 Active 105 DOM
-
2026-06-04days on market $25,000 Active 103 DOM
-
2026-06-02days on market $25,000 Active 102 DOM
-
2026-06-01days on market $25,000 Active 101 DOM
-
2026-05-31days on market $25,000 Active 100 DOM
-
2026-05-31days on market $25,000 Active 99 DOM
-
2026-02-20$25,000 Active
-
1986-08-01soldstatus $5,000
ⓘ Source: listings_history table (triggers on properties + properties_extension) + one-shot
backfill from property_details.listing_events for pre-trigger history.
Climate risk First Street
- Flood 1/10 Low FEMA zone X (unshaded) · 0% chance over 30 yrs
- Wildfire 3/10 Moderate
- Heat 4/10 Moderate 7 d/yr ≥108°F today · 18 d/yr by 30 yrs out
- Wind 2/10 Low 0% chance of damaging wind over 30 yrs
- Air quality 2/10 Low 1 unhealthy d/yr today · 1 by 30 yrs out
Nearby sold comps map
Loading sold comps map…
Walkable amenities ~0.75 mi
Loading nearby amenities…
Taxation est. · year 1
- Rental income
- $11,198
- − Mortgage interest
- −$1,400
- − Property taxes
- −$375
- − Insurance
- −$125
- − Repairs & maintenance
- −$896
- − Management
- −$896
- − Depreciation
- −$727
- Taxable income
- $6,779
- Est. tax owed @ 24.0%
- −$1,627
- After-tax cash flow
- $5,146/yr
For passive investors: Depreciation is non-cash, so a rental often shows a tax loss while cash-flowing — sheltering income. Rental losses are passive: they offset passive income freely, and up to $25,000/yr can offset ordinary (W-2) income if you actively participate and your MAGI is under $100k (phasing out to $0 by $150k); unused losses carry forward. On sale, claimed depreciation is recaptured at up to 25%, and gains may owe capital-gains tax (a 1031 exchange can defer both). Figures are a year-1 estimate at your 24.0% rate — not tax advice; consult a CPA.
Schools (NCES district)
- District
- Pleasanton
- NCES district ID
- 2010770
- Math proficiency
- 25% ▲ 5.00%
- Reading proficiency
- 20% ▲ 5.00%
- Median HH income
- $39,830
- Composite
- 22.17/100
- National rank
- #13519
- State rank
- #253 of 280 in KS
Livability — Pleasanton
- Score
- 62/100
- State rank
- #360
- US rank
- #16295
Category grades
Schools grade is shown separately in the Schools card above.
Census & demographics
- Census place
- Pleasanton, KS
- Population (ZIP)
- 2,305
Population outlook (Linn County) Hauer SSP2
- Today (2025)
- 9,581 people
- By 2030
- 9,574 · -0.1%
- By 2040
- 9,550 · -0.3%
- By 2050
- 9,483 · -1.0%
- By 2075
- 9,510 · -0.7%
- By 2100
- 8,873 · -7.4%
Race, ethnicity, and origin ACS 2023
- Neighborhood character
- Predominantly White (95%)
- Race & ethnicity
- White 95% Two or more races 2% Hispanic / Latino 1%
- Common ancestry
- Lithuanian 1% Slovak 1% Iranian 1%
- Foreign-born
- 0%
- Languages at home
- 99% English-only · Other Asian/Pacific 1%
Political lean MEDSL · Linn
- 2024 margin
- Solid R (+64.6) · D 17.0% · R 81.6% · Other 1.4%
- 2008→2024 swing
- -28.6pp toward R · 2008: -36.0pp · 2024: -64.6pp
- All cycles
- 2024: R+64.6 2020: R+62.8 2016: R+62.1 2012: R+45.9 2008: R+36.0
Not yet ingested
- Civics
- —
Market trends
- HPI YoY
- ▲ 8.84%
- Current HPI
- 327.2567
- Rent YoY
- —
- Metro
- —
- State GDP YoY
- —
- F500 in state
- 0
Price history
+400.0% since first listed2 events — show timeline
- 2026-02-20 Listed $25,000 Heartland MLS as Distributed by MLS Grid
- 1986-08-01 Sold (Public Records) $5,000 Public Records
Cash-flow waterfall
monthlySold comps — $/sqft
last 12 mo · ≤1 miLoading sold comps…