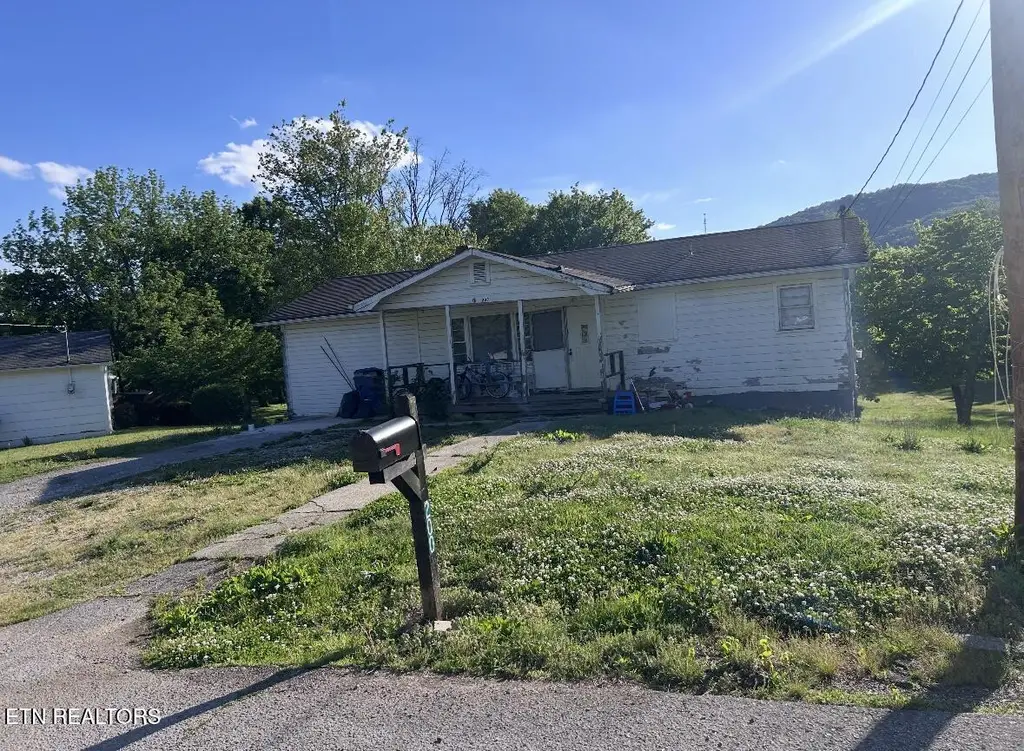
200 Mccarroll Ave · Harriman, TN
Flood risk 10/10 · Severe
- FEMA flood zone
- X (shaded)
- Chance of flooding over 30 yrs
- 0.99%
- Est. flood insurance / yr
- $473 – $860
Fire risk 4/10 · Minor
- Est. fire insurance / yr
- $949 – $1,763
Heat risk 6/10 · Moderate
- Hot days now (above 104°F)
- 8 days/yr
- Hot days in 30 yrs
- 21 days/yr
Wind risk 2/10 · Minimal
- Chance of severe wind over 30 yrs
- 4.0%
Air-quality risk 3/10 · Minor
- Unhealthy air days now
- 2 days/yr
- Unhealthy air days in 30 yrs
- 3 days/yr
Risk factors via First Street. Map © Google.
Why this score? — see what drove the C- grade
The composite is a weighted blend of 9 inputs, each scored 0–100. Each bar is that input's sub-score; the figure is the points it added to the 100-point composite (weight × sub-score).
- Cash flow +18.3/30.0
- ARV discount +14.1/15.0
- DSCR +5.7/10.0
- 1% rule +3.7/10.0
- Livability +2.9/5.0
- Rent growth +2.5/5.0
- Schools +2.5/10.0
- Condition / age +2.5/5.0
- Appreciation +0.0/10.0
$159,000
🖨 Deal sheet 📄 Offer letter ✓ Due diligence
Listing remarks
Great investment opportunity with a tenant and professional property management already in place. Recently refreshed with new flooring in the living room and bedrooms, plus some nice bathroom updates. This property has strong rental potential and could meet typical DSCR lending guidelines (buyer to confirm). Motivated seller offering an HVAC credit at closing, and open to owner financing or flexible terms. Owner/Agent.
Key facts
- 0.45 acre lot
- Built 1950
- Listed 41 days
Property features AI
Exterior
- Parking: Off-street parking
- Utilities: Public sewer
- Home design: Not attached to another unit
- Construction: Block construction
- Exterior features: Level lot
Interior
- Kitchen: Refrigerator
- Flooring: Carpet; Hardwood
- Bathrooms: 1 full bathroom
- Heating & cooling: Natural gas heating; Space heater; Window air conditioning unit(s)
- Interior features: 6 total rooms; Unfinished basement
Neighborhood map
What this means for you Summary
Snapshot
- This is a 3-bed/1.0-bath single-family listed at $159k.
Deal economics
- At list price, monthly cash flow is $90 ($1k/yr) — positive.
- The deal already cash-flows at list — no discount required.
- To meet the 1% rule (rent ≥ 1% of price), the offer needs to be $138k (12.9% below list).
- Recommended offer: $138k (12.9% below list) — sets the bar for 1% rule.
- Cap rate 7.4% vs local median 3.1% in Harriman — top-decile yield for the area; either an underpriced asset or a hidden risk that comps aren't pricing in. Stress-test before assuming the spread holds.
Location & tenants
- Location reads 57/100 on livability (#330 in TN) — a working-class tenant base; expect higher turnover. Strengths: cost of living A+, housing A+; Watch: schools F, crime F, amenities F.
- Roane County (town): math 30% / reading 29% proficiency, ranked #64 of 139 in TN (top 46%) — low school quality limits family demand, transient renter base, plan for 1-2y turnover.
- Market conditions: 211 active listings in the ZIP; 229 units permitted in Roane County in 2024 (0 in 5+ unit buildings).
Forward outlook
- Local home prices are declining (-3.0%/yr); year-one equity from $1k of loan paydown is wiped out by about $5k of value loss. Plan a longer hold.
- Roane County population projected at -21% by 2050 — secular population decline; favor cash flow + early exit over multi-decade hold.
Negotiation context
- It's been on market 41 days — a 3% lower offer ($154k) is reasonable based on typical stale-listing flexibility.
- 4 sale attempts since 4y ago with the ask held roughly flat each time — persistent listings suggest the price (not the market) is what's stuck; bring a comps-based counter.
Risks & watch-outs
- Watch-outs: flood insurance adds $56/mo; built in 1950 — expect roof / HVAC / electrical / plumbing capex.
- Climate carrying-cost: severe flood risk; extreme-heat days projected 8→21/yr by 2055 (HVAC capex compounding) — expect insurance premiums to compound above CPI over the hold.
Questions for the listing agent
- It's been on market 41 days. Have you received any prior offers? Is the seller open to a 13% concession, seller financing, or rate buy-down credit?
- Built in 1950 — when were the roof, HVAC, electrical panel, plumbing, and water heater last replaced?
- What's the actual annual flood-insurance premium (NFIP or private), and is the property in a SFHA with mandatory coverage?
- Is there a deadline driving the sale (1031 exchange, divorce, estate, relocation)? That informs how much negotiation room exists.
- Schools are F-rated, which usually means shorter tenancies and higher turnover. Who's the typical renter profile here, and what's been the actual vacancy rate?
- Crime grade is F in this area — have there been break-ins, vandalism, or insurance claims at this property in the last 3 years? What carrier currently insures it and at what premium?
- What's the average days-on-market for RENTAL listings here right now (not sales)? A rising rental-DOM trend means longer vacancies and softer asking-rent achievability than the comps imply.
- What's the recent tenant-quality profile in this submarket — average credit score on applications, eviction rate, late-payment / NSF rate, and stable-employment percentage? A property-management company in the area should have these aggregated.
- How much new for-sale + rental construction is in the pipeline within 1–3 miles? Heavy new supply typically softens prices + rents 12–24 months out; constrained supply supports both.
Investment metrics
- 1% rule
- 0.87% ✗
- Cap rate
- 7.39%
- Cash-on-cash
- 3.93%
- DSCR
- 1.17
- GRM
- 9.6
CMA / ARV
- ARV (median comp)
- $186,541
- List price
- $159,000
- Delta
- -14.76%
- Verdict
- UNDERPRICED
- Comps
- 20 within 1.0 mi
Show comp detail 11 sales within ~0.75 mi
| Address | Dist | Beds/Ba | Sqft | Sold | Price | $/sf | Match |
|---|---|---|---|---|---|---|---|
| 215 Vann Dr | 0.23mi | 3/2.0 | 1,081 (+2%) | 11mo | $255,000 | $236 | 72 |
| 239 Morning Dr | 0.22mi | 2/1.0 (-1) | 1,035 (-2%) | 19mo | $110,000 | $106 | 66 |
| 404 Evergreen St | 0.08mi | 2/2.0 (-1) | 1,128 (+7%) | 14mo | $240,000 | $213 | 64 |
| 218 Lee Vlg | 0.46mi | 3/1.0 | 1,172 (+11%) | 2mo | $170,000 | $145 | 58 |
| 125 Howard Ave | 0.15mi | 3/1.0 | 1,200 (+14%) | 15mo | $220,000 | $183 | 58 |
| 210 Ford Ave | 0.57mi | 3/1.0 | 1,005 (-5%) | 16mo | $125,000 | $124 | 52 |
| 110 Aspen Dr | 0.39mi | 3/1.5 | 1,200 (+14%) | 11mo | $227,900 | $190 | 48 |
| 104 Coffey Ln | 0.58mi | 2/1.0 (-1) | 999 (-5%) | 20mo | $210,000 | $210 | 42 |
| 510 Sheldon Dr | 0.63mi | 3/1.0 | 936 (-11%) | 12mo | $227,000 | $243 | 42 |
| 423 Maple St | 0.69mi | 2/1.0 (-1) | 1,128 (+7%) | 18mo | $180,000 | $160 | 36 |
| 229 Hannah Rd | 0.53mi | 2/1.0 (-1) | 952 (-10%) | 22mo | $192,000 | $202 | 36 |
Match score weights: distance 35% · size 25% · config 20% · recency 20%. Top-matched comps best support the ARV.
Projected returns pro-forma
-3.0% appreciation · 3.0% rent growth · sell at horizon
- IRR
- -12.5%
- Equity multiple
- 0.55×
- Total profit
- $-20,056
- Equity at exit
- $23,707
- IRR
- -3.4%
- Equity multiple
- 0.77×
- Total profit
- $-10,217
- Equity at exit
- $13,747
Cash invested: $44,520 (down + closing). Projections, not guarantees.
Landlord ↔ Tenant lean methodology
- Overall (STATE)
- 87 Strongly Landlord-Friendly
- State Tennessee
- 87 Strongly Landlord-Friendly · R+13
- County
- — inherits STATE
- City
- — inherits STATE
ZIP-level market 37748
- Home prices YoY
- -11.5%
- Active inventory
- 211
- Price-to-rent
- 9.6×
Monthly cashflow live
- Estimated rent
- $1,385 medium interval (Pro) →
- Mortgage (P&I)
- −$834
- Tax from tax record
- −$48 /mo · $576/yr
- Insurance
- −$66
- Flood insurance flood zone
- −$56 /mo · $666/yr
- HOA
- −$0
- Vacancy / Maint / Mgmt
- −$291
- Net cashflow
- $90
Break-even live
UW: 25.0% down · 7.5% · 30yr · 1.5% tax · 5.0% vac · 8.0% maint · 8.0% mgmt
Financing live
Cash to close
- Down payment
- $39,750
- Closing costs
- $4,770
- Reserves months
- —
- Total cash needed
- —
Loan-product check · same deal, 3 products live
Conventional
25% down · 7.5% · 30yr
- Down + closing
- —
- Monthly P&I
- —
- Monthly cashflow
- —
- DSCR
- —
- Eligible?
- —
Personal DTI + credit; lowest rate.
DSCR
20% down · 8.5% · 30yr
- Down + closing
- —
- Monthly P&I
- —
- Monthly cashflow
- —
- DSCR
- —
- Eligible?
- —
No personal income docs; deal must DSCR.
Hard money
10% down · 12.0% · 12mo
- Down + closing
- —
- Monthly P&I
- —
- Monthly cashflow
- —
- DSCR
- —
- Eligible?
- —
Short-term bridge; refi at stabilization.
Listing history 28 events
-
2026-06-18days on market $159,000 Active 41 DOM
-
2026-06-17days on market $159,000 Active 40 DOM
-
2026-06-16days on market $159,000 Active 39 DOM
-
2026-06-15days on market $159,000 Active 38 DOM
-
2026-06-14days on market $159,000 Active 36 DOM
-
2026-06-13days on market $159,000 Active 35 DOM
-
2026-06-10days on market $159,000 Active 33 DOM
-
2026-06-09days on market $159,000 Active 32 DOM
-
2026-06-08days on market $159,000 Active 31 DOM
-
2026-06-07remarks 422-char remark
-
2026-06-07days on market $159,000 Active 30 DOM
-
2026-06-03days on market $159,000 Active 26 DOM
-
2026-06-02days on market $159,000 Active 25 DOM
-
2026-06-01days on market $159,000 Active 24 DOM
-
2026-05-31days on market $159,000 Active 23 DOM
-
2026-05-31days on market $159,000 Active 22 DOM
-
2026-05-08$159,000 Active 414-char remark
-
2026-01-21$140,000
-
2026-01-21historical
-
2026-01-21historical
-
2025-12-16price $140,000
-
2025-12-06price $151,500
-
2025-11-22$154,000 Active
-
2022-11-14soldstatus $350,000
-
2022-10-31soldstatus $43,750 Closed
-
2022-10-31soldstatus $43,750
-
2022-09-17status Pending
-
2022-09-17$44,989 Active
ⓘ Source: listings_history table (triggers on properties + properties_extension) + one-shot
backfill from property_details.listing_events for pre-trigger history.
Tax reassessment forecast TN · Resets to sale price
- Current annual tax
- $576 · $48/mo
- Projected year-2 tax
- $1,129 · $94/mo
- Expected delta
- +$553/yr (+$46/mo · 96.0%)
ⓘ Screening estimate from a state-policy table — verify with the county assessor before closing.
Climate risk First Street
- Flood 10/10 Extreme FEMA zone X (shaded) · 99% chance over 30 yrs
- Wildfire 4/10 Moderate
- Heat 6/10 Major 8 d/yr ≥104°F today · 21 d/yr by 30 yrs out
- Wind 2/10 Low 4% chance of damaging wind over 30 yrs
- Air quality 3/10 Moderate 2 unhealthy d/yr today · 3 by 30 yrs out
Nearby sold comps map
Loading sold comps map…
Walkable amenities ~0.75 mi
Loading nearby amenities…
Taxation est. · year 1
- Rental income
- $16,615
- − Mortgage interest
- −$8,906
- − Property taxes
- −$576
- − Insurance
- −$1,462
- − Repairs & maintenance
- −$1,329
- − Management
- −$1,329
- − Depreciation
- −$4,625
- Taxable loss
- −$1,613
- Est. tax savings @ 24.0%
- +$387
- After-tax cash flow
- $1,470/yr
For passive investors: Depreciation is non-cash, so a rental often shows a tax loss while cash-flowing — sheltering income. Rental losses are passive: they offset passive income freely, and up to $25,000/yr can offset ordinary (W-2) income if you actively participate and your MAGI is under $100k (phasing out to $0 by $150k); unused losses carry forward. On sale, claimed depreciation is recaptured at up to 25%, and gains may owe capital-gains tax (a 1031 exchange can defer both). Figures are a year-1 estimate at your 24.0% rate — not tax advice; consult a CPA.
Schools (NCES district)
- District
- Roane County
- NCES district ID
- 4703590
- Math proficiency
- 30% ▼ -10.00%
- Reading proficiency
- 29% ▼ -7.00%
- Median HH income
- $41,611
- Composite
- 25.0/100
- National rank
- #7557
- State rank
- #64 of 139 in TN
Livability — Harriman
- Score
- 57/100
- State rank
- #330
- US rank
- #21927
Category grades
Schools grade is shown separately in the Schools card above.
Census & demographics
- Census place
- Harriman, TN
- City population
- 17,021
- Population (ZIP)
- 17,021
Population outlook (Roane County) Hauer SSP2
- Today (2025)
- 49,652 people
- By 2030
- 47,648 · -4.0%
- By 2040
- 43,306 · -12.8%
- By 2050
- 39,294 · -20.9%
- By 2075
- 32,318 · -34.9%
- By 2100
- 27,137 · -45.3%
Race, ethnicity, and origin ACS 2023
- Neighborhood character
- Predominantly White (90%)
- Race & ethnicity
- White 90% Two or more races 5% Black 4% Hispanic / Latino 2%
- Common ancestry
- Serbian 3% Slovak 2% Lithuanian 1%
- Foreign-born
- 1%
- Languages at home
- 99% English-only · Spanish 1%
Political lean MEDSL · Roane
- 2024 margin
- Solid R (+54.5) · D 22.1% · R 76.7% · Other 1.2%
- 2008→2024 swing
- -18.3pp toward R · 2008: -36.2pp · 2024: -54.5pp
- All cycles
- 2024: R+54.5 2020: R+50.9 2016: R+51.1 2012: R+41.3 2008: R+36.2
Not yet ingested
- Civics
- —
Market trends
- HPI YoY
- ▼ -39.78%
- Current HPI
- 305.724
- Rent YoY
- —
- Metro
- —
- State GDP YoY
- ▲ 2.78%
- F500 in state
- 22
Industry mix (Fortune 500 HQ in TN)
| Industry | F500 HQs | Revenue |
|---|---|---|
| Healthcare | 3 | $91B |
|
||
| Retail | 3 | $72B |
|
||
| Transportation / Logistics | 1 | $88B |
|
||
| Paper / Packaging | 1 | $19B |
|
||
| Insurance | 1 | $13B |
|
||
| Energy | 1 | $12B |
|
||
Price history
+253.4% since first listed12 events — show timeline
- 2026-05-08 Listed $159,000 Knoxville MLS
- 2026-01-21 Listed $140,000 REALTRACS as Distributed by MLS Grid
- 2026-01-21 Listing Removed — Knoxville MLS
- 2026-01-21 Listing Removed — REALTRACS as Distributed by MLS Grid
- 2025-12-16 Price Changed $140,000 Knoxville MLS
- 2025-12-06 Price Changed $151,500 Knoxville MLS
- 2025-11-22 Listed $154,000 Knoxville MLS
- 2022-11-14 Sold (Public Records) $350,000 Public Records
- 2022-10-31 Sold (MLS) $43,750 REALTRACS as Distributed by MLS Grid
- 2022-10-31 Sold (MLS) $43,750 Knoxville MLS
- 2022-09-17 Pending — Knoxville MLS
- 2022-09-17 Listed $44,989 Knoxville MLS
Property tax history
+4.4%/yrLatest (2025): $576 · +33.3% YoY. Source: county tax records.
Cash-flow waterfall
monthlySold comps — $/sqft
last 12 mo · ≤1 miLoading sold comps…