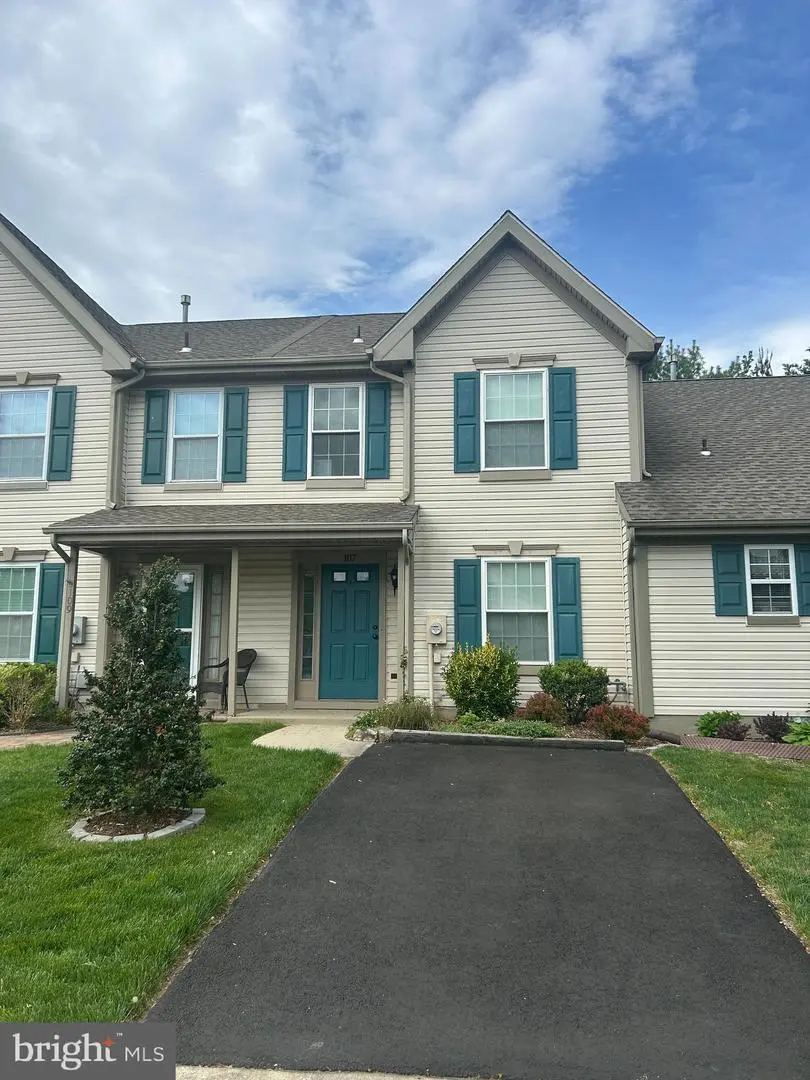
107 Tartan Ln · Moorestown-Lenola, NJ
Flood risk 1/10 · Minimal
- FEMA flood zone
- X (unshaded)
- Chance of flooding over 30 yrs
- 0.0%
- Est. flood insurance / yr
- $507 – $1,088
Fire risk 2/10 · Minimal
- Est. fire insurance / yr
- $526 – $976
Heat risk 6/10 · Moderate
- Hot days now (above 105°F)
- 7 days/yr
- Hot days in 30 yrs
- 15 days/yr
Wind risk 6/10 · Moderate
- Chance of severe wind over 30 yrs
- 56.0%
Air-quality risk 4/10 · Minor
- Unhealthy air days now
- 5 days/yr
- Unhealthy air days in 30 yrs
- 7 days/yr
Risk factors via First Street. Map © Google.
Why this score? — see what drove the B grade
The composite is a weighted blend of 9 inputs, each scored 0–100. Each bar is that input's sub-score; the figure is the points it added to the 100-point composite (weight × sub-score).
- Cash flow +30.0/30.0
- 1% rule +10.0/10.0
- DSCR +10.0/10.0
- ARV discount +7.5/15.0
- Appreciation +4.3/10.0
- Schools +3.8/10.0
- Rent growth +2.5/5.0
- Livability +2.5/5.0
- Condition / age +2.5/5.0
$105,109
🖨 Deal sheet 📄 Offer letter ✓ Due diligence
Listing remarks
Property back on market due to buyer’s circumstances. Welcome to this beautiful 55+ affordable housing condo in the Glen at Mason's Creek! The move-in ready property features an eat-in kitchen , master bedroom with his & her closets, upstairs laundry room with full size washer & dryer, outdoor patio and storage closet. Clubhouse amenities include a fitness center, library, and a billiards table. In order to be eligible for this affordable housing unit, you have to meet certain income limits as determined by the New Jersey Council on Affordable Housing of New Jersey. This is not an investment property and cannot be used as a rental property. All showings/open houses are ap
Key facts
- Fitness center
- Storage closet
- Eat-in kitchen
Tags
Neighborhood map
What this means for you Summary
Snapshot
- This is a 2-bed/1.5-bath townhouse listed at $105k.
Deal economics
- At list price, monthly cash flow is $842 ($10k/yr) — positive.
- The deal already cash-flows at list — no discount required.
- Meets the 1% rule at list price ($2k rent vs $105k).
- Cap rate 15.9% vs local median 3.0% in Moorestown-Lenola — top-decile yield for the area; either an underpriced asset or a hidden risk that comps aren't pricing in. Stress-test before assuming the spread holds.
Location & tenants
- Location reads: area grade B — affects rentability + tenant quality, not the cash-flow math above.
- Hainesport Township School District (suburban): math 27% / reading 53% proficiency, ranked #205 of 472 in NJ (top 43%) — families likely to look elsewhere, expect single-tenant / working-renter base with shorter leases; only 10% free/reduced lunch — higher-income household profile.
- Market conditions: 33 active listings in the ZIP; 14 comparable units currently listed for rent nearby; rentals leasing fast (median 1d on market — plan ~1-2 weeks tenant-placement turnaround); 2,161 units permitted in Burlington County in 2024 (988 in 5+ unit buildings).
Forward outlook
- Local home prices are declining (-1.4%/yr); year-one equity from $727 of loan paydown is wiped out by about $1k of value loss. Plan a longer hold.
- Burlington County population projected to shrink 5% by 2050 — rents likely to lag national; underwrite the cash flow, not the appreciation.
- At projected returns (-1.4% appreciation + 3.0% rent growth), your $29k cash investment doubles in ~3 years — after that, you're playing with house money.
Negotiation context
- Only 1 days on market — expect competitive offers; lowballing is unlikely to land.
- 4 sale attempts with the ask held roughly flat each time — persistent listings suggest the price (not the market) is what's stuck; bring a comps-based counter.
- Current owner paid $32; list at $105k implies a 328366% gain — meaningful room to come down on a strong offer.
Risks & watch-outs
- Climate carrying-cost: major wind risk, 56% chance of damaging wind over 30y; extreme-heat days projected 7→15/yr by 2055 (HVAC capex compounding) — expect insurance premiums to compound above CPI over the hold.
Questions for the listing agent
- What does the HOA fee cover, when was the last increase, and are there any pending special assessments or reserve-fund shortfalls?
- Is there a deadline driving the sale (1031 exchange, divorce, estate, relocation)? That informs how much negotiation room exists.
- What's the average days-on-market for RENTAL listings here right now (not sales)? A rising rental-DOM trend means longer vacancies and softer asking-rent achievability than the comps imply.
- What's the recent tenant-quality profile in this submarket — average credit score on applications, eviction rate, late-payment / NSF rate, and stable-employment percentage? A property-management company in the area should have these aggregated.
- How much new for-sale + rental construction is in the pipeline within 1–3 miles? Heavy new supply typically softens prices + rents 12–24 months out; constrained supply supports both.
Investment metrics
- 1% rule
- 2.12% ✓
- Cap rate
- 15.91%
- Cash-on-cash
- 34.34%
- DSCR
- 2.53
- GRM
- 3.9
CMA / ARV
- ARV (on-the-fly)
- $287,370
- Comps found
- 7
Show comp detail 7 sales within ~0.75 mi
| Address | Dist | Beds/Ba | Sqft | Sold | Price | $/sf | Match |
|---|---|---|---|---|---|---|---|
| 807 Trescott Pl | 0.37mi | 2/1.5 | 1,071 (+4%) | 10mo | $299,000 | $279 | 68 |
| 1401-A Yarmouth Pl | 0.33mi | 2/1.0 | 1,008 (-2%) | 15mo | $262,000 | $260 | 67 |
| 3901-A Fenwick Ln | 0.49mi | 2/2.0 | 1,008 (-2%) | 12mo | $308,000 | $306 | 62 |
| 2605-A Yarmouth Ln | 0.35mi | 2/1.0 | 920 (-11%) | 5mo | $250,000 | $272 | 60 |
| 2005A Sutton Pl | 0.46mi | 2/1.0 | 970 (-6%) | 10mo | $271,350 | $280 | 58 |
| 1207-A Yarmouth Ln | 0.32mi | 2/1.0 | 920 (-11%) | 13mo | $245,000 | $266 | 55 |
| 2305A Yarmouth Ln | 0.41mi | 2/1.0 | 920 (-11%) | 12mo | $275,000 | $299 | 52 |
Match score weights: distance 35% · size 25% · config 20% · recency 20%. Top-matched comps best support the ARV.
Projected returns pro-forma
-1.36% appreciation · 3.0% rent growth · sell at horizon
- IRR
- 32.8%
- Equity multiple
- 2.50×
- Total profit
- $44,191
- Equity at exit
- $23,577
- IRR
- 37.9%
- Equity multiple
- 4.91×
- Total profit
- $115,024
- Equity at exit
- $23,258
Cash invested: $29,431 (down + closing). Projections, not guarantees.
Landlord ↔ Tenant lean methodology
- Overall (STATE)
- 21 Tenant-Leaning
- State New Jersey
- 21 Tenant-Leaning · D+6
- County
- — inherits STATE
- City
- — inherits STATE
ZIP-level market 08036
- Home prices YoY
- -0.5%
- Active inventory
- 33
- Price-to-rent
- 3.9×
Monthly cashflow live
- Estimated rent
- $2,233 high interval (Pro) →
- Mortgage (P&I)
- −$551
- Tax from tax record
- −$181 /mo · $2,173/yr
- Insurance
- −$44
- HOA
- −$146
- Vacancy / Maint / Mgmt
- −$469
- Net cashflow
- $842
Break-even live
UW: 25.0% down · 7.5% · 30yr · 1.5% tax · 5.0% vac · 8.0% maint · 8.0% mgmt
Financing live
Cash to close
- Down payment
- $26,277
- Closing costs
- $3,153
- Reserves months
- —
- Total cash needed
- —
Loan-product check · same deal, 3 products live
Conventional
25% down · 7.5% · 30yr
- Down + closing
- —
- Monthly P&I
- —
- Monthly cashflow
- —
- DSCR
- —
- Eligible?
- —
Personal DTI + credit; lowest rate.
DSCR
20% down · 8.5% · 30yr
- Down + closing
- —
- Monthly P&I
- —
- Monthly cashflow
- —
- DSCR
- —
- Eligible?
- —
No personal income docs; deal must DSCR.
Hard money
10% down · 12.0% · 12mo
- Down + closing
- —
- Monthly P&I
- —
- Monthly cashflow
- —
- DSCR
- —
- Eligible?
- —
Short-term bridge; refi at stabilization.
Rent comps 14 comps
| Address | Beds | Baths | Sqft | Rent | $/sqft | DOM | Units | Dist |
|---|---|---|---|---|---|---|---|---|
| 1 Haddon Blvd Mount Laurel, NJ | 1.0–2.0 | 1.0–2.0 | 1134 | $3,065 | $2.70 | 1d | 15 | 0.63mi |
| 123 Creek Rd Mount Laurel, NJ | 2.0–3.0 | 2.0 | 1195 | $2,185 | $1.83 | 1d | 4 | 0.71mi |
| 442A Thornwood Dr Mt Laurel Township, NJ | 2.0 | 2.0 | 1136 | $2,100 | $1.85 | 1d | 1 | 0.99mi |
| 5107A Adelaide Dr Mt Laurel Township, NJ | 2.0 | 1.0 | 880 | $2,000 | $2.27 | 1d | 1 | 1.03mi |
| 314B Willow Turn Unit B Mount Laurel, NJ | 2.0 | 1.0 | 1080 | $2,000 | $1.85 | 1d | 1 | 1.06mi |
| 318 Delancey Pl Unit A Mt Laurel Township, NJ | 2.0 | 1.0 | 960 | $2,150 | $2.24 | 22d | 1 | 1.10mi |
| 4208 Adelaide Dr Mt Laurel Township, NJ | 2.0 | 2.0 | 1184 | $2,000 | $1.69 | 4d | 1 | 1.12mi |
| 3815A Adelaide Dr Mt Laurel Township, NJ | 2.0 | 1.0 | 880 | $2,000 | $2.27 | 1d | 1 | 1.14mi |
| 350A Delancey Pl Unit A Mt Laurel Township, NJ | 2.0 | 1.0 | 928 | $1,850 | $1.99 | 19d | 1 | 1.16mi |
| 406A Willow Turn Unit A Mt Laurel Township, NJ | 2.0 | 2.0 | 990 | $2,100 | $2.12 | 1d | 1 | 1.27mi |
| 416 Magnolia Rd Mount Laurel, NJ | 3.0 | 1.0 | 936 | $2,000 | $2.14 | 24d | 1 | 1.29mi |
| 1 Larchmont Pl Mount Laurel, NJ | 1.0–2.0 | 1.0–2.0 | 887 | $2,681 | $3.02 | 1d | 13 | 1.38mi |
| 522A Willow Turn Mt Laurel Township, NJ | 2.0 | 2.0 | 1136 | $2,100 | $1.85 | 1d | 1 | 1.40mi |
| 104 Willow Turn Unit B Mt Laurel Township, NJ | 3.0 | 2.0 | 1000 | $2,500 | $2.50 | 18d | 1 | 1.40mi |
HOA detail
- Monthly dues
- $146 · $1,752/yr
- Likely covers
- gym
Listing history 10 events
-
2026-04-13status Pending
-
2026-04-12$105,109 Active
-
2026-01-27historical
-
2025-12-06status Active
-
2025-08-17historical Active Under Contract
-
2025-08-17status Active
-
2025-06-11historical
-
2025-06-02price $105,109
-
2025-05-31$105,000 Active
-
2001-02-22soldstatus $32
ⓘ Source: listings_history table (triggers on properties + properties_extension) + one-shot
backfill from property_details.listing_events for pre-trigger history.
Tax reassessment forecast NJ · Partial reset (capped growth)
- Current annual tax
- $2,173 · $181/mo
- Projected year-2 tax
- $2,395 · $200/mo
- Expected delta
- +$222/yr (+$19/mo · 10.2%)
ⓘ Screening estimate from a state-policy table — verify with the county assessor before closing.
Climate risk First Street
- Flood 1/10 Low FEMA zone X (unshaded) · 0% chance over 30 yrs
- Wildfire 2/10 Low
- Heat 6/10 Major 7 d/yr ≥105°F today · 15 d/yr by 30 yrs out
- Wind 6/10 Major 56% chance of damaging wind over 30 yrs
- Air quality 4/10 Moderate 5 unhealthy d/yr today · 7 by 30 yrs out
Nearby sold comps map
Loading sold comps map…
Walkable amenities ~0.75 mi
Loading nearby amenities…
Taxation est. · year 1
- Rental income
- $26,798
- − Mortgage interest
- −$5,888
- − Property taxes
- −$2,173
- − Insurance
- −$526
- − Repairs & maintenance
- −$2,144
- − Management
- −$2,144
- − HOA
- −$1,752
- − Depreciation
- −$3,058
- Taxable income
- $9,115
- Est. tax owed @ 24.0%
- −$2,188
- After-tax cash flow
- $7,918/yr
For passive investors: Depreciation is non-cash, so a rental often shows a tax loss while cash-flowing — sheltering income. Rental losses are passive: they offset passive income freely, and up to $25,000/yr can offset ordinary (W-2) income if you actively participate and your MAGI is under $100k (phasing out to $0 by $150k); unused losses carry forward. On sale, claimed depreciation is recaptured at up to 25%, and gains may owe capital-gains tax (a 1031 exchange can defer both). Figures are a year-1 estimate at your 24.0% rate — not tax advice; consult a CPA.
Schools (NCES district)
- District
- Hainesport Township School District
- NCES district ID
- 3406420
- Math proficiency
- 27% ▼ -29.00%
- Reading proficiency
- 53% ▼ -12.00%
- Median HH income
- $88,435
- Composite
- 38.07/100
- National rank
- #4283
- State rank
- #205 of 472 in NJ
Livability — Moorestown-Lenola
No livability data for this city. (Only ~50 U.S. cities are tracked.)
Census & demographics
- City population
- 20,990
- Population (ZIP)
- 6,028
Population outlook (Burlington County) Hauer SSP2
- Today (2025)
- 453,425 people
- By 2030
- 452,359 · -0.2%
- By 2040
- 445,033 · -1.9%
- By 2050
- 431,760 · -4.8%
- By 2075
- 406,277 · -10.4%
- By 2100
- 364,732 · -19.6%
Race, ethnicity, and origin ACS 2023
- Neighborhood character
- Predominantly White (69%)
- Race & ethnicity
- White 69% Hispanic / Latino 11% Two or more races 7% Asian 7% Black 6%
- Hispanic origin (detail)
- Puerto Rican 6% Cuban 1%
- Common ancestry
- Romanian 5% Scotch-Irish 2% Italian 1%
- Foreign-born
- 7% · Canada, South Korea, Guatemala
- Languages at home
- 88% English-only · Spanish 6% Other Indo-European 2% Tagalog/Filipino 1%
Political lean MEDSL · Burlington
- 2024 margin
- D (+16.6) · D 57.6% · R 41.0% · Other 1.3%
- 2008→2024 swing
- -2.0pp toward R · 2008: 18.6pp · 2024: 16.6pp
- All cycles
- 2024: D+16.6 2020: D+19.5 2016: D+14.8 2012: D+18.7 2008: D+18.6
Not yet ingested
- Civics
- —
Market trends
- HPI YoY
- ▼ -1.36%
- Current HPI
- 302.0676
- Rent YoY
- —
- Metro
- —
- State GDP YoY
- ▲ 2.05%
- F500 in state
- 34
Industry mix (Fortune 500 HQ in NJ)
| Industry | F500 HQs | Revenue |
|---|---|---|
| Consumer Goods | 3 | $31B |
|
||
| Pharmaceuticals | 2 | $153B |
|
||
| Technology | 2 | $21B |
|
||
| Insurance | 2 | $20B |
|
||
| Healthcare | 2 | $19B |
|
||
| Financial Services | 1 | $70B |
|
||
Price history
+0.1% since first listed10 events — show timeline
- 2026-04-13 Pending — BRIGHT MLS
- 2026-04-12 Listed $105,109 BRIGHT MLS
- 2026-01-27 Listing Removed — BRIGHT MLS
- 2025-12-06 Relisted — BRIGHT MLS
- 2025-08-17 Contingent — BRIGHT MLS
- 2025-08-17 Relisted — BRIGHT MLS
- 2025-06-11 Listing Removed — BRIGHT MLS
- 2025-06-02 Price Changed $105,109 BRIGHT MLS
- 2025-05-31 Listed $105,000 BRIGHT MLS
- 2001-02-22 Sold (Public Records) $32 Public Records
Property tax history
+2.7%/yrLatest (2025): $2,173 · +10.6% YoY. Source: county tax records.
Cash-flow waterfall
monthlySold comps — $/sqft
last 12 mo · ≤1 miLoading sold comps…