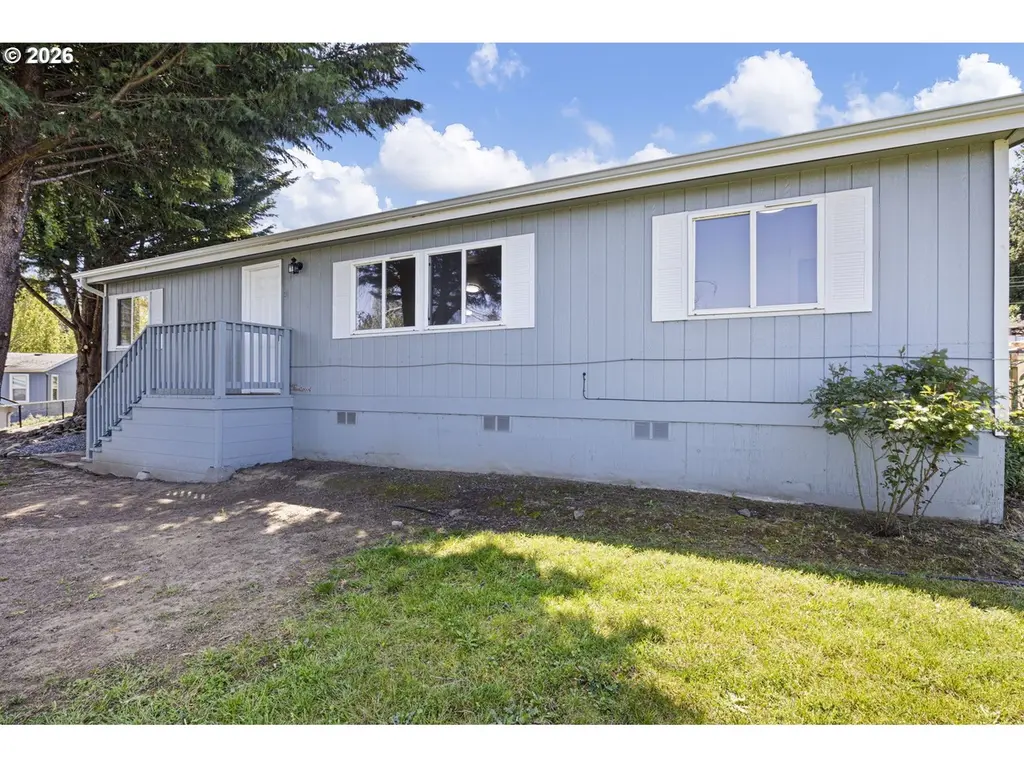
2600 NE 205th Ave #31 · Fairview, OR
Flood risk 1/10 · Minimal
- FEMA flood zone
- X (unshaded)
- Chance of flooding over 30 yrs
- 0.0%
- Est. flood insurance / yr
- $507 – $1,088
Fire risk 1/10 · Minimal
- Est. fire insurance / yr
- $498 – $926
Heat risk 3/10 · Minor
- Hot days now (above 93°F)
- 7 days/yr
- Hot days in 30 yrs
- 15 days/yr
Wind risk 1/10 · Minimal
- Chance of severe wind over 30 yrs
- —
Air-quality risk 10/10 · Severe
- Unhealthy air days now
- 23 days/yr
- Unhealthy air days in 30 yrs
- 27 days/yr
Risk factors via First Street. Map © Google.
Why this score? — see what drove the B- grade
The composite is a weighted blend of 9 inputs, each scored 0–100. Each bar is that input's sub-score; the figure is the points it added to the 100-point composite (weight × sub-score).
- Cash flow +30.0/30.0
- DSCR +10.0/10.0
- 1% rule +7.5/10.0
- ARV discount +7.5/15.0
- Livability +3.8/5.0
- Schools +2.7/10.0
- Condition / age +2.5/5.0
- Rent growth +2.3/5.0
- Appreciation +0.0/10.0
$135,000
🖨 Deal sheet (PDF) 📄 Offer letter ✓ Due diligence
Listing remarks MLS
Clean home and property, but in need of many repairs. View of Camas hills from LR and back yard. Lg Fenced, private yard. Private, gated lot. Wheel chair accessible entry ramp. 2nd BA unfinished and needs your custom finishing. Great room floor plan. Cash only. Please respect owner's privacy and do not pull in and park in carport or neighbors carport or walk property without an agent during a scheduled showing.
Key facts
- Cul-de-sac street
- New flooring
- New gutters
Tags
Property features AI
Finance
- Other: Property is a resale; Main level area approximately 1,100 (assessor)
- Financial info: Monthly lot rent ($1,000)
- HOA & community: Community management provided; Located in a senior community (Silent Creek)
Exterior
- Parking: Carport; Driveway
- Utilities: Electric hot water and electric fuel; Public water; Public sewer
- Home design: Manufactured home located in a park (Fleetwood); Single-level; Mountain views
- Construction: Built in 1996; Pillar/post/pier foundation with skirting
- Exterior features: Fenced yard; Plywood exterior description; Composition roof; Lot on a cul-de-sac and level terrain; Paved road access
Interior
- Kitchen: Dishwasher; Microwave; Free-standing range; Free-standing refrigerator; Solid surface countertops; Stainless steel appliances
- Bedrooms: Primary bedroom on the main level with ensuite bath and walk-in closet; Second bedroom on the main level with closet
- Flooring: Vinyl flooring; Luxury vinyl plank
- Bathrooms: Two full bathrooms (both on the main level)
- Heating & cooling: Forced-air heating; No central cooling
- Interior features: Main-floor living with minimal steps and accessibility features; Laundry area with washer/dryer hookups; Luxury vinyl plank flooring throughout; Double-pane windows with vinyl frames; Crawl space basement
- Laundry & utility: Washer and dryer included / laundry area
Neighborhood map
What this means for you Summary
Snapshot
- This is a 2-bed/2.0-bath manufactured listed at $135k.
Deal economics
- At list price, monthly cash flow is $537 ($6k/yr) — positive.
- The deal already cash-flows at list — no discount required.
- Meets the 1% rule at list price ($2k rent vs $135k).
- Recommended offer: $131k (3.0% below list) — sets the bar for market timing.
- Cap rate 11.1% vs local median 2.8% in Fairview — top-decile yield for the area; either an underpriced asset or a hidden risk that comps aren't pricing in. Stress-test before assuming the spread holds.
Location & tenants
- Location reads 75/100 on livability (#85 in OR, #4,103 nationally) — a middle-class / working-renter tenant base. Strengths: commute A+, housing A+, health & safety A-; Watch: cost of living D, amenities F.
- Reynolds SD 7 (suburban): math 21% / reading 36% proficiency, ranked #162 of 183 in OR (top 88%) — low school quality limits family demand, transient renter base, plan for 1-2y turnover; 66% free/reduced lunch — lower-income household profile, screen leases tightly.
- Zoned schools: Salish Ponds Elementary School (314 students, 99% FRL); Reynolds Middle School (837 students, 98% FRL); Reynolds High School (2,474 students, 67% FRL) — zoned schools average 88% FRL vs 66% district-wide (22 pts higher); higher-poverty schools than district average — tighter screening recommended.
- Market conditions: Rents soft (-1.0%/yr); 54 active listings in the ZIP; 40 comparable units currently listed for rent nearby; rentals at typical pace (median 24d on market — plan ~3-4 weeks tenant-placement turnaround); 2,041 units permitted in Multnomah County in 2024 (905 in 5+ unit buildings).
Forward outlook
- Local home prices are declining (-3.0%/yr); year-one equity from $933 of loan paydown is wiped out by about $4k of value loss. Plan a longer hold.
- Multnomah County population projected at +33% by 2050 — long-run rental-demand tailwind backs the buy-and-hold thesis.
- At projected returns (-3.0% appreciation + 0.0% rent growth), your $38k cash investment doubles in ~10 years — after that, you're playing with house money.
Negotiation context
- It's been on market 45 days — a 3% lower offer ($131k) is reasonable based on typical stale-listing flexibility.
- 3 sale attempts since 8y ago with the ask held roughly flat each time — persistent listings suggest the price (not the market) is what's stuck; bring a comps-based counter.
- Current owner paid $42k; list at $135k implies a 221% gain — meaningful room to come down on a strong offer.
Questions for the listing agent
- It's been on market 45 days. Have you received any prior offers? Is the seller open to a 3% concession, seller financing, or rate buy-down credit?
- Is there a deadline driving the sale (1031 exchange, divorce, estate, relocation)? That informs how much negotiation room exists.
- Schools are F-rated, which usually means shorter tenancies and higher turnover. Who's the typical renter profile here, and what's been the actual vacancy rate?
- What's the average days-on-market for RENTAL listings here right now (not sales)? A rising rental-DOM trend means longer vacancies and softer asking-rent achievability than the comps imply.
- What's the recent tenant-quality profile in this submarket — average credit score on applications, eviction rate, late-payment / NSF rate, and stable-employment percentage? A property-management company in the area should have these aggregated.
- How much new for-sale + rental construction is in the pipeline within 1–3 miles? Heavy new supply typically softens prices + rents 12–24 months out; constrained supply supports both.
Investment metrics
- 1% rule
- 1.25% ✓
- Cap rate
- 11.06%
- Cash-on-cash
- 17.03%
- DSCR
- 1.76
- GRM
- 6.7
CMA / ARV
- ARV (median comp)
- $81,033
- List price
- $135,000
- Delta
- 66.60%
- Verdict
- OVERPRICED
- Comps
- 10 within 1.0 mi
Show comp detail 9 sales within ~0.75 mi
| Address | Dist | Beds/Ba | Sqft | Sold | Price | $/sf | Match |
|---|---|---|---|---|---|---|---|
| 20140 NE Sandy Blvd #103 | 0.12mi | 3/2.0 (+1) | 1,100 (0%) | 3mo | $100,000 | $91 | 87 |
| 21100 NE Sandy Blvd #76 | 0.40mi | 2/2.0 | 1,120 (+2%) | 5mo | $67,900 | $61 | 74 |
| 21100 NE Sandy Blvd #72 | 0.34mi | 3/2.0 (+1) | 1,104 (+0%) | 8mo | $109,000 | $99 | 72 |
| 21100 NE Sandy Blvd #39 | 0.35mi | 2/2.0 | 1,224 (+11%) | 2mo | $75,000 | $61 | 63 |
| 21100 NE Sandy Blvd #77 | 0.40mi | 2/2.0 | 1,010 (-8%) | 10mo | $86,200 | $85 | 59 |
| 21100 NE Sandy Blvd #2 | 0.28mi | 2/2.0 | 1,236 (+12%) | 10mo | $49,000 | $40 | 58 |
| 2500 NE 201st Ave #47 | 0.15mi | 2/1.0 | 1,001 (-9%) | 21mo | $65,000 | $65 | 56 |
| 2500 NE 201st Ave | 0.19mi | 2/1.0 | 1,001 (-9%) | 21mo | $65,000 | $65 | 54 |
| 21100 NE Sandy Blvd | 0.34mi | 2/2.0 | 1,248 (+14%) | 11mo | $90,000 | $72 | 53 |
Match score weights: distance 35% · size 25% · config 20% · recency 20%. Top-matched comps best support the ARV.
Projected returns pro-forma
-3.0% appreciation · 0.0% rent growth · sell at horizon
- IRR
- 5.1%
- Equity multiple
- 1.19×
- Total profit
- $7,305
- Equity at exit
- $20,129
- IRR
- 11.9%
- Equity multiple
- 1.82×
- Total profit
- $31,061
- Equity at exit
- $11,672
Cash invested: $37,800 (down + closing). Projections, not guarantees.
Landlord ↔ Tenant lean methodology
- Overall (STATE)
- 28 Tenant-Leaning
- State Oregon
- 28 Tenant-Leaning · D+6
- County
- — inherits STATE
- City
- — inherits STATE
ZIP-level market 97024
- Home prices YoY
- -20.3%
- Rents YoY
- -1.0%
- Active inventory
- 54
- Price-to-rent
- 6.7×
Monthly cashflow live
- Estimated rent
- $1,683 high interval (Pro) →
- Mortgage (P&I)
- −$708
- Tax from tax record
- −$28 /mo · $342/yr
- Insurance
- −$56
- HOA
- −$0
- Vacancy / Maint / Mgmt
- −$353
- Net cashflow
- $537
Break-even live
Sensitivity live
| Price | -10% $613 | -5% $575 | +0% $537 | +5% $498 | +10% $460 |
|---|---|---|---|---|---|
| Rent | -10% $404 | -5% $470 | +0% $537 | +5% $603 | +10% $669 |
| Rate | -1.0pp $605 | -0.5pp $571 | base $537 | +0.5pp $502 | +1.0pp $466 |
UW: 25.0% down · 7.5% · 30yr · 1.5% tax · 5.0% vac · 8.0% maint · 8.0% mgmt
Financing live
Cash to close
- Down payment
- $33,750
- Closing costs
- $4,050
- Reserves months
- —
- Total cash needed
- —
Loan-product check · same deal, 3 products live
Conventional
25% down · 7.5% · 30yr
- Down + closing
- —
- Monthly P&I
- —
- Monthly cashflow
- —
- DSCR
- —
- Eligible?
- —
Personal DTI + credit; lowest rate.
DSCR
20% down · 8.5% · 30yr
- Down + closing
- —
- Monthly P&I
- —
- Monthly cashflow
- —
- DSCR
- —
- Eligible?
- —
No personal income docs; deal must DSCR.
Hard money
10% down · 12.0% · 12mo
- Down + closing
- —
- Monthly P&I
- —
- Monthly cashflow
- —
- DSCR
- —
- Eligible?
- —
Short-term bridge; refi at stabilization.
Rent comps 40 comps
| Address | Beds | Baths | Sqft | Rent | $/sqft | DOM | Units | Dist |
|---|---|---|---|---|---|---|---|---|
| 2655 NE 205th Ave Fairview, OR | 1.0 | 1.0 | 728 | $1,460 | $2.01 | 16d | 1 | 0.05mi |
| 2667 NE 205th Ave Fairview, OR | 3.0 | 2.0 | 1115 | $1,950 | $1.75 | 25d | 1 | 0.07mi |
| 20454 NE Sandy Blvd Fairview, OR | 2.0 | 2.0 | 950 | $1,450 | $1.53 | 5d | 4 | 0.11mi |
| 20454 NE Sandy Blvd Apt B26 Fairview, OR | 2.0 | 2.0 | 950 | $1,722 | $1.81 | 22d | 7 | 0.13mi |
| 20347 NE Halsey St Fairview, OR | 2.0 | 2.0 | 985 | $1,614 | $1.64 | 5d | 2 | 0.53mi |
| 1559 NE 201st Ave Fairview, OR | 2.0 | 1.0 | 860 | $1,475 | $1.72 | 45d | 1 | 0.62mi |
| 1559 NE 201st Ave Unit 104 Fairview, OR | 2.0 | 1.0 | 860 | $1,475 | $1.72 | 25d | 1 | 0.62mi |
| 19927 NE Halsey St Unit 103 Portland, OR | 3.0 | 2.5 | 1225 | $1,895 | $1.55 | 45d | 1 | 0.65mi |
| 19849 NE Halsey St Unit 123 Portland, OR | 2.0 | 1.0 | 768 | $1,295 | $1.69 | 45d | 1 | 0.66mi |
| 19849 NE Halsey St Unit 110 Portland, OR | 3.0 | 2.0 | 895 | $1,870 | $2.09 | 19d | 1 | 0.66mi |
| 19849 NE Halsey St Unit 115 Portland, OR | 2.0 | 1.0 | 768 | $1,360 | $1.77 | 25d | 1 | 0.67mi |
| 22199 NE Sandy Blvd Fairview, OR | 2.0 | 1.0–2.0 | 707 | $2,200 | $3.11 | 5d | 27 | 0.73mi |
| 609 Lincoln St Unit 609 Fairview, OR | 3.0 | 2.5 | 1100 | $2,250 | $2.05 | 45d | 1 | 0.75mi |
| 19511 NE Halsey St Portland, OR | 2.0 | 1.0 | 917 | $1,395 | $1.52 | 5d | 1 | 0.76mi |
| 1650 NE Market Dr Fairview, OR | 1.0–2.0 | 1.0 | 741 | $1,895 | $2.56 | 3d | 3 | 0.79mi |
| 21929 NE Halsey St Unit 201 Fairview, OR | 1.0 | 1.0 | 700 | $1,595 | $2.28 | 45d | 1 | 0.86mi |
| 320 Lincoln St Fairview, OR | 2.0 | 1.0 | 950 | $1,395 | $1.47 | 45d | 1 | 0.87mi |
| 22100 NE Halsey St Fairview, OR | 1.0–3.0 | 1.0–2.0 | 1003 | $1,947 | $1.94 | 5d | 10 | 0.90mi |
| 230 Lincoln St Fairview, OR | 2.0 | 1.5 | 864 | $1,595 | $1.85 | 19d | 1 | 0.90mi |
| 1497 NE Market Dr Fairview, OR | 2.0 | 2.0 | 1136 | $1,750 | $1.54 | 45d | 1 | 0.91mi |
| 21933 NE Chinook Way Fairview, OR | 1.0–3.0 | 1.0–2.5 | 874 | $1,802 | $2.06 | 3d | 8 | 0.91mi |
| 230 Lincoln St Apt 116 Fairview, OR | 2.0 | 1.5 | 864 | $1,595 | $1.85 | 23d | 1 | 0.92mi |
| 22025 NE Halsey St Fairview, OR | 1.0–2.0 | 1.0–2.0 | 841 | $1,795 | $2.13 | 12d | 1 | 0.94mi |
| 21958 NE Chinook Way Apt C Fairview, OR | 1.0 | 1.0 | 950 | $1,250 | $1.32 | 45d | 1 | 0.96mi |
| 22032 NE Chinook Way Apt A Fairview, OR | 2.0 | 2.5 | 1150 | $1,995 | $1.73 | 45d | 1 | 1.01mi |
| 22032 NE Chinook Way Unit B Fairview, OR | 2.0 | 2.5 | 1150 | $2,045 | $1.78 | 9d | 1 | 1.01mi |
| 22620 NE Hancock St Fairview, OR | 2.0 | 2.0 | 1196 | $1,995 | $1.67 | 23d | 1 | 1.07mi |
| 20220 NE Glisan St Portland, OR | 1.0–2.0 | 1.0 | 767 | $1,595 | $2.08 | 5d | 2 | 1.09mi |
| 22701 NE Halsey St Unit FO222 Fairview, OR | 2.0 | 2.0 | 965 | $1,511 | $1.57 | 45d | 1 | 1.18mi |
| 22701 NE Halsey St Unit FO182 Fairview, OR | 2.0 | 1.0 | 820 | $1,458 | $1.78 | 45d | 1 | 1.18mi |
| 22701 NE Halsey St Unit FO221 Fairview, OR | 2.0 | 2.0 | 820 | $1,458 | $1.78 | 45d | 1 | 1.18mi |
| 22701 NE Halsey St Unit FO1101 Fairview, OR | 2.0 | 2.0 | 965 | $1,511 | $1.57 | 25d | 1 | 1.18mi |
| 1348 NE 186th Ave Portland, OR | 2.0 | 1.0 | 853 | $1,395 | $1.64 | 14d | 1 | 1.23mi |
| 22920 NE Halsey St Wood Village, OR | 2.0 | 1.0 | 784 | $1,500 | $1.91 | 25d | 1 | 1.26mi |
| 1210 NE 181st Ave Portland, OR | 2.0 | 1.5 | 945 | $1,250 | $1.32 | 45d | 1 | 1.41mi |
| 19316 NE Couch St Portland, OR | 3.0 | 2.0 | 1325 | $2,495 | $1.88 | 0d | 1 | 1.43mi |
| 1136 NE 181st Ave Portland, OR | 1.0–2.0 | 1.0 | 762 | $1,475 | $1.93 | 9d | 2 | 1.44mi |
| 20121 SE Stark St Portland, OR | 1.0–3.0 | 1.0–2.0 | 873 | $1,714 | $1.96 | 4d | 5 | 1.46mi |
| 1311 NE 181st Ave Portland, OR | 1.0 | 1.0 | 950 | $1,000 | $1.05 | 45d | 1 | 1.46mi |
| 17838 NE Multnomah Dr Unit 16 Portland, OR | 2.0 | 1.0 | 950 | $1,200 | $1.26 | 6d | 1 | 1.48mi |
Listing history 21 events
-
2026-06-21days on market $135,000 Active 45 DOM
-
2026-06-18days on market $135,000 Active 42 DOM
-
2026-06-17days on market $135,000 Active 41 DOM
-
2026-06-16days on market $135,000 Active 40 DOM
-
2026-06-15days on market $135,000 Active 39 DOM
-
2026-06-13days on market $135,000 Active 37 DOM
-
2026-06-13days on market $135,000 Active 36 DOM
-
2026-06-09days on market $135,000 Active 33 DOM
-
2026-06-08days on market $135,000 Active 32 DOM
-
2026-06-07days on market $135,000 Active 31 DOM
-
2026-06-03days on market $135,000 Active 27 DOM
-
2026-06-02days on market $135,000 Active 26 DOM
-
2026-06-01days on market $135,000 Active 25 DOM
-
2026-05-31days on market $135,000 Active 24 DOM
-
2026-05-07$135,000 Active 1283-char remark
-
2018-09-10soldstatus $42,000 Sold 414-char remark
Show marketing remark (414 chars)
Clean home and property, but in need of many repairs. View of Camas hills from LR and back yard. Lg Fenced, private yard. Private, gated lot. Wheel chair accessible entry ramp. 2nd BA unfinished and needs your custom finishing. Great room floor plan. Cash only. Please respect owner's privacy and do not pull in and park in carport or neighbors carport or walk property without an agent during a scheduled showing.
-
2018-09-02status Pending 414-char remark
Show marketing remark (414 chars)
Clean home and property, but in need of many repairs. View of Camas hills from LR and back yard. Lg Fenced, private yard. Private, gated lot. Wheel chair accessible entry ramp. 2nd BA unfinished and needs your custom finishing. Great room floor plan. Cash only. Please respect owner's privacy and do not pull in and park in carport or neighbors carport or walk property without an agent during a scheduled showing.
-
2018-08-29price $44,995 414-char remark
Show marketing remark (414 chars)
Clean home and property, but in need of many repairs. View of Camas hills from LR and back yard. Lg Fenced, private yard. Private, gated lot. Wheel chair accessible entry ramp. 2nd BA unfinished and needs your custom finishing. Great room floor plan. Cash only. Please respect owner's privacy and do not pull in and park in carport or neighbors carport or walk property without an agent during a scheduled showing.
-
2018-08-29status Active 414-char remark
Show marketing remark (414 chars)
Clean home and property, but in need of many repairs. View of Camas hills from LR and back yard. Lg Fenced, private yard. Private, gated lot. Wheel chair accessible entry ramp. 2nd BA unfinished and needs your custom finishing. Great room floor plan. Cash only. Please respect owner's privacy and do not pull in and park in carport or neighbors carport or walk property without an agent during a scheduled showing.
-
2018-08-24status Pending 414-char remark
Show marketing remark (414 chars)
Clean home and property, but in need of many repairs. View of Camas hills from LR and back yard. Lg Fenced, private yard. Private, gated lot. Wheel chair accessible entry ramp. 2nd BA unfinished and needs your custom finishing. Great room floor plan. Cash only. Please respect owner's privacy and do not pull in and park in carport or neighbors carport or walk property without an agent during a scheduled showing.
-
2018-08-14$49,985 Active 414-char remark
Show marketing remark (414 chars)
Clean home and property, but in need of many repairs. View of Camas hills from LR and back yard. Lg Fenced, private yard. Private, gated lot. Wheel chair accessible entry ramp. 2nd BA unfinished and needs your custom finishing. Great room floor plan. Cash only. Please respect owner's privacy and do not pull in and park in carport or neighbors carport or walk property without an agent during a scheduled showing.
ⓘ Source: listings_history table (triggers on properties + properties_extension) + one-shot
backfill from property_details.listing_events for pre-trigger history.
Tax reassessment forecast OR · Resets to sale price
- Current annual tax
- $342 · $28/mo
- Projected year-2 tax
- $1,310 · $109/mo
- Expected delta
- +$968/yr (+$81/mo · 282.9%)
ⓘ Screening estimate from a state-policy table — verify with the county assessor before closing.
Climate risk First Street
- Flood 1/10 Low FEMA zone X (unshaded) · 0% chance over 30 yrs
- Wildfire 1/10 Low
- Heat 3/10 Moderate 7 d/yr ≥93°F today · 15 d/yr by 30 yrs out
- Wind 1/10 Low
- Air quality 10/10 Extreme 23 unhealthy d/yr today · 27 by 30 yrs out
Nearby sold comps map
Loading sold comps map…
Walkable amenities ~0.75 mi
Loading nearby amenities…
Taxation est. · year 1
- Rental income
- $20,191
- − Mortgage interest
- −$7,562
- − Property taxes
- −$342
- − Insurance
- −$675
- − Repairs & maintenance
- −$1,615
- − Management
- −$1,615
- − Depreciation
- −$3,927
- Taxable income
- $4,454
- Est. tax owed @ 24.0%
- −$1,069
- After-tax cash flow
- $5,370/yr
For passive investors: Depreciation is non-cash, so a rental often shows a tax loss while cash-flowing — sheltering income. Rental losses are passive: they offset passive income freely, and up to $25,000/yr can offset ordinary (W-2) income if you actively participate and your MAGI is under $100k (phasing out to $0 by $150k); unused losses carry forward. On sale, claimed depreciation is recaptured at up to 25%, and gains may owe capital-gains tax (a 1031 exchange can defer both). Figures are a year-1 estimate at your 24.0% rate — not tax advice; consult a CPA.
Schools (NCES district)
- District
- Reynolds SD 7
- NCES district ID
- 4110520
- Math proficiency
- 21% ▬ 0.00%
- Reading proficiency
- 36% ▬ 0.00%
- Median HH income
- $45,502
- Composite
- 27.4/100
- National rank
- #12399
- State rank
- #162 of 183 in OR
Livability — Fairview
- Score
- 75/100
- State rank
- #85
- US rank
- #4103
Category grades
Schools grade is shown separately in the Schools card above.
Census & demographics
- Census place
- Fairview, OR
- County
- Multnomah County · 786,692 people
- City population
- 12,007
- Metro
- Portland-Vancouver-Hillsboro, OR-WA
- Population (ZIP)
- 12,007
- Household income
- $69,679
- Rent vs Own
- Severe rent burden
- 552.0
Population outlook (Multnomah County) Hauer SSP2
- Today (2025)
- 930,825 people
- By 2030
- 996,904 · +7.1%
- By 2040
- 1,121,379 · +20.5%
- By 2050
- 1,242,124 · +33.4%
- By 2075
- 1,464,431 · +57.3%
- By 2100
- 1,576,181 · +69.3%
Race, ethnicity, and origin ACS 2023
- Neighborhood character
- Diverse neighborhood (Simpson 0.68)
- Race & ethnicity
- White 48% Hispanic / Latino 27% Two or more races 15% Black 12% Pacific Islander 3% Native American 2% Asian 1%
- Hispanic origin (detail)
- Mexican 24%
- Common ancestry
- Portuguese 3% Italian 3% Lithuanian 3%
- Foreign-born
- 16% · Canada, Guatemala, Vietnam
- Languages at home
- 69% English-only · Spanish 23% Other Asian/Pacific 3% Russian/Polish/Slavic 1%
Political lean MEDSL · Multnomah
- 2024 margin
- Solid D (+62.1) · D 79.3% · R 17.2% · Other 3.5%
- 2008→2024 swing
- +6.0pp toward D · 2008: 56.1pp · 2024: 62.1pp
- All cycles
- 2024: D+62.1 2020: D+61.3 2016: D+58.3 2012: D+54.9 2008: D+56.1
Not yet ingested
- Civics
- —
Market trends
- HPI YoY
- ▼ -72.88%
- Current HPI
- 286.4915
- Rent YoY
- ▼ -0.99%
- Metro
- Portland-Vancouver-Hillsboro, OR-WA
- State GDP YoY
- ▲ 2.05%
- F500 in state
- 2
Industry mix (Fortune 500 HQ in OR)
| Industry | F500 HQs | Revenue |
|---|---|---|
| Consumer Goods | 1 | $51B |
|
||
Price history
+170.1% since first listed7 events — show timeline
- 2026-05-07 Listed $135,000 RMLS
- 2018-09-10 Sold (MLS) $42,000 RMLS
- 2018-09-02 Pending — RMLS
- 2018-08-29 Price Changed $44,995 RMLS
- 2018-08-29 Relisted — RMLS
- 2018-08-24 Pending — RMLS
- 2018-08-14 Listed $49,985 RMLS
Property tax history
-3.0%/yrLatest (2016): $342 · -29.8% YoY. Source: county tax records.
Cash-flow waterfall
monthlySold comps — $/sqft
last 12 mo · ≤1 miLoading sold comps…