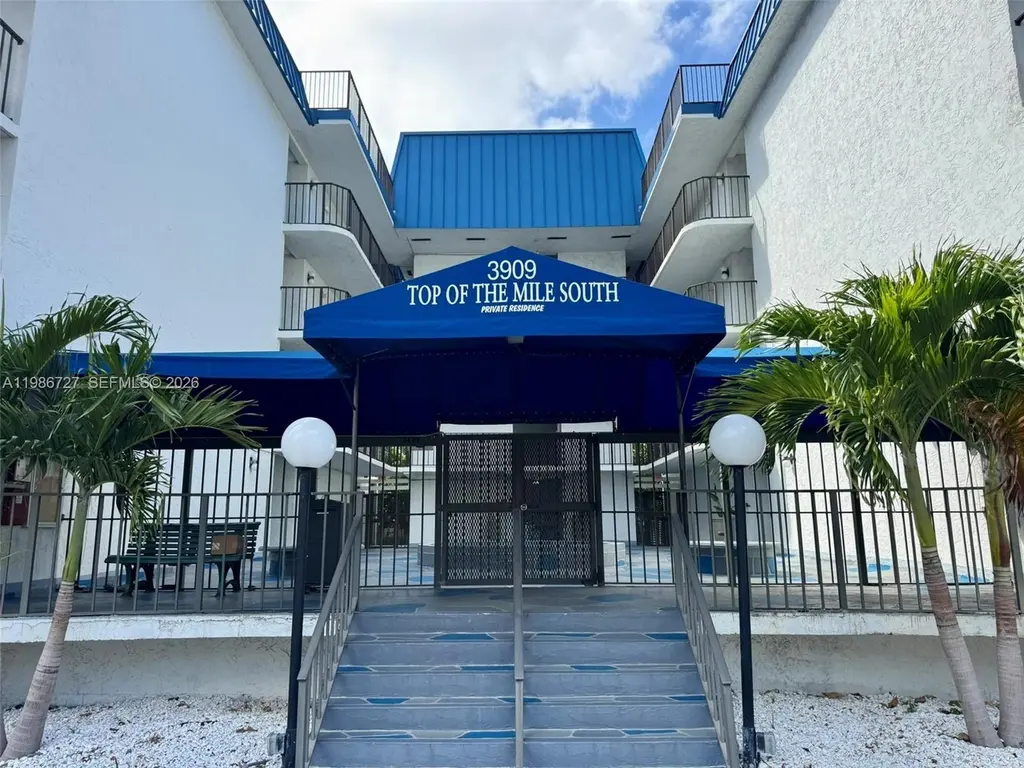
3909 N Ocean Blvd #208 · Fort Lauderdale, FL
Flood risk No data
- FEMA flood zone
- —
- Chance of flooding over 30 yrs
- —
- Est. flood insurance / yr
- —
Fire risk No data
- Est. fire insurance / yr
- —
Heat risk No data
- Hot days now (above threshold)
- —
- Hot days in 30 yrs
- —
Wind risk No data
- Chance of severe wind over 30 yrs
- —
Air-quality risk No data
- Unhealthy air days now
- —
- Unhealthy air days in 30 yrs
- —
Risk factors via First Street. Map © Google.
Why this score? — see what drove the D grade
The composite is a weighted blend of 9 inputs, each scored 0–100. Each bar is that input's sub-score; the figure is the points it added to the 100-point composite (weight × sub-score).
- Cash flow +9.8/30.0
- ARV discount +7.5/15.0
- 1% rule +6.5/10.0
- Schools +4.1/10.0
- Livability +4.1/5.0
- Rent growth +3.4/5.0
- DSCR +2.8/10.0
- Condition / age +2.5/5.0
- Appreciation +0.0/10.0
$370,000
🖨 Deal sheet (PDF) 📄 Offer letter ✓ Due diligence
Listing remarks
Charming 2-Bedroom 2-bathroom condo is coveniently located accross the street from the beach and within walking distance to Dining, Entertainment and Nightlife. Situated along A1A and less than a mile from beautiful Lauderdale By The Sea. This spacious unit features a split floorplan condo, remodeled kitchen and bathrooms with electric tankless water heater and washer and dryer in unit. Enjoy your oversized balcony overlooking the garden. Relax by the pool after you exercise in the updated fitness center. Perfect for a first time buyer or second home.
Key facts
- Oversized balcony
- Remodeled kitchen
- $926 HOA
Tags
Property features AI
Finance
- Financial info: Pets not allowed
- HOA & community: Monthly association fee; Association amenities include clubhouse, fitness center, pool, and trash service; Community of 64 units
Exterior
- Parking: Garage with 1 covered space; One-space parking
- Security: Complex fenced; Phone entry; Smoke detectors
- Utilities: Central heating and cooling
- Home design: Attached property; 4-story building; Entry on level 2
- Construction: Block construction; Effective year built
- Exterior features: Courtyard; Wrap-around porch; Porch; Storm/security shutters; Association pool
Interior
- Kitchen: Dishwasher; Electric range; Microwave; Icemaker; Refrigerator
- Flooring: Tile flooring
- Bathrooms: 2 full bathrooms
- Heating & cooling: Central heating; Central air conditioning
- Interior features: Dining area and separate/formal dining room; Walk-in closet(s); Elevator; Accessible elevator installed; Other interior features
- Laundry & utility: Washer; Dryer; Electric water heater
Neighborhood map
What this means for you Summary
Snapshot
- This is a 2-bed/2.0-bath condo listed at $370k.
Deal economics
- At list price, monthly cash flow is $-235 ($-3k/yr) — negative.
- To cash-flow at today's rent, offer at most $328k (11.2% below list).
- Meets the 1% rule at list price ($4k rent vs $370k).
- Recommended offer: $328k (11.2% below list) — sets the bar for cash-flow.
- Cap rate 5.5% vs local median 2.2% in Fort Lauderdale — top-decile yield for the area; either an underpriced asset or a hidden risk that comps aren't pricing in. Stress-test before assuming the spread holds.
Location & tenants
- Location reads 82/100 on livability (#78 in FL, #1,293 nationally) — a professional / high-income tenant draw. Strengths: crime A+, amenities A+, health & safety A+; Watch: cost of living D-.
- Broward (suburban): math 42% / reading 53% proficiency, ranked #46 of 73 in FL (top 63%) — families likely to look elsewhere, expect single-tenant / working-renter base with shorter leases.
- Zoned schools: Nova Blanche Forman Elementary (math 35% / reading 55%, grade D-, #1,271 of 2,144 statewide, top 60%, 769 students, 72% FRL); Nova Middle School (math 44% / reading 53%, grade C-, #274 of 571 statewide, top 50%, 1,284 students, 68% FRL); Fort Lauderdale High School (math 38% / reading 67%, grade C-, #154 of 667 statewide, top 24%, 2,228 students, 57% FRL).
- Market conditions: Rents rising (+3.6%/yr); 746 active listings in the ZIP; 40 comparable units currently listed for rent nearby; rentals at typical pace (median 17d on market — plan ~3-4 weeks tenant-placement turnaround); solid renter incomes; 2,111 units permitted in Broward County in 2024 (1,265 in 5+ unit buildings).
- At $4,243/mo this rent would consume 54% of the median local household income ($94k/yr) (locally 912% of renters already pay >50% of income on rent) — very limited rent-growth headroom before tenants either downsize or default.
Forward outlook
- Local home prices are declining (-3.0%/yr); year-one equity from $3k of loan paydown is wiped out by about $11k of value loss. Plan a longer hold.
- Broward County population projected at +34% by 2050 — long-run rental-demand tailwind backs the buy-and-hold thesis.
Negotiation context
- It's been on market 93 days — a 9% lower offer ($337k) is reasonable based on typical stale-listing flexibility.
- Current owner paid $135k; list at $370k implies a 174% gain — meaningful room to come down on a strong offer.
Risks & watch-outs
- Watch-outs: HOA is 22% of rent.
Questions for the listing agent
- What do current leases actually rent for vs. the listed asking? Can we see a recent rent roll and the last 12 months of T-12 income?
- It's been on market 93 days. Have you received any prior offers? Is the seller open to a 11% concession, seller financing, or rate buy-down credit?
- Built in 1979 — when were the roof, HVAC, electrical panel, plumbing, and water heater last replaced?
- What does the HOA fee cover, when was the last increase, and are there any pending special assessments or reserve-fund shortfalls?
- Any open or pending special assessments — roof, HVAC, plumbing, elevator, façade? What's the per-unit balance and payoff schedule, and is the seller paying it off at close or rolling it to the buyer?
- Why hasn't it sold? Are there any deal-killer items the seller is aware of (foundation, flood, title, zoning, code violations)?
- Is there a deadline driving the sale (1031 exchange, divorce, estate, relocation)? That informs how much negotiation room exists.
- Schools are B-rated — typically a magnet for longer-tenancy family renters. What's the average tenant stay here, and is there a school-zone premium baked into asking?
- The area grade is low — what's the realistic commute time and amenity access for the typical tenant pool here? Any planned neighborhood developments (good or bad) we should know about?
- What's the average days-on-market for RENTAL listings here right now (not sales)? A rising rental-DOM trend means longer vacancies and softer asking-rent achievability than the comps imply.
- What's the recent tenant-quality profile in this submarket — average credit score on applications, eviction rate, late-payment / NSF rate, and stable-employment percentage? A property-management company in the area should have these aggregated.
- How much new apartment / multifamily construction is in the pipeline within 1–3 miles? Heavy new supply (>2% of stock underway) typically softens rents 12–24 months out; light construction supports rent growth.
Investment metrics
- 1% rule
- 1.15% ✓
- Cap rate
- 5.53%
- Cash-on-cash
- -2.72%
- DSCR
- 0.88
- GRM
- 7.3
CMA / ARV
No comps found within radius.
Projected returns pro-forma
-3.0% appreciation · 3.63% rent growth · sell at horizon
- IRR
- -19.6%
- Equity multiple
- 0.31×
- Total profit
- $-71,527
- Equity at exit
- $55,168
- IRR
- -10.2%
- Equity multiple
- 0.35×
- Total profit
- $-67,485
- Equity at exit
- $31,991
Cash invested: $103,600 (down + closing). Projections, not guarantees.
Landlord ↔ Tenant lean methodology
- Overall (STATE)
- 87 Strongly Landlord-Friendly
- State Florida
- 87 Strongly Landlord-Friendly · R+3
- County
- — inherits STATE
- City
- — inherits STATE
ZIP-level market 33308
- Rents YoY
- 3.6%
- Active inventory
- 746
- Price-to-rent
- 7.3×
Monthly cashflow live
- Estimated rent
- $4,243 high interval (Pro) →
- Mortgage (P&I)
- −$1,940
- Tax from tax record
- −$567 /mo · $6,803/yr
- Insurance
- −$154
- HOA
- −$926
- Vacancy / Maint / Mgmt
- −$891
- Net cashflow
- $-235
Break-even live
Sensitivity live
| Price | -10% $-26 | -5% $-130 | +0% $-235 | +5% $-340 | +10% $-445 |
|---|---|---|---|---|---|
| Rent | -10% $-570 | -5% $-403 | +0% $-235 | +5% $-68 | +10% $100 |
| Rate | -1.0pp $-49 | -0.5pp $-141 | base $-235 | +0.5pp $-331 | +1.0pp $-429 |
UW: 25.0% down · 7.5% · 30yr · 1.5% tax · 5.0% vac · 8.0% maint · 8.0% mgmt
Financing live
Cash to close
- Down payment
- $92,500
- Closing costs
- $11,100
- Reserves months
- —
- Total cash needed
- —
Loan-product check · same deal, 3 products live
Conventional
25% down · 7.5% · 30yr
- Down + closing
- —
- Monthly P&I
- —
- Monthly cashflow
- —
- DSCR
- —
- Eligible?
- —
Personal DTI + credit; lowest rate.
DSCR
20% down · 8.5% · 30yr
- Down + closing
- —
- Monthly P&I
- —
- Monthly cashflow
- —
- DSCR
- —
- Eligible?
- —
No personal income docs; deal must DSCR.
Hard money
10% down · 12.0% · 12mo
- Down + closing
- —
- Monthly P&I
- —
- Monthly cashflow
- —
- DSCR
- —
- Eligible?
- —
Short-term bridge; refi at stabilization.
Rent comps 40 comps
| Address | Beds | Baths | Sqft | Rent | $/sqft | DOM | Units | Dist |
|---|---|---|---|---|---|---|---|---|
| 3900 Galt Ocean Dr Fort Lauderdale, FL | 1.0–2.0 | 1.5–2.0 | 1429 | $5,600 | $3.92 | 19d | 4 | 0.14mi |
| 3900 Galt Ocean Dr Fort Lauderdale, FL | 1.0–2.0 | 1.5–2.0 | 1429 | $5,600 | $3.92 | 0d | 4 | 0.14mi |
| 3850 Galt Ocean Dr #1003 Fort Lauderdale, FL | 1.0 | 1.5 | 1050 | $3,300 | $3.14 | 26d | 1 | 0.16mi |
| 4010 Galt Ocean Dr Fort Lauderdale, FL | 2.0–3.0 | 2.0 | 810 | $3,200 | $3.95 | 6d | 3 | 0.17mi |
| 4010 Galt Ocean Dr Fort Lauderdale, FL | 2.0–3.0 | 2.0 | 810 | $5,000 | $6.17 | 7d | 2 | 0.17mi |
| 4010 Galt Ocean Dr Fort Lauderdale, FL | 2.0–3.0 | 2.0 | 1355 | $5,000 | $3.69 | 15d | 2 | 0.17mi |
| 4010 Galt Ocean Dr Fort Lauderdale, FL | 2.0 | 2.0 | 1190 | $3,150 | $2.65 | 22d | 2 | 0.17mi |
| 4010 Galt Ocean Dr #802 Fort Lauderdale, FL | 2.0 | 2.0 | 1190 | $5,000 | $4.20 | 16d | 1 | 0.17mi |
| 3800 Galt Ocean Dr Fort Lauderdale, FL | 1.0–2.0 | 1.5–2.0 | 1071 | $4,500 | $4.20 | 16d | 6 | 0.17mi |
| 3800 Galt Ocean Dr Fort Lauderdale, FL | 1.0–2.0 | 1.5–2.0 | 1071 | $4,500 | $4.20 | 6d | 6 | 0.17mi |
| 3800 Galt Ocean Dr Fort Lauderdale, FL | 1.0–2.0 | 1.5–2.0 | 1071 | $4,250 | $3.97 | 4d | 7 | 0.17mi |
| 3750 Galt Ocean Dr #209 Fort Lauderdale, FL | 1.0 | 1.5 | 1187 | $4,000 | $3.37 | 26d | 1 | 0.17mi |
| 4020 Galt Ocean Dr Fort Lauderdale, FL | 1.0–2.0 | 1.0–2.0 | 1553 | $8,750 | $5.63 | 6d | 6 | 0.19mi |
| 4020 Galt Ocean Dr Fort Lauderdale, FL | 1.0–2.0 | 1.0–2.0 | 1536 | $8,750 | $5.69 | 6d | 7 | 0.19mi |
| 3700 Galt Ocean Dr Fort Lauderdale, FL | 1.0–2.0 | 1.5–2.0 | 1025 | $3,790 | $3.70 | 26d | 2 | 0.22mi |
| 3600 Galt Ocean Dr Unit 9C Fort Lauderdale, FL | 2.0 | 2.0 | 1155 | $4,000 | $3.46 | 26d | 1 | 0.26mi |
| 3605 NE 32nd Ave Unit 209A Fort Lauderdale, FL | 2.0 | 2.0 | 1000 | $3,300 | $3.30 | 3d | 1 | 0.28mi |
| 3605 NE 32nd Ave Unit 209A Fort Lauderdale, FL | 2.0 | 2.0 | 1000 | $3,300 | $3.30 | 21d | 1 | 0.28mi |
| 3500 Galt Ocean Dr #2314 Fort Lauderdale, FL | 1.0 | 1.5 | 1088 | $4,500 | $4.14 | 26d | 1 | 0.33mi |
| 3500 Galt Ocean Dr #2314 Fort Lauderdale, FL | 1.0 | 1.5 | 1088 | $4,500 | $4.14 | 5d | 1 | 0.33mi |
| 4250 Galt Ocean Dr Fort Lauderdale, FL | 2.0 | 2.0 | 1350 | $3,650 | $2.70 | 3d | 2 | 0.33mi |
| 4280 Galt Ocean Dr Fort Lauderdale, FL | 1.0–3.0 | 1.5–2.5 | 2025 | $6,250 | $3.09 | 6d | 5 | 0.37mi |
| 4280 Galt Ocean Dr Fort Lauderdale, FL | 1.0–3.0 | 1.5–2.5 | 2025 | $6,250 | $3.09 | 4d | 5 | 0.37mi |
| 4280 Galt Ocean Dr Fort Lauderdale, FL | 1.0–3.0 | 2.0–2.5 | 2025 | $6,000 | $2.96 | 19d | 5 | 0.37mi |
| 4280 Galt Ocean Dr Fort Lauderdale, FL | 1.0–3.0 | 2.0–2.5 | 2025 | $6,000 | $2.96 | 23d | 5 | 0.37mi |
| 3430 Galt Ocean Dr Fort Lauderdale, FL | 1.0–2.0 | 1.5–2.0 | 1343 | $4,980 | $3.71 | 17d | 4 | 0.38mi |
| 3430 Galt Ocean Dr Fort Lauderdale, FL | 1.0–4.0 | 1.5–4.5 | 2873 | $6,320 | $2.20 | 9d | 4 | 0.38mi |
| 4013 N Ocean Dr #102 Fort Lauderdale, FL | 1.0 | 1.5 | 790 | $3,500 | $4.43 | 26d | 1 | 0.51mi |
| 3031 N Ocean Blvd Fort Lauderdale, FL | 2.0–3.0 | 2.0 | 1325 | $3,475 | $2.62 | 19d | 3 | 0.64mi |
| 3031 N Ocean Blvd Fort Lauderdale, FL | 2.0–3.0 | 2.0 | 1290 | $3,200 | $2.48 | 6d | 4 | 0.64mi |
| 3031 N Ocean Blvd Fort Lauderdale, FL | 2.0–3.0 | 2.0 | 1290 | $3,400 | $2.63 | 9d | 3 | 0.64mi |
| 3020 NE 32nd Ave Fort Lauderdale, FL | 1.0–2.0 | 1.0–2.0 | 920 | $4,300 | $4.67 | 6d | 4 | 0.71mi |
| 3020 NE 32nd Ave Fort Lauderdale, FL | 2.0 | 2.0 | 1185 | $3,875 | $3.27 | 9d | 3 | 0.71mi |
| 4144 El Mar Dr Unit 1 Lauderdale-By-The-Sea, FL | 2.0 | 2.0 | 1116 | $3,250 | $2.91 | 26d | 1 | 0.71mi |
| 2900 NE 30th St Unit H6 Fort Lauderdale, FL | 2.0 | 2.0 | 1040 | $3,200 | $3.08 | 26d | 1 | 0.75mi |
| 2866 NE 30th St Fort Lauderdale, FL | 2.0 | 2.0 | 931 | $4,900 | $5.26 | 0d | 2 | 0.78mi |
| 2841 N Ocean Blvd Fort Lauderdale, FL | 2.0 | 2.0 | 1150 | $3,700 | $3.22 | 16d | 3 | 0.80mi |
| 2831 N Ocean Blvd Unit 801N Fort Lauderdale, FL | 2.0 | 2.0 | 1468 | $6,000 | $4.09 | 26d | 1 | 0.85mi |
| 2831 N Ocean Blvd Unit 702N Fort Lauderdale, FL | 2.0 | 2.0 | 1274 | $5,200 | $4.08 | 26d | 1 | 0.85mi |
| 2831 N Ocean Blvd Unit 702N Fort Lauderdale, FL | 2.0 | 2.0 | 1274 | $5,200 | $4.08 | 4d | 1 | 0.85mi |
HOA detail condo
- Monthly dues
- $926 · $11,112/yr
- Likely covers
- waterelectricpoolgym
- Assessments
- None detected in remarks — confirm with the listing agent.
Listing history 19 events
-
2026-06-21days on market $370,000 Active 93 DOM
-
2026-06-18days on market $370,000 Active 90 DOM
-
2026-06-17days on market $370,000 Active 89 DOM
-
2026-06-16days on market $370,000 Active 88 DOM
-
2026-06-15days on market $370,000 Active 87 DOM
-
2026-06-13days on market $370,000 Active 85 DOM
-
2026-06-09days on market $370,000 Active 81 DOM
-
2026-06-08days on market $370,000 Active 80 DOM
-
2026-06-07days on market $370,000 Active 79 DOM
-
2026-06-04days on market $370,000 Active 76 DOM
-
2026-06-03days on market $370,000 Active 75 DOM
-
2026-06-02days on market $370,000 Active 74 DOM
-
2026-06-01days on market $370,000 Active 73 DOM
-
2026-05-31days on market $370,000 Active 72 DOM
-
2026-03-20$370,000 Active
-
2012-06-01soldstatus $135,000
-
1999-03-02soldstatus $98,000
-
1995-10-12soldstatus $73,500
-
1989-09-18soldstatus $68,000
ⓘ Source: listings_history table (triggers on properties + properties_extension) + one-shot
backfill from property_details.listing_events for pre-trigger history.
Tax reassessment forecast FL · Resets to sale price
- Current annual tax
- $6,803 · $567/mo
- Projected year-2 tax
- $6,803 · $567/mo
- Expected delta
- $0/yr ($0/mo · 0.0%)
ⓘ Screening estimate from a state-policy table — verify with the county assessor before closing.
Nearby sold comps map
Loading sold comps map…
Walkable amenities ~0.75 mi
Loading nearby amenities…
Taxation est. · year 1
- Rental income
- $50,921
- − Mortgage interest
- −$20,726
- − Property taxes
- −$6,803
- − Insurance
- −$1,850
- − Repairs & maintenance
- −$4,074
- − Management
- −$4,074
- − HOA
- −$11,112
- − Depreciation
- −$10,764
- Taxable loss
- −$8,481
- Est. tax savings @ 24.0%
- +$2,035
- After-tax cash flow
- $-786/yr
For passive investors: Depreciation is non-cash, so a rental often shows a tax loss while cash-flowing — sheltering income. Rental losses are passive: they offset passive income freely, and up to $25,000/yr can offset ordinary (W-2) income if you actively participate and your MAGI is under $100k (phasing out to $0 by $150k); unused losses carry forward. On sale, claimed depreciation is recaptured at up to 25%, and gains may owe capital-gains tax (a 1031 exchange can defer both). Figures are a year-1 estimate at your 24.0% rate — not tax advice; consult a CPA.
Schools (NCES district)
- District
- Broward
- NCES district ID
- 1200180
- Math proficiency
- 42% ▼ -18.00%
- Reading proficiency
- 53% ▼ -5.00%
- Median HH income
- $52,139
- Composite
- 40.88/100
- National rank
- #3621
- State rank
- #46 of 73 in FL
Livability — Fort Lauderdale
- Score
- 82/100
- State rank
- #78
- US rank
- #1293
Category grades
Schools grade is shown separately in the Schools card above.
Census & demographics
- Census place
- Fort Lauderdale, FL
- County
- Broward County · 1,963,430 people
- City population
- 235,769
- Metro
- Miami-Fort Lauderdale-Pompano Beach, FL
- Population (ZIP)
- 27,935
- Household income
- $93,879
- Rent vs Own
- Severe rent burden
- 912.0
Population outlook (Broward County) Hauer SSP2
- Today (2025)
- 2,207,033 people
- By 2030
- 2,360,704 · +7.0%
- By 2040
- 2,661,208 · +20.6%
- By 2050
- 2,946,698 · +33.5%
- By 2075
- 3,602,273 · +63.2%
- By 2100
- 3,970,984 · +79.9%
Race, ethnicity, and origin ACS 2023
- Neighborhood character
- Predominantly White (75%)
- Race & ethnicity
- White 75% Hispanic / Latino 16% Two or more races 14% Asian 3% Black 2%
- Hispanic origin (detail)
- Puerto Rican 2% Cuban 3%
- Common ancestry
- Romanian 4% Lithuanian 3% Scotch-Irish 3%
- Foreign-born
- 24% · Canada, Jamaica, Dominican Republic
- Languages at home
- 75% English-only · Spanish 14% Other Indo-European 5% Russian/Polish/Slavic 2%
Political lean MEDSL · Broward
- 2024 margin
- D (+17.0) · D 58.0% · R 41.0%
- 2008→2024 swing
- -17.8pp toward R · 2008: 34.7pp · 2024: 17.0pp
- All cycles
- 2024: D+17.0 2020: D+29.8 2016: D+35.0 2012: D+34.9 2008: D+34.7
Not yet ingested
- Civics
- —
Market trends
- HPI YoY
- ▼ -417.95%
- Current HPI
- 325.3902
- Rent YoY
- ▲ 3.63%
- Metro
- Miami-Fort Lauderdale-Pompano Beach, FL
- State GDP YoY
- ▲ 3.28%
- F500 in state
- 36
Industry mix (Fortune 500 HQ in FL)
| Industry | F500 HQs | Revenue |
|---|---|---|
| Industrial Technology | 2 | $29B |
|
||
| Insurance | 2 | $17B |
|
||
| Retail | 1 | $60B |
|
||
| Technology Distribution | 1 | $58B |
|
||
| Homebuilding | 1 | $35B |
|
||
| Technology Manufacturing | 1 | $35B |
|
||
Price history
+444.1% since first listed5 events — show timeline
- 2026-03-20 Listed $370,000 MARMLS
- 2012-06-01 Sold (Public Records) $135,000 Public Records
- 1999-03-02 Sold (Public Records) $98,000 Public Records
- 1995-10-12 Sold (Public Records) $73,500 Public Records
- 1989-09-18 Sold (Public Records) $68,000 Public Records
Property tax history
+9.7%/yrLatest (2025): $6,803 · +7.5% YoY. Source: county tax records.
Cash-flow waterfall
monthlySold comps — $/sqft
last 12 mo · ≤1 miLoading sold comps…