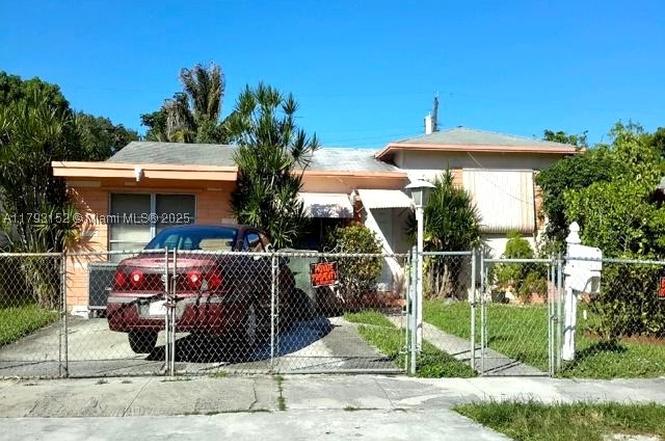
734 NW 1st St · Hallandale Beach, FL
Flood risk 5/10 · Moderate
- FEMA flood zone
- X (unshaded)
- Chance of flooding over 30 yrs
- 0.24%
- Est. flood insurance / yr
- $507 – $1,088
Fire risk 1/10 · Minimal
- Est. fire insurance / yr
- $947 – $1,759
Heat risk 10/10 · Severe
- Hot days now (above 105°F)
- 7 days/yr
- Hot days in 30 yrs
- 26 days/yr
Wind risk 10/10 · Severe
- Chance of severe wind over 30 yrs
- 99.0%
Air-quality risk 2/10 · Minimal
- Unhealthy air days now
- 2 days/yr
- Unhealthy air days in 30 yrs
- 2 days/yr
Risk factors via First Street. Map © Google.
Why this score? — see what drove the C- grade
The composite is a weighted blend of 9 inputs, each scored 0–100. Each bar is that input's sub-score; the figure is the points it added to the 100-point composite (weight × sub-score).
- ARV discount +15.0/15.0
- Cash flow +13.9/30.0
- 1% rule +4.7/10.0
- DSCR +4.2/10.0
- Schools +4.1/10.0
- Livability +4.0/5.0
- Rent growth +2.6/5.0
- Condition / age +2.5/5.0
- Appreciation +0.0/10.0
$349,000
🖨 Deal sheet (PDF) 📄 Offer letter ✓ Due diligence
Listing remarks
Welcome to Hallandale Beach. Just minutes from Gulfstream Park, Big Easy Casino, Aventura Mall, and the beautiful beaches of Hallandale and Hollywood, this home provides easy access to top attractions, shopping, dining, and entertainment. Major highways like I-95 and US-1 are nearby, making travel to Miami, Fort Lauderdale, and surrounding areas quick and easy. The neighborhood features parks, schools, and a welcoming community feel. Home needs some TLC to make it your own. NO HOA! Property is being sold as-is with the right to inspect, a great investment opportunity in a prime location.
Key facts
- No hoa
- Prime location
- 6,750 sq ft lot
Tags
Neighborhood map
What this means for you Summary
Snapshot
- This is a 3-bed/1.0-bath single-family listed at $349k.
Deal economics
- At list price, monthly cash flow is $38 ($459/yr) — positive.
- The deal already cash-flows at list — no discount required.
- To meet the 1% rule (rent ≥ 1% of price), the offer needs to be $338k (3.2% below list).
- Recommended offer: $338k (3.2% below list) — sets the bar for 1% rule.
- Cap rate 6.4% vs local median 5.2% in Hallandale Beach — meaningfully above typical; check what's discounted (condition, days-on-market, listing class) to confirm the premium yield is real.
Location & tenants
- Location reads 81/100 on livability (#86 in FL, #1,400 nationally) — a professional / high-income tenant draw. Strengths: commute A+, health & safety A+, crime B+; Watch: employment D-.
- Broward (suburban): math 42% / reading 53% proficiency, ranked #46 of 73 in FL (top 63%) — families likely to look elsewhere, expect single-tenant / working-renter base with shorter leases.
- Zoned schools: Gulfstream Academy of Hallandale Beach (math 32% / reading 40%, grade F, #1,670 of 2,144 statewide, top 78%, 1,317 students, 73% FRL); Nova Middle School (math 44% / reading 53%, grade C-, #274 of 571 statewide, top 50%, 1,284 students, 68% FRL); Nova High School (math 22% / reading 56%, grade F, #312 of 667 statewide, top 48%, 2,227 students, 59% FRL) — zoned schools average 67% FRL vs 51% district-wide (16 pts higher); higher-poverty schools than district average — tighter screening recommended.
- Market conditions: Rents flat; 1380 active listings in the ZIP; 40 comparable units currently listed for rent nearby; rentals at typical pace (median 23d on market — plan ~3-4 weeks tenant-placement turnaround); 2,111 units permitted in Broward County in 2024 (1,265 in 5+ unit buildings).
- At $3,379/mo this rent would consume 78% of the median local household income ($52k/yr) (locally 3293% of renters already pay >50% of income on rent) — very limited rent-growth headroom before tenants either downsize or default.
Forward outlook
- Local home prices are declining (-3.0%/yr); year-one equity from $2k of loan paydown is wiped out by about $10k of value loss. Plan a longer hold.
- Broward County population projected at +34% by 2050 — long-run rental-demand tailwind backs the buy-and-hold thesis.
Negotiation context
- It's been on market 42 days — a 3% lower offer ($339k) is reasonable based on typical stale-listing flexibility.
- Current owner paid $42k; list at $349k implies a 721% gain — meaningful room to come down on a strong offer.
Risks & watch-outs
- Watch-outs: built in 1955 — expect roof / HVAC / electrical / plumbing capex.
- Climate carrying-cost: moderate flood risk; severe wind risk, 99% chance of damaging wind over 30y; extreme-heat days projected 7→26/yr by 2055 (HVAC capex compounding) — expect insurance premiums to compound above CPI over the hold.
Questions for the listing agent
- It's been on market 42 days. Have you received any prior offers? Is the seller open to a 3% concession, seller financing, or rate buy-down credit?
- Built in 1955 — when were the roof, HVAC, electrical panel, plumbing, and water heater last replaced?
- Is there a deadline driving the sale (1031 exchange, divorce, estate, relocation)? That informs how much negotiation room exists.
- What's the average days-on-market for RENTAL listings here right now (not sales)? A rising rental-DOM trend means longer vacancies and softer asking-rent achievability than the comps imply.
- What's the recent tenant-quality profile in this submarket — average credit score on applications, eviction rate, late-payment / NSF rate, and stable-employment percentage? A property-management company in the area should have these aggregated.
- How much new for-sale + rental construction is in the pipeline within 1–3 miles? Heavy new supply typically softens prices + rents 12–24 months out; constrained supply supports both.
Investment metrics
- 1% rule
- 0.97% ✗
- Cap rate
- 6.42%
- Cash-on-cash
- 0.47%
- DSCR
- 1.02
- GRM
- 8.6
CMA / ARV
- ARV (on-the-fly)
- $419,377
- Comps found
- 8
Show comp detail 8 sales within ~0.75 mi
| Address | Dist | Beds/Ba | Sqft | Sold | Price | $/sf | Match |
|---|---|---|---|---|---|---|---|
| 104 SW 7th Ave | 0.18mi | 3/2.0 | 1,328 (+5%) | 12mo | $440,000 | $331 | 70 |
| 621 SW 5th Ct | 0.51mi | 3/2.0 | 1,284 (+1%) | 7mo | $425,000 | $331 | 64 |
| 811 NW 5th Ave | 0.59mi | 2/1.0 (-1) | 1,272 (+0%) | 5mo | $310,000 | $244 | 63 |
| 613 SW 6th St | 0.56mi | 3/2.0 | 1,275 (+1%) | 10mo | $320,500 | $251 | 60 |
| 617 SW 4th Ct | 0.47mi | 3/2.0 | 1,232 (-3%) | 19mo | $415,000 | $337 | 54 |
| 629 SW 4th St | 0.42mi | 2/1.5 (-1) | 1,100 (-13%) | 23mo | $333,500 | $303 | 32 |
| 531 SW 11th Ave | 0.68mi | 3/2.0 | 1,449 (+14%) | 19mo | $435,000 | $300 | 24 |
| 700 SW 2nd Ave | 0.74mi | 2/2.0 (-1) | 1,136 (-10%) | 20mo | $562,000 | $495 | 23 |
Match score weights: distance 35% · size 25% · config 20% · recency 20%. Top-matched comps best support the ARV.
Projected returns pro-forma
-3.0% appreciation · 0.43% rent growth · sell at horizon
- IRR
- -18.7%
- Equity multiple
- 0.36×
- Total profit
- $-62,450
- Equity at exit
- $52,037
- IRR
- -18.0%
- Equity multiple
- 0.14×
- Total profit
- $-83,691
- Equity at exit
- $30,175
Cash invested: $97,720 (down + closing). Projections, not guarantees.
Landlord ↔ Tenant lean methodology
- Overall (STATE)
- 87 Strongly Landlord-Friendly
- State Florida
- 87 Strongly Landlord-Friendly · R+3
- County
- — inherits STATE
- City
- — inherits STATE
ZIP-level market 33009
- Rents YoY
- 0.4%
- Active inventory
- 1380
- Price-to-rent
- 8.6×
Monthly cashflow live
- Estimated rent
- $3,379 high interval (Pro) →
- Mortgage (P&I)
- −$1,830
- Tax from tax record
- −$655 /mo · $7,863/yr
- Insurance
- −$145
- HOA
- −$0
- Vacancy / Maint / Mgmt
- −$710
- Net cashflow
- $38
Break-even live
Sensitivity live
| Price | -10% $236 | -5% $137 | +0% $38 | +5% $-61 | +10% $-159 |
|---|---|---|---|---|---|
| Rent | -10% $-229 | -5% $-95 | +0% $38 | +5% $172 | +10% $305 |
| Rate | -1.0pp $214 | -0.5pp $127 | base $38 | +0.5pp $-52 | +1.0pp $-144 |
UW: 25.0% down · 7.5% · 30yr · 1.5% tax · 5.0% vac · 8.0% maint · 8.0% mgmt
Financing live
Cash to close
- Down payment
- $87,250
- Closing costs
- $10,470
- Reserves months
- —
- Total cash needed
- —
Loan-product check · same deal, 3 products live
Conventional
25% down · 7.5% · 30yr
- Down + closing
- —
- Monthly P&I
- —
- Monthly cashflow
- —
- DSCR
- —
- Eligible?
- —
Personal DTI + credit; lowest rate.
DSCR
20% down · 8.5% · 30yr
- Down + closing
- —
- Monthly P&I
- —
- Monthly cashflow
- —
- DSCR
- —
- Eligible?
- —
No personal income docs; deal must DSCR.
Hard money
10% down · 12.0% · 12mo
- Down + closing
- —
- Monthly P&I
- —
- Monthly cashflow
- —
- DSCR
- —
- Eligible?
- —
Short-term bridge; refi at stabilization.
Rent comps 40 comps
| Address | Beds | Baths | Sqft | Rent | $/sqft | DOM | Units | Dist |
|---|---|---|---|---|---|---|---|---|
| 220 SW 9th Ave #516 Hallandale Beach, FL | 2.0 | 2.0 | 918 | $2,200 | $2.40 | 26d | 1 | 0.27mi |
| 220 SW 9th Ave Hallandale Beach, FL | 1.0–2.0 | 1.0–2.0 | 771 | $2,200 | $2.85 | 22d | 2 | 0.28mi |
| 1056 SW 2nd St Unit 1056 Hallandale Beach, FL | 3.0 | 2.0 | 1000 | $3,300 | $3.30 | 26d | 1 | 0.42mi |
| 1033 SW 3rd St Hallandale Beach, FL | 2.0 | 1.0 | 875 | $2,800 | $3.20 | 26d | 1 | 0.43mi |
| 1077 SW 2nd St Unit 2 Hallandale Beach, FL | 2.0 | 1.0 | 1829 | $2,500 | $1.37 | 9d | 1 | 0.44mi |
| 220 SW 3rd Ave Hallandale Beach, FL | 4.0 | 2.0 | 1734 | $4,500 | $2.60 | 26d | 1 | 0.48mi |
| 220 SW 3rd Ave Hallandale Beach, FL | 4.0 | 2.0 | 1734 | $4,800 | $2.77 | 9d | 1 | 0.48mi |
| 401 SW 10th Ter Unit A Hallandale Beach, FL | 2.0 | 1.0 | 1200 | $2,400 | $2.00 | 22d | 1 | 0.53mi |
| 852 NW 8th St #852 Hallandale Beach, FL | 3.0 | 2.0 | 1170 | $2,800 | $2.39 | 23d | 1 | 0.56mi |
| 322 SW 11th Ave Hallandale Beach, FL | 3.0 | 1.0 | 1200 | $2,699 | $2.25 | 26d | 1 | 0.56mi |
| 212 SW 1st Ave Hallandale Beach, FL | 4.0 | 3.0 | 1800 | $10,000 | $5.56 | 26d | 1 | 0.58mi |
| 644 SW 7th Ct Hallandale Beach, FL | 3.0 | 2.0 | 1492 | $3,800 | $2.55 | 4d | 1 | 0.59mi |
| 301 SW 5th St Hallandale Beach, FL | 2.0 | 2.0 | 1792 | $4,000 | $2.23 | 22d | 1 | 0.59mi |
| 712 SW 7th Ter Hallandale Beach, FL | 4.0 | 3.0 | 1356 | $4,500 | $3.32 | 22d | 1 | 0.60mi |
| 90 SW 3rd St Unit 2400 Hallandale Beach, FL | 2.0 | 2.0 | 1079 | $3,700 | $3.43 | 26d | 1 | 0.62mi |
| 839 SW 8th St #1 Hallandale Beach, FL | 2.0 | 1.5 | 1300 | $1,500 | $1.15 | 23d | 1 | 0.66mi |
| 841 NW 10th St Hallandale Beach, FL | 3.0 | 2.0 | 1485 | $3,100 | $2.09 | 9d | 1 | 0.68mi |
| 841 NW 10th St Unit 841C Hallandale Beach, FL | 3.0 | 2.0 | 1585 | $3,200 | $2.02 | 21d | 1 | 0.68mi |
| 208 NE 2nd Ave Hallandale Beach, FL | 4.0 | 2.0 | 1542 | $4,650 | $3.02 | 26d | 1 | 0.72mi |
| 707 SW 3rd Ave Hallandale Beach, FL | 3.0 | 2.0 | 1369 | $5,500 | $4.02 | 6d | 1 | 0.72mi |
| 421 W Pembroke Rd Hallandale Beach, FL | 4.0 | 2.0 | 1250 | $3,999 | $3.20 | 26d | 1 | 0.75mi |
| 211 SE 4th St #3 Hallandale Beach, FL | 3.0 | 2.5 | 1290 | $3,950 | $3.06 | 26d | 1 | 0.82mi |
| 215 SE 5th St Hallandale Beach, FL | 2.0–3.0 | 2.0 | 1133 | $3,675 | $3.24 | 26d | 5 | 0.86mi |
| 223 SW 10th St Hallandale Beach, FL | 3.0 | 3.0 | 1289 | $3,900 | $3.03 | 26d | 1 | 0.88mi |
| 401 N Federal Hwy Hallandale Beach, FL | 1.0–3.0 | 1.0–2.0 | 973 | $3,638 | $3.74 | 17d | 48 | 0.95mi |
| 200 E Pembroke Rd Hallandale Beach, FL | 3.0 | 1.0–2.0 | 1006 | $4,120 | $4.10 | 0d | 63 | 0.98mi |
| 110 N Federal Hwy #1401 Hallandale Beach, FL | 2.0 | 2.0 | 1220 | $3,999 | $3.28 | 9d | 1 | 0.99mi |
| 211 SE 9th St Hallandale Beach, FL | 4.0 | 3.0 | 1540 | $4,250 | $2.76 | 26d | 1 | 1.01mi |
| 1306 S 29th Ave Hollywood, FL | 3.0 | 2.0 | 1500 | $3,300 | $2.20 | 20d | 1 | 1.04mi |
| 1120 S 28th Ave Hollywood, FL | 4.0 | 2.0 | 1576 | $4,275 | $2.71 | 3d | 1 | 1.09mi |
| 2917 Plunkett St Unit 15C Hollywood, FL | 2.0 | 1.0 | 900 | $1,950 | $2.17 | 9d | 1 | 1.11mi |
| 2740 Dewey St Hollywood, FL | 3.0 | 1.0 | 1191 | $2,900 | $2.43 | 14d | 1 | 1.17mi |
| 2648 Washington St Hollywood, FL | 2.0 | 1.0 | 1193 | $2,800 | $2.35 | 26d | 1 | 1.21mi |
| 3001 SW 35th Ave West Park, FL | 2.0 | 1.0 | 1050 | $2,400 | $2.29 | 18d | 1 | 1.21mi |
| 3720 SW 32nd Ave West Park, FL | 4.0 | 3.0 | 1100 | $3,850 | $3.50 | 26d | 1 | 1.22mi |
| 2849 Dewey St Unit 2849 Hollywood, FL | 2.0 | 2.0 | 1265 | $2,600 | $2.06 | 12d | 1 | 1.23mi |
| 2849 Dewey St Unit 2849 Hollywood, FL | 2.0 | 2.0 | 1265 | $2,600 | $2.06 | 9d | 1 | 1.23mi |
| 2750 Washington St Hollywood, FL | 2.0 | 1.0 | 1053 | $3,300 | $3.13 | 4d | 1 | 1.23mi |
| 2750 Washington St Hollywood, FL | 2.0 | 1.0 | 1053 | $3,500 | $3.32 | 16d | 1 | 1.23mi |
| 906 NE 6th St Hallandale Beach, FL | 3.0 | 2.0 | 1080 | $4,250 | $3.94 | 13d | 1 | 1.24mi |
Listing history 4 events
-
2025-06-10status Pending
-
2025-04-29$349,000 Active
-
1985-04-01soldstatus $42,500
-
1968-04-01soldstatus $12,000
ⓘ Source: listings_history table (triggers on properties + properties_extension) + one-shot
backfill from property_details.listing_events for pre-trigger history.
Tax reassessment forecast FL · Resets to sale price
- Current annual tax
- $7,863 · $655/mo
- Projected year-2 tax
- $7,863 · $655/mo
- Expected delta
- $0/yr ($0/mo · -0.0%)
ⓘ Screening estimate from a state-policy table — verify with the county assessor before closing.
Climate risk First Street
- Flood 5/10 Major FEMA zone X (unshaded) · 24% chance over 30 yrs
- Wildfire 1/10 Low
- Heat 10/10 Extreme 7 d/yr ≥105°F today · 26 d/yr by 30 yrs out
- Wind 10/10 Extreme 99% chance of damaging wind over 30 yrs
- Air quality 2/10 Low 2 unhealthy d/yr today · 2 by 30 yrs out
Nearby sold comps map
Loading sold comps map…
Walkable amenities ~0.75 mi
Loading nearby amenities…
Taxation est. · year 1
- Rental income
- $40,544
- − Mortgage interest
- −$19,549
- − Property taxes
- −$7,863
- − Insurance
- −$1,745
- − Repairs & maintenance
- −$3,244
- − Management
- −$3,244
- − Depreciation
- −$10,153
- Taxable loss
- −$5,254
- Est. tax savings @ 24.0%
- +$1,261
- After-tax cash flow
- $1,720/yr
For passive investors: Depreciation is non-cash, so a rental often shows a tax loss while cash-flowing — sheltering income. Rental losses are passive: they offset passive income freely, and up to $25,000/yr can offset ordinary (W-2) income if you actively participate and your MAGI is under $100k (phasing out to $0 by $150k); unused losses carry forward. On sale, claimed depreciation is recaptured at up to 25%, and gains may owe capital-gains tax (a 1031 exchange can defer both). Figures are a year-1 estimate at your 24.0% rate — not tax advice; consult a CPA.
Schools (NCES district)
- District
- Broward
- NCES district ID
- 1200180
- Math proficiency
- 42% ▼ -18.00%
- Reading proficiency
- 53% ▼ -5.00%
- Median HH income
- $52,139
- Composite
- 40.88/100
- National rank
- #3621
- State rank
- #46 of 73 in FL
Livability — Hallandale Beach
- Score
- 81/100
- State rank
- #86
- US rank
- #1400
Category grades
Schools grade is shown separately in the Schools card above.
Census & demographics
- Census place
- Hallandale Beach, FL
- County
- Broward County · 1,963,430 people
- City population
- 44,021
- Metro
- Miami-Fort Lauderdale-Pompano Beach, FL
- Population (ZIP)
- 44,502
- Household income
- $52,079
- Rent vs Own
- Severe rent burden
- 3293.0
Population outlook (Broward County) Hauer SSP2
- Today (2025)
- 2,207,033 people
- By 2030
- 2,360,704 · +7.0%
- By 2040
- 2,661,208 · +20.6%
- By 2050
- 2,946,698 · +33.5%
- By 2075
- 3,602,273 · +63.2%
- By 2100
- 3,970,984 · +79.9%
Race, ethnicity, and origin ACS 2023
- Neighborhood character
- Diverse neighborhood (Simpson 0.67)
- Race & ethnicity
- Hispanic / Latino 39% White 39% Two or more races 24% Black 17% Asian 1%
- Hispanic origin (detail)
- Mexican 2% Puerto Rican 3% Cuban 9% Dominican 3% Salvadoran 2%
- Common ancestry
- Scotch-Irish 5% Hispanic 5% Subsaharan African 3%
- Foreign-born
- 51% · Canada, Jamaica, Dominican Republic
- Languages at home
- 38% English-only · Spanish 36% Russian/Polish/Slavic 12% French/Haitian/Cajun 7%
Political lean MEDSL · Broward
- 2024 margin
- D (+17.0) · D 58.0% · R 41.0%
- 2008→2024 swing
- -17.8pp toward R · 2008: 34.7pp · 2024: 17.0pp
- All cycles
- 2024: D+17.0 2020: D+29.8 2016: D+35.0 2012: D+34.9 2008: D+34.7
Not yet ingested
- Civics
- —
Market trends
- HPI YoY
- ▼ -299.13%
- Current HPI
- 329.9081
- Rent YoY
- ▲ 0.43%
- Metro
- Miami-Fort Lauderdale-Pompano Beach, FL
- State GDP YoY
- ▲ 3.28%
- F500 in state
- 36
Industry mix (Fortune 500 HQ in FL)
| Industry | F500 HQs | Revenue |
|---|---|---|
| Industrial Technology | 2 | $29B |
|
||
| Insurance | 2 | $17B |
|
||
| Retail | 1 | $60B |
|
||
| Technology Distribution | 1 | $58B |
|
||
| Homebuilding | 1 | $35B |
|
||
| Technology Manufacturing | 1 | $35B |
|
||
Price history
+2808.3% since first listed4 events — show timeline
- 2025-06-10 Pending — MARMLS
- 2025-04-29 Listed $349,000 MARMLS
- 1985-04-01 Sold (Public Records) $42,500 Public Records
- 1968-04-01 Sold (Public Records) $12,000 Public Records
Property tax history
+23.3%/yrLatest (2025): $7,863 · +9.4% YoY. Source: county tax records.
Cash-flow waterfall
monthlySold comps — $/sqft
last 12 mo · ≤1 miLoading sold comps…