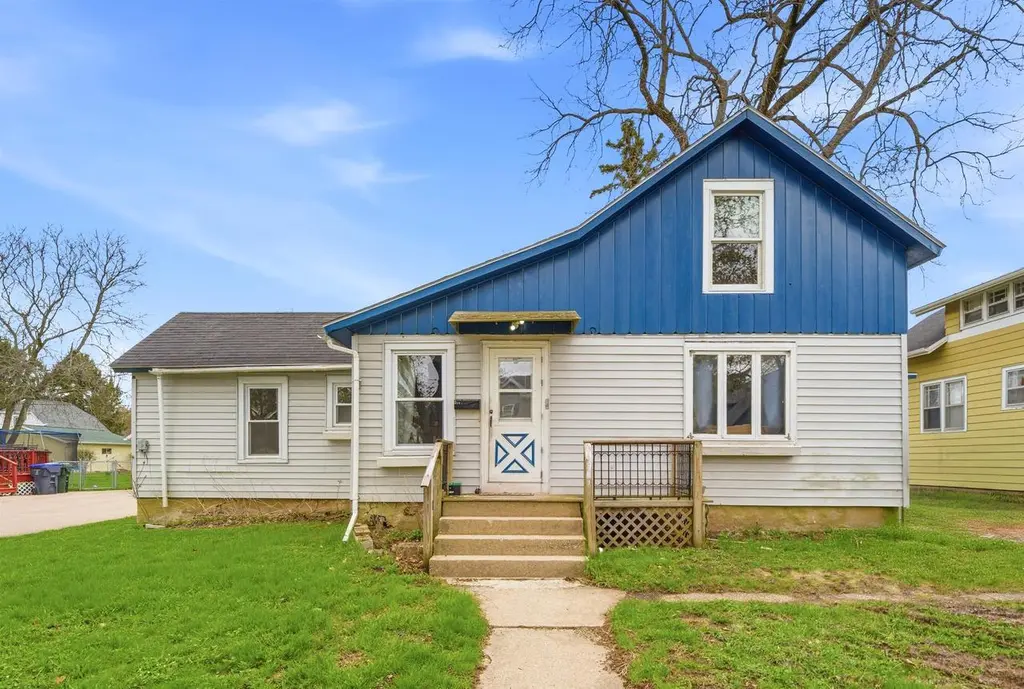
314 E Hancock St · New London, WI
Flood risk 1/10 · Minimal
- FEMA flood zone
- X (unshaded)
- Chance of flooding over 30 yrs
- 0.0%
- Est. flood insurance / yr
- $473 – $860
Fire risk 2/10 · Minimal
- Est. fire insurance / yr
- $636 – $1,182
Heat risk 2/10 · Minimal
- Hot days now (above 98°F)
- 7 days/yr
- Hot days in 30 yrs
- 12 days/yr
Wind risk 2/10 · Minimal
- Chance of severe wind over 30 yrs
- —
Air-quality risk 2/10 · Minimal
- Unhealthy air days now
- 1 days/yr
- Unhealthy air days in 30 yrs
- 1 days/yr
Risk factors via First Street. Map © Google.
Why this score? — see what drove the B- grade
The composite is a weighted blend of 9 inputs, each scored 0–100. Each bar is that input's sub-score; the figure is the points it added to the 100-point composite (weight × sub-score).
- Cash flow +30.0/30.0
- 1% rule +10.0/10.0
- DSCR +10.0/10.0
- ARV discount +7.5/15.0
- Schools +3.7/10.0
- Livability +3.6/5.0
- Rent growth +2.5/5.0
- Condition / age +2.5/5.0
- Appreciation +0.0/10.0
$149,900
🖨 Deal sheet 📄 Offer letter ✓ Due diligence
Listing remarks
Opportunity awaits in this charming New London home! Featuring 3 bedrooms and 1 full bath, the layout offers flexibility with two bedrooms on the main level and a spacious upper-level third bedroom - perfect for a private retreat, office, or bonus space. Recent updates include newer flooring and fresh paint in many areas, giving you a great head start. With a little TLC and your personal touch, this home has the potential to truly shine. Outside, you?ll find a large backyard with plenty of space for entertaining, gardening, or relaxing. Whether you're a first-time buyer, investor, or someone looking to build equity, this home is priced to sell and full of opportunity. Schedule your showing
Key facts
- 7,405 sq ft lot
- Built 1920
- Listed 50 days
Property features AI
Finance
- Other: Lot size approximately 0.17 acre (zoned Residential)
Exterior
- Utilities: Municipal water; Municipal sewer
- Home design: 1.5-story single-family home; Construction completed
- Construction: Assessor/Public Record for year built
- Exterior features: Vinyl and cedar exterior
Interior
- Kitchen: Kitchen on main level — 17 x 10
- Bedrooms: Master bedroom (Main) — 14 x 10; Bedroom 2 (Main) — 11 x 9; Bedroom 3 (Upper) — 24 x 12
- Bathrooms: 1 full bathroom
- Heating & cooling: Forced air heating; Natural gas heat
- Interior features: Full stone basement
Neighborhood map
What this means for you Summary
Snapshot
- This is a 3-bed/1.0-bath other listed at $150k.
Deal economics
- At list price, monthly cash flow is $990 ($12k/yr) — positive.
- The deal already cash-flows at list — no discount required.
- Meets the 1% rule at list price ($2k rent vs $150k).
- Recommended offer: $145k (3.0% below list) — sets the bar for market timing.
- Cap rate 14.2% vs local median 4.9% in New London — top-decile yield for the area; either an underpriced asset or a hidden risk that comps aren't pricing in. Stress-test before assuming the spread holds.
Location & tenants
- Location reads 71/100 on livability (#268 in WI) — a middle-class / working-renter tenant base. Strengths: crime A+, cost of living A+, housing A+; Watch: schools D+, amenities F, commute F.
- New London School District (town): math 48% / reading 37% proficiency, ranked #120 of 342 in WI (top 35%) — families likely to look elsewhere, expect single-tenant / working-renter base with shorter leases.
- Market conditions: 39 active listings in the ZIP; 5 comparable units currently listed for rent nearby; rentals at typical pace (median 21d on market — plan ~3-4 weeks tenant-placement turnaround); 460 units permitted in Outagamie County in 2024 (30 in 5+ unit buildings).
Forward outlook
- Local home prices are declining (-3.0%/yr); year-one equity from $1k of loan paydown is wiped out by about $4k of value loss. Plan a longer hold.
- Outagamie County population projected at +8% by 2050 — modest demand growth; plan on rents tracking national, not racing it.
- At projected returns (-3.0% appreciation + 3.0% rent growth), your $42k cash investment doubles in ~5 years — after that, you're playing with house money.
Negotiation context
- It's been on market 50 days — a 3% lower offer ($145k) is reasonable based on typical stale-listing flexibility.
- Current owner paid $122k; 23% above their basis — modest negotiation headroom, anchor on the comps not their cost.
Risks & watch-outs
- Watch-outs: built in 1920 — expect roof / HVAC / electrical / plumbing capex.
Questions for the listing agent
- It's been on market 50 days. Have you received any prior offers? Is the seller open to a 3% concession, seller financing, or rate buy-down credit?
- Built in 1920 — when were the roof, HVAC, electrical panel, plumbing, and water heater last replaced?
- Is there a deadline driving the sale (1031 exchange, divorce, estate, relocation)? That informs how much negotiation room exists.
- Schools are D-rated, which usually means shorter tenancies and higher turnover. Who's the typical renter profile here, and what's been the actual vacancy rate?
- What's the average days-on-market for RENTAL listings here right now (not sales)? A rising rental-DOM trend means longer vacancies and softer asking-rent achievability than the comps imply.
- What's the recent tenant-quality profile in this submarket — average credit score on applications, eviction rate, late-payment / NSF rate, and stable-employment percentage? A property-management company in the area should have these aggregated.
- How much new for-sale + rental construction is in the pipeline within 1–3 miles? Heavy new supply typically softens prices + rents 12–24 months out; constrained supply supports both.
Investment metrics
- 1% rule
- 1.66% ✓
- Cap rate
- 14.22%
- Cash-on-cash
- 28.31%
- DSCR
- 2.26
- GRM
- 5.0
CMA / ARV
No comps found within radius.
Projected returns pro-forma
-3.0% appreciation · 3.0% rent growth · sell at horizon
- IRR
- 22.5%
- Equity multiple
- 1.92×
- Total profit
- $38,782
- Equity at exit
- $22,351
- IRR
- 30.5%
- Equity multiple
- 3.74×
- Total profit
- $114,993
- Equity at exit
- $12,961
Cash invested: $41,972 (down + closing). Projections, not guarantees.
Landlord ↔ Tenant lean methodology
- Overall (STATE)
- 73 Landlord-Friendly
- State Wisconsin
- 73 Landlord-Friendly · R+2
- County
- — inherits STATE
- City
- — inherits STATE
ZIP-level market 54961
- Home prices YoY
- -32.2%
- Active inventory
- 39
- Price-to-rent
- 5.0×
Monthly cashflow live
- Estimated rent
- $2,492 high interval (Pro) →
- Mortgage (P&I)
- −$786
- Tax from tax record
- −$130 /mo · $1,557/yr
- Insurance
- −$62
- HOA
- −$0
- Vacancy / Maint / Mgmt
- −$523
- Net cashflow
- $990
Break-even live
UW: 25.0% down · 7.5% · 30yr · 1.5% tax · 5.0% vac · 8.0% maint · 8.0% mgmt
Financing live
Cash to close
- Down payment
- $37,475
- Closing costs
- $4,497
- Reserves months
- —
- Total cash needed
- —
Loan-product check · same deal, 3 products live
Conventional
25% down · 7.5% · 30yr
- Down + closing
- —
- Monthly P&I
- —
- Monthly cashflow
- —
- DSCR
- —
- Eligible?
- —
Personal DTI + credit; lowest rate.
DSCR
20% down · 8.5% · 30yr
- Down + closing
- —
- Monthly P&I
- —
- Monthly cashflow
- —
- DSCR
- —
- Eligible?
- —
No personal income docs; deal must DSCR.
Hard money
10% down · 12.0% · 12mo
- Down + closing
- —
- Monthly P&I
- —
- Monthly cashflow
- —
- DSCR
- —
- Eligible?
- —
Short-term bridge; refi at stabilization.
Rent comps 5 comps
| Address | Beds | Baths | Sqft | Rent | $/sqft | DOM | Units | Dist |
|---|---|---|---|---|---|---|---|---|
| 305 W Wolf River Ave Unit WR 305-410 New London, WI | 2.0 | 2.0 | 1279 | $2,625 | $2.05 | 21d | 1 | 0.45mi |
| 305 W Wolf River Ave Unit WR 305-210 New London, WI | 2.0 | 2.0 | 1279 | $2,550 | $1.99 | 21d | 1 | 0.45mi |
| 305 W Wolf River Ave Unit WR 305-238 New London, WI | 2.0 | 2.0 | 1220 | $2,425 | $1.99 | 21d | 1 | 0.45mi |
| 305 W Wolf River Ave Unit WR 305-300 New London, WI | 2.0 | 2.0 | 1220 | $2,350 | $1.93 | 21d | 1 | 0.45mi |
| 305 W Wolf River Ave Unit WR 305-438 New London, WI | 2.0 | 2.0 | 1220 | $2,500 | $2.05 | 21d | 1 | 0.45mi |
Listing history 19 events
-
2026-06-18days on market $149,900 Active 50 DOM
-
2026-06-17days on market $149,900 Active 49 DOM
-
2026-06-16days on market $149,900 Active 48 DOM
-
2026-06-15days on market $149,900 Active 47 DOM
-
2026-06-15days on market $149,900 Active 46 DOM
-
2026-06-13days on market $149,900 Active 45 DOM
-
2026-06-12days on market $149,900 Active 44 DOM
-
2026-06-09days on market $149,900 Active 41 DOM
-
2026-06-08days on market $149,900 Active 40 DOM
-
2026-06-08days on market $149,900 Active 39 DOM
-
2026-06-05days on market $149,900 Active 37 DOM
-
2026-06-03days on market $149,900 Active 35 DOM
-
2026-06-02days on market $149,900 Active 34 DOM
-
2026-06-01days on market $149,900 Active 33 DOM
-
2026-05-31days on market $149,900 Active 32 DOM
-
2026-04-29$149,900 Active
-
2023-10-18soldstatus $122,200
-
2013-01-08soldstatus $41,500
-
2004-08-18soldstatus $64,000
ⓘ Source: listings_history table (triggers on properties + properties_extension) + one-shot
backfill from property_details.listing_events for pre-trigger history.
Tax reassessment forecast WI · Partial reset (capped growth)
- Current annual tax
- $1,557 · $130/mo
- Projected year-2 tax
- $2,165 · $180/mo
- Expected delta
- +$608/yr (+$51/mo · 39.1%)
ⓘ Screening estimate from a state-policy table — verify with the county assessor before closing.
Climate risk First Street
- Flood 1/10 Low FEMA zone X (unshaded) · 0% chance over 30 yrs
- Wildfire 2/10 Low
- Heat 2/10 Low 7 d/yr ≥98°F today · 12 d/yr by 30 yrs out
- Wind 2/10 Low
- Air quality 2/10 Low 1 unhealthy d/yr today · 1 by 30 yrs out
Nearby sold comps map
Loading sold comps map…
Walkable amenities ~0.75 mi
Loading nearby amenities…
Taxation est. · year 1
- Rental income
- $29,902
- − Mortgage interest
- −$8,397
- − Property taxes
- −$1,557
- − Insurance
- −$750
- − Repairs & maintenance
- −$2,392
- − Management
- −$2,392
- − Depreciation
- −$4,361
- Taxable income
- $10,054
- Est. tax owed @ 24.0%
- −$2,413
- After-tax cash flow
- $9,470/yr
For passive investors: Depreciation is non-cash, so a rental often shows a tax loss while cash-flowing — sheltering income. Rental losses are passive: they offset passive income freely, and up to $25,000/yr can offset ordinary (W-2) income if you actively participate and your MAGI is under $100k (phasing out to $0 by $150k); unused losses carry forward. On sale, claimed depreciation is recaptured at up to 25%, and gains may owe capital-gains tax (a 1031 exchange can defer both). Figures are a year-1 estimate at your 24.0% rate — not tax advice; consult a CPA.
Schools (NCES district)
- District
- New London School District
- NCES district ID
- 5510590
- Math proficiency
- 48% ▼ -3.00%
- Reading proficiency
- 37% ▼ -5.00%
- Median HH income
- $55,684
- Composite
- 37.17/100
- National rank
- #4480
- State rank
- #120 of 342 in WI
Livability — New London
- Score
- 71/100
- State rank
- #268
- US rank
- #6862
Category grades
Schools grade is shown separately in the Schools card above.
Census & demographics
- Census place
- New London, WI
- Population (ZIP)
- 14,310
Population outlook (Outagamie County) Hauer SSP2
- Today (2025)
- 195,863 people
- By 2030
- 201,154 · +2.7%
- By 2040
- 209,053 · +6.7%
- By 2050
- 211,957 · +8.2%
- By 2075
- 214,299 · +9.4%
- By 2100
- 200,825 · +2.5%
Race, ethnicity, and origin ACS 2023
- Neighborhood character
- Predominantly White (90%)
- Race & ethnicity
- White 90% Hispanic / Latino 5% Two or more races 4% Asian 1% Black 1%
- Common ancestry
- Romanian 7% Portuguese 5% Lithuanian 4%
- Foreign-born
- 1% · Canada
- Languages at home
- 95% English-only · Spanish 3%
Political lean MEDSL · Outagamie
- 2024 margin
- R (+10.2) · D 44.2% · R 54.4% · Other 1.5%
- 2008→2024 swing
- -21.8pp toward R · 2008: 11.6pp · 2024: -10.2pp
- All cycles
- 2024: R+10.2 2020: R+9.9 2016: R+12.6 2012: R+1.8 2008: D+11.6
Not yet ingested
- Civics
- —
Market trends
- HPI YoY
- ▼ -102.06%
- Current HPI
- 214.5592
- Rent YoY
- —
- Metro
- —
- State GDP YoY
- ▲ 2.10%
- F500 in state
- 20
Industry mix (Fortune 500 HQ in WI)
| Industry | F500 HQs | Revenue |
|---|---|---|
| Industrial Machinery | 4 | $23B |
|
||
| Industrial Technology | 2 | $36B |
|
||
| Insurance | 1 | $36B |
|
||
| Professional Services | 1 | $19B |
|
||
| Utilities | 1 | $9B |
|
||
| Consumer Goods | 1 | $3B |
|
||
Price history
+134.2% since first listed4 events — show timeline
- 2026-04-29 Listed $149,900 RANW
- 2023-10-18 Sold (Public Records) $122,200 Public Records
- 2013-01-08 Sold (Public Records) $41,500 Public Records
- 2004-08-18 Sold (Public Records) $64,000 Public Records
Property tax history
+1.5%/yrLatest (2025): $1,557 · +14.2% YoY. Source: county tax records.
Cash-flow waterfall
monthlySold comps — $/sqft
last 12 mo · ≤1 miLoading sold comps…