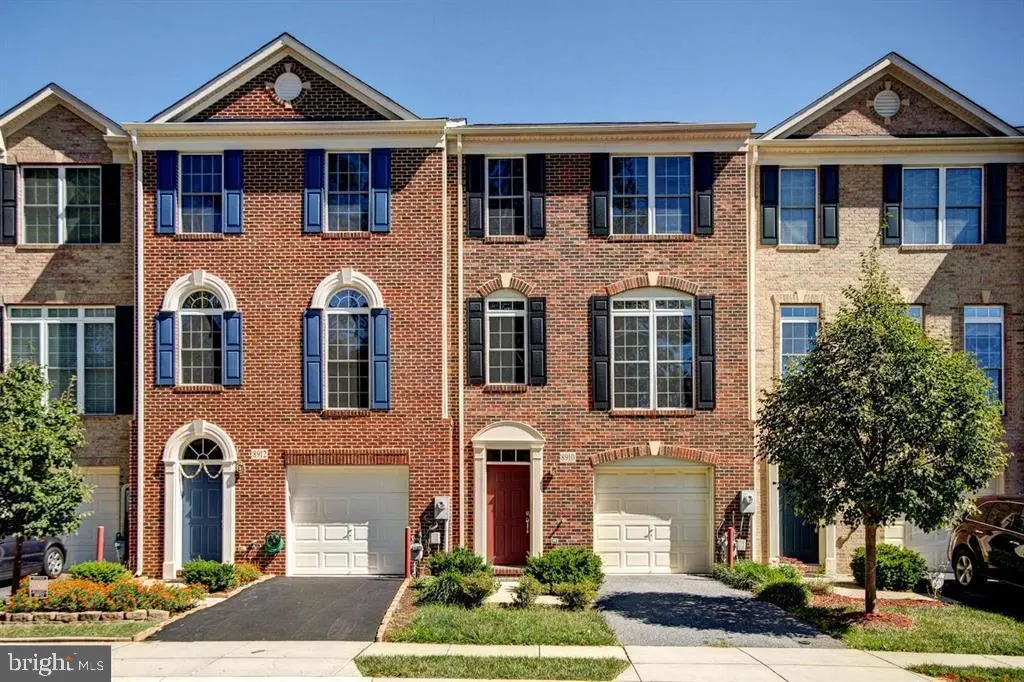
8910 Dawson Manor Dr · Ellicott City, MD
Flood risk 1/10 · Minimal
- FEMA flood zone
- X (unshaded)
- Chance of flooding over 30 yrs
- 0.0%
- Est. flood insurance / yr
- $507 – $1,088
Fire risk 1/10 · Minimal
- Est. fire insurance / yr
- $755 – $1,403
Heat risk 7/10 · Major
- Hot days now (above 103°F)
- 7 days/yr
- Hot days in 30 yrs
- 15 days/yr
Wind risk 4/10 · Minor
- Chance of severe wind over 30 yrs
- 15.0%
Air-quality risk 4/10 · Minor
- Unhealthy air days now
- 5 days/yr
- Unhealthy air days in 30 yrs
- 6 days/yr
Risk factors via First Street. Map © Google.
Why this score? — see what drove the D- grade
The composite is a weighted blend of 9 inputs, each scored 0–100. Each bar is that input's sub-score; the figure is the points it added to the 100-point composite (weight × sub-score).
- Cash flow +11.9/30.0
- ARV discount +5.5/15.0
- Schools +4.1/10.0
- Livability +3.8/5.0
- DSCR +3.5/10.0
- 1% rule +3.3/10.0
- Rent growth +2.5/5.0
- Condition / age +2.5/5.0
- Appreciation +0.0/10.0
$595,000
🖨 Deal sheet 📄 Offer letter ✓ Due diligence
Listing remarks MLS
Must see! Fully renovated!! Gleaming hardwood floors, granite counter tops, sun room, open floor plan, MBR suite w/ private bath, jacuzzi tub and stand up shower, fully finished basement with walkout door, recessed lights, and more! Nice back yard with deck and 1 car garage. shows very well. Great location, close to shopping, schools and public transportation, and community pool.
Key facts
- $62 HOA
- Garage
- Built 2005
Property features AI
Finance
- Other: Ownership: Fee simple; Front foot fee of $48.50 paid annually
- HOA & community: Monthly HOA fee of $62.28
Exterior
- Parking: Front-entry attached garage (1 garage space); Driveway parking (1 space); Total of 2 garage/parking spaces
- Utilities: Public water; Public sewer; Natural gas service; Electric service for cooling/heating systems
- Home design: Interior townhouse/rowhouse; Brick construction with brick front; Estimated year built; Very good condition
- Construction: Brick exterior; Other foundation type; Above-grade and below-grade structures
- Exterior features: Rear fencing
Interior
- Kitchen: Kitchen island; Double oven; Gas range/oven; Refrigerator; Dishwasher; Disposal
- Bedrooms: Three bedrooms on the upper level (primary and two additional bedrooms)
- Flooring: Hardwood; Carpet; Ceramic tile
- Bathrooms: Two full bathrooms (on upper level); Two half bathrooms (one on main level, one on lower level)
- Heating & cooling: 90% efficient forced air heating; Natural gas heating and hot water; Central air conditioning; Ceiling fans; Electric cooling components
- Interior features: Attic; Tub with shower; Walk-in shower; Ceiling fans; Kitchen island; Master bathroom; Walk-in closets; Connecting stairway to basement; Daylight full basement with rear entrance; Heated basement; Basement designed with space for finished rooms; Sump pump
- Laundry & utility: Washer; Dryer
Neighborhood map
What this means for you Summary
Snapshot
- This is a 3-bed/2.5-bath townhouse listed at $595k.
Deal economics
- At list price, monthly cash flow is $-153 ($-2k/yr) — negative.
- To cash-flow at today's rent, offer at most $568k (4.5% below list).
- To meet the 1% rule (rent ≥ 1% of price), the offer needs to be $494k (17.0% below list).
- Recommended offer: $494k (17.0% below list) — sets the bar for 1% rule.
- Cap rate 6.0% vs local median 2.4% in Ellicott City — top-decile yield for the area; either an underpriced asset or a hidden risk that comps aren't pricing in. Stress-test before assuming the spread holds.
Location & tenants
- Location reads 76/100 on livability (#92 in MD, #3,461 nationally) — a middle-class / working-renter tenant base. Strengths: amenities A+, employment A+, housing A+; Watch: commute D, cost of living F.
- Howard County Public Schools (suburban): math 34% / reading 49% proficiency, ranked #1 of 24 in MD (top 4%) — families likely to look elsewhere, expect single-tenant / working-renter base with shorter leases; only 15% free/reduced lunch — higher-income household profile.
- Market conditions: Rents flat; 190 active listings in the ZIP; 7 comparable units currently listed for rent nearby; rentals at typical pace (median 24d on market — plan ~3-4 weeks tenant-placement turnaround); 43% of comp listings sitting > 30 days — soft ceiling on asking rent; high-income renter base; 881 units permitted in Howard County in 2024 (285 in 5+ unit buildings).
- This rent runs 40% of the median local income ($148k/yr) — at the standard rent-burdened threshold; future hikes will face affordability resistance.
Forward outlook
- Local home prices are declining (-3.0%/yr); year-one equity from $4k of loan paydown is wiped out by about $18k of value loss. Plan a longer hold.
- Howard County population projected at +33% by 2050 — long-run rental-demand tailwind backs the buy-and-hold thesis.
Negotiation context
- Only 8 days on market — expect competitive offers; lowballing is unlikely to land.
- 11 sale attempts since 20y ago; this cycle's ask is 19733% above the opening price — seller raised mid-cycle; expect resistance to lowballs.
- Current owner paid $425k; 40% above their basis — modest negotiation headroom, anchor on the comps not their cost.
Risks & watch-outs
- Climate carrying-cost: extreme-heat days projected 7→15/yr by 2055 (HVAC capex compounding) — expect insurance premiums to compound above CPI over the hold.
Questions for the listing agent
- What do current leases actually rent for vs. the listed asking? Can we see a recent rent roll and the last 12 months of T-12 income?
- What does the HOA fee cover, when was the last increase, and are there any pending special assessments or reserve-fund shortfalls?
- Is there a deadline driving the sale (1031 exchange, divorce, estate, relocation)? That informs how much negotiation room exists.
- Schools are A-rated — typically a magnet for longer-tenancy family renters. What's the average tenant stay here, and is there a school-zone premium baked into asking?
- The area grade is low — what's the realistic commute time and amenity access for the typical tenant pool here? Any planned neighborhood developments (good or bad) we should know about?
- What's the average days-on-market for RENTAL listings here right now (not sales)? A rising rental-DOM trend means longer vacancies and softer asking-rent achievability than the comps imply.
- What's the recent tenant-quality profile in this submarket — average credit score on applications, eviction rate, late-payment / NSF rate, and stable-employment percentage? A property-management company in the area should have these aggregated.
- How much new for-sale + rental construction is in the pipeline within 1–3 miles? Heavy new supply typically softens prices + rents 12–24 months out; constrained supply supports both.
Investment metrics
- 1% rule
- 0.83% ✗
- Cap rate
- 5.98%
- Cash-on-cash
- -1.10%
- DSCR
- 0.95
- GRM
- 10.0
CMA / ARV
- ARV (on-the-fly)
- $569,408
- Comps found
- 5
Show comp detail 5 sales within ~0.75 mi
| Address | Dist | Beds/Ba | Sqft | Sold | Price | $/sf | Match |
|---|---|---|---|---|---|---|---|
| 4861 Lee Hollow Pl | 0.10mi | 4/3.5 (+1) | 2,556 (+11%) | 0mo | $633,000 | $248 | 67 |
| 8915 Lee Manor Dr | 0.10mi | 3/3.5 | 2,556 (+11%) | 14mo | $570,000 | $223 | 61 |
| 4938 Lee Farm Ct #95 | 0.16mi | 2/3.0 (-1) | 2,035 (-11%) | 8mo | $469,900 | $231 | 60 |
| 4945 Webbed Foot Way #57 | 0.12mi | 3/3.0 | 1,971 (-14%) | 14mo | $500,000 | $254 | 57 |
| 4925 Lee Farm Ct #67 | 0.16mi | 3/3.0 | 1,971 (-14%) | 14mo | $500,000 | $254 | 56 |
Match score weights: distance 35% · size 25% · config 20% · recency 20%. Top-matched comps best support the ARV.
Projected returns pro-forma
-3.0% appreciation · 0.1% rent growth · sell at horizon
- IRR
- -21.4%
- Equity multiple
- 0.28×
- Total profit
- $-120,114
- Equity at exit
- $88,716
- IRR
- -23.6%
- Equity multiple
- -0.03×
- Total profit
- $-171,180
- Equity at exit
- $51,445
Cash invested: $166,600 (down + closing). Projections, not guarantees.
Landlord ↔ Tenant lean methodology
- Overall (STATE)
- 27 Tenant-Leaning
- State Maryland
- 27 Tenant-Leaning · D+14
- County
- — inherits STATE
- City
- — inherits STATE
ZIP-level market 21043
- Rents YoY
- 0.1%
- Active inventory
- 190
- Price-to-rent
- 10.0×
Monthly cashflow live
- Estimated rent
- $4,936 high interval (Pro) →
- Mortgage (P&I)
- −$3,120
- Tax from tax record
- −$622 /mo · $7,466/yr
- Insurance
- −$248
- HOA
- −$62
- Vacancy / Maint / Mgmt
- −$1,037
- Net cashflow
- $-153
Break-even live
UW: 25.0% down · 7.5% · 30yr · 1.5% tax · 5.0% vac · 8.0% maint · 8.0% mgmt
Financing live
Cash to close
- Down payment
- $148,750
- Closing costs
- $17,850
- Reserves months
- —
- Total cash needed
- —
Loan-product check · same deal, 3 products live
Conventional
25% down · 7.5% · 30yr
- Down + closing
- —
- Monthly P&I
- —
- Monthly cashflow
- —
- DSCR
- —
- Eligible?
- —
Personal DTI + credit; lowest rate.
DSCR
20% down · 8.5% · 30yr
- Down + closing
- —
- Monthly P&I
- —
- Monthly cashflow
- —
- DSCR
- —
- Eligible?
- —
No personal income docs; deal must DSCR.
Hard money
10% down · 12.0% · 12mo
- Down + closing
- —
- Monthly P&I
- —
- Monthly cashflow
- —
- DSCR
- —
- Eligible?
- —
Short-term bridge; refi at stabilization.
Rent comps 7 comps
| Address | Beds | Baths | Sqft | Rent | $/sqft | DOM | Units | Dist |
|---|---|---|---|---|---|---|---|---|
| 8907 Samuel Joy Way Ellicott City, MD | 4.0 | 3.5 | 2316 | $7,500 | $3.24 | 43d | 1 | 0.10mi |
| 8848 Goose Landing Cir Columbia, MD | 3.0 | 2.5 | 1620 | $2,400 | $1.48 | 43d | 1 | 0.30mi |
| 9562 Old Route 108 Ellicott City, MD | 3.0 | 3.0 | 2481 | $4,072 | $1.64 | 2d | 3 | 1.33mi |
| 9407 Aston Villa #52 Ellicott City, MD | 3.0 | 3.5 | 2000 | $3,600 | $1.80 | 23d | 1 | 1.34mi |
| 9276 Soaring Hill Rd Columbia, MD | 4.0 | 3.0 | 2248 | $3,450 | $1.53 | 43d | 1 | 1.41mi |
| 8698 Open Meadow Way Columbia, MD | 4.0 | 2.5 | 1970 | $3,195 | $1.62 | 11d | 1 | 1.49mi |
| 4711 Leyden Way Ellicott City, MD | 3.0 | 3.5 | 2520 | $2,995 | $1.19 | 23d | 1 | 1.50mi |
HOA detail
- Monthly dues
- $62 · $744/yr
- Likely covers
- pool
Listing history 9 events
-
2026-06-18days on market $595,000 Active 8 DOM
-
2026-06-17days on market $595,000 Active 7 DOM
-
2026-06-16days on market $595,000 Active 6 DOM
-
2026-06-15days on market $595,000 Active 5 DOM
-
2026-06-13statusdays on market $595,000 Active 3 DOM
-
2026-06-09days on market $595,000 Coming Soon 5 DOM
-
2026-06-08days on market $595,000 Coming Soon 4 DOM
-
2026-06-07remarks 693-char remark
-
2026-06-07$595,000 Coming Soon 3 DOM
ⓘ Source: listings_history table (triggers on properties + properties_extension) + one-shot
backfill from property_details.listing_events for pre-trigger history.
Tax reassessment forecast MD · Partial reset (capped growth)
- Current annual tax
- $7,466 · $622/mo
- Projected year-2 tax
- $7,466 · $622/mo
- Expected delta
- $0/yr ($0/mo · 0.0%)
ⓘ Screening estimate from a state-policy table — verify with the county assessor before closing.
Climate risk First Street
- Flood 1/10 Low FEMA zone X (unshaded) · 0% chance over 30 yrs
- Wildfire 1/10 Low
- Heat 7/10 Severe 7 d/yr ≥103°F today · 15 d/yr by 30 yrs out
- Wind 4/10 Moderate 15% chance of damaging wind over 30 yrs
- Air quality 4/10 Moderate 5 unhealthy d/yr today · 6 by 30 yrs out
Nearby sold comps map
Loading sold comps map…
Walkable amenities ~0.75 mi
Loading nearby amenities…
Taxation est. · year 1
- Rental income
- $59,232
- − Mortgage interest
- −$33,329
- − Property taxes
- −$7,466
- − Insurance
- −$2,975
- − Repairs & maintenance
- −$4,739
- − Management
- −$4,739
- − HOA
- −$744
- − Depreciation
- −$17,309
- Taxable loss
- −$12,069
- Est. tax savings @ 24.0%
- +$2,897
- After-tax cash flow
- $1,061/yr
For passive investors: Depreciation is non-cash, so a rental often shows a tax loss while cash-flowing — sheltering income. Rental losses are passive: they offset passive income freely, and up to $25,000/yr can offset ordinary (W-2) income if you actively participate and your MAGI is under $100k (phasing out to $0 by $150k); unused losses carry forward. On sale, claimed depreciation is recaptured at up to 25%, and gains may owe capital-gains tax (a 1031 exchange can defer both). Figures are a year-1 estimate at your 24.0% rate — not tax advice; consult a CPA.
Schools (NCES district)
- District
- Howard County Public Schools
- NCES district ID
- 2400420
- Math proficiency
- 34% ▼ -22.00%
- Reading proficiency
- 49% ▼ -11.00%
- Median HH income
- $108,056
- Composite
- 41.23/100
- National rank
- #3535
- State rank
- #1 of 24 in MD
Livability — Ellicott City
- Score
- 76/100
- State rank
- #92
- US rank
- #3461
Category grades
Schools grade is shown separately in the Schools card above.
Census & demographics
- Census place
- Ellicott City, MD
- County
- Howard County · 282,651 people
- City population
- 91,852
- Metro
- Baltimore-Columbia-Towson, MD
- Population (ZIP)
- 48,525
- Household income
- $148,125
- Rent vs Own
- Severe rent burden
- 1117.0
Population outlook (Howard County) Hauer SSP2
- Today (2025)
- 367,857 people
- By 2030
- 394,054 · +7.1%
- By 2040
- 443,509 · +20.6%
- By 2050
- 488,124 · +32.7%
- By 2075
- 594,860 · +61.7%
- By 2100
- 648,772 · +76.4%
Race, ethnicity, and origin ACS 2023
- Neighborhood character
- Diverse neighborhood (Simpson 0.68)
- Race & ethnicity
- White 49% Asian 25% Black 12% Two or more races 9% Hispanic / Latino 6%
- Hispanic origin (detail)
- Common ancestry
- Romanian 4% Slovak 2% Lithuanian 2%
- Foreign-born
- 25% · Canada, South Korea, China
- Languages at home
- 69% English-only · Other Indo-European 8% Other Asian/Pacific 5% Spanish 4%
Political lean MEDSL · Howard
- 2024 margin
- Solid D (+41.8) · D 69.1% · R 27.4% · Other 3.5%
- 2008→2024 swing
- +19.9pp toward D · 2008: 21.9pp · 2024: 41.8pp
- All cycles
- 2024: D+41.8 2020: D+44.3 2016: D+33.5 2012: D+21.2 2008: D+21.9
Not yet ingested
- Civics
- —
Market trends
- HPI YoY
- ▼ -243.18%
- Current HPI
- 280.1448
- Rent YoY
- ▲ 0.10%
- Metro
- Baltimore-Columbia-Towson, MD
- State GDP YoY
- ▲ 2.97%
- F500 in state
- 12
Industry mix (Fortune 500 HQ in MD)
| Industry | F500 HQs | Revenue |
|---|---|---|
| Aerospace / Defense | 1 | $71B |
|
||
| Utilities | 1 | $25B |
|
||
| Hotels | 1 | $24B |
|
||
| Consumer Goods | 1 | $7B |
|
||
| Real Estate | 1 | $6B |
|
||
| Chemicals | 1 | $2B |
|
||
Price history
+63.1% since first listed38 events — show timeline
- 2026-06-04 Coming Soon $595,000 BRIGHT MLS
- 2024-09-02 Rental Removed $3,000 BRIGHTMLS
- 2024-08-26 Listed for Rent $3,000 BRIGHTMLS
- 2024-08-25 Listing Removed — BRIGHT MLS
- 2024-07-29 Listed $599,000 BRIGHT MLS
- 2014-04-09 Sold (Public Records) $425,000 Public Records
- 2014-04-02 Delisted — MRIS
- 2014-03-22 Sold (MLS) $425,000 BRIGHT MLS
- 2014-03-22 Sold (MLS) $425,000 MRIS
- 2014-03-03 Pending — MRIS
- 2014-02-24 Listing Removed — BRIGHT MLS
- 2014-01-28 Price Changed $439,000 MRIS
- 2013-09-26 Listed $449,000 MRIS
- 2013-09-25 Listed $439,000 BRIGHT MLS
- 2013-09-20 Sold (Public Records) $343,000 Public Records
- 2013-08-15 Sold (MLS) $370,000 BRIGHT MLS
- 2013-08-15 Sold (MLS) $370,000 MRIS
- 2013-04-12 Pending — MRIS
- 2013-04-01 Listing Removed — BRIGHT MLS
- 2012-11-20 Price Changed $415,000 MRIS
- 2012-06-20 Listed $499,000 MRIS
- 2012-06-20 Listed $415,000 BRIGHT MLS
- 2012-05-11 Delisted — MRIS
- 2012-05-11 Listing Removed — BRIGHT MLS
- 2011-09-27 Pending — MRIS
- 2011-09-27 Delisted — MRIS
- 2011-09-14 Price Changed — MRIS
- 2011-06-22 Price Changed — MRIS
- 2011-05-23 Listed — MRIS
- 2011-05-23 Listed $364,900 BRIGHT MLS
- 2008-01-10 Delisted — MRIS
- 2007-11-09 Price Changed — MRIS
- 2007-07-26 Price Changed — MRIS
- 2007-02-06 Delisted — MRIS
- 2007-02-06 Listed — MRIS
- 2006-11-30 Listed — MRIS
- 2006-11-21 Delisted — MRIS
- 2006-04-26 Listed — MRIS
Property tax history
+2.5%/yrLatest (2025): $7,466 · +6.1% YoY. Source: county tax records.
Cash-flow waterfall
monthlySold comps — $/sqft
last 12 mo · ≤1 miLoading sold comps…