20030 Red Oak Dr · Coffee City, TX
Flood risk 1/10 · Minimal
- FEMA flood zone
- X (unshaded)
- Chance of flooding over 30 yrs
- 0.0%
- Est. flood insurance / yr
- $507 – $1,088
Fire risk 4/10 · Minor
- Est. fire insurance / yr
- $1,222 – $2,270
Heat risk 7/10 · Major
- Hot days now (above 109°F)
- 7 days/yr
- Hot days in 30 yrs
- 26 days/yr
Wind risk 6/10 · Moderate
- Chance of severe wind over 30 yrs
- 62.0%
Air-quality risk 1/10 · Minimal
- Unhealthy air days now
- 0 days/yr
- Unhealthy air days in 30 yrs
- 0 days/yr
Risk factors via First Street. Map © Google.
Why this score? — see what drove the C- grade
The composite is a weighted blend of 9 inputs, each scored 0–100. Each bar is that input's sub-score; the figure is the points it added to the 100-point composite (weight × sub-score).
- Cash flow +24.1/30.0
- DSCR +7.8/10.0
- 1% rule +5.4/10.0
- Appreciation +5.0/10.0
- Schools +3.7/10.0
- Livability +3.2/5.0
- Rent growth +2.5/5.0
- Condition / age +2.5/5.0
- ARV discount +0.7/15.0
$114,900
🖨 Deal sheet 📄 Offer letter ✓ Due diligence
Listing remarks MLS
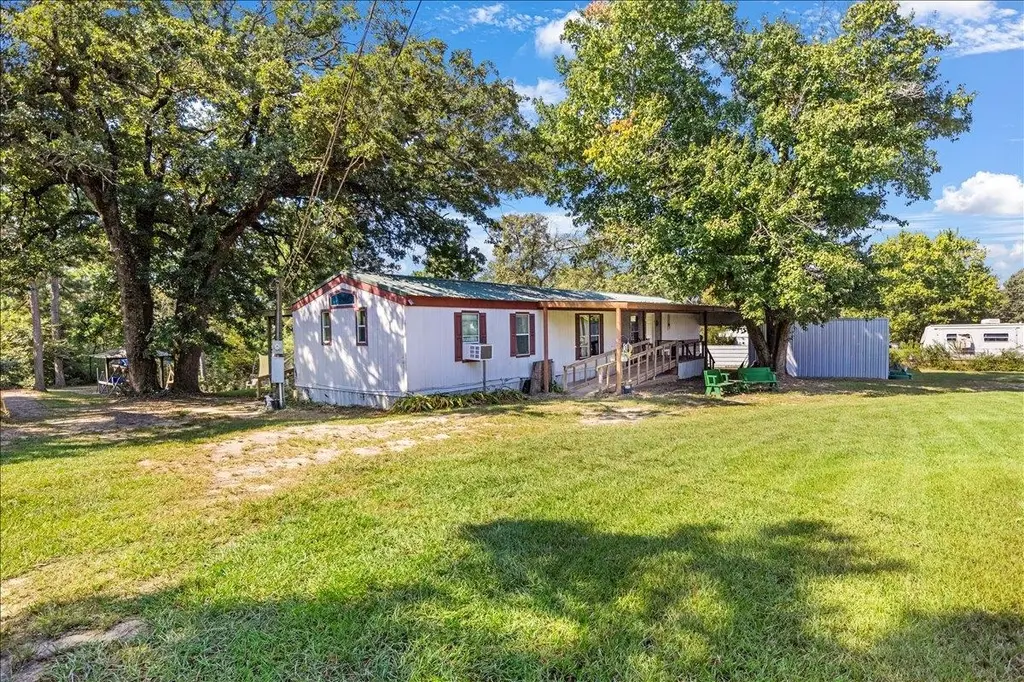
Welcome to this charming 1-story, 3-bedroom, 2-bath mobile home situated on a generous 1-acre lot in LaRue, TX. With 1,368 square feet of living space, this home offers both comfort and functionality in a peaceful country setting. Step inside to an inviting open layout that connects the living room, dining area, and kitchen, creating a bright and welcoming atmosphere for everyday living and entertaining. The kitchen features ample counter space and cabinetry, designed for both convenience and efficiency. The primary bedroom includes a private bath for added comfort, while two additional bedrooms share a second full bath, making it ideal for family or guests. Outside, the expansive yard provides endless possibilities—whether you envision a garden, outdoor entertaining area, or simply space to relax and enjoy the tranquility of East Texas living. With a full acre, there’s plenty of room to expand or customize to fit your lifestyle. Perfect as a starter home, investment property, or peaceful retreat, this LaRue residence offers a wonderful opportunity.
Key facts
- Ample counter space
- Private bath
- Expansive yard
Tags
Neighborhood map
What this means for you Summary
Snapshot
- This is a 3-bed/2.0-bath manufactured listed at $115k.
Deal economics
- At list price, monthly cash flow is $227 ($3k/yr) — positive.
- The deal already cash-flows at list — no discount required.
- Meets the 1% rule at list price ($1k rent vs $115k).
- Recommended offer: $101k (12.0% below list) — sets the bar for market timing.
- Cap rate 8.7% vs local median 3.0% in Coffee City — top-decile yield for the area; either an underpriced asset or a hidden risk that comps aren't pricing in. Stress-test before assuming the spread holds.
Location & tenants
- Location reads 63/100 on livability (#845 in TX) — a middle-class / working-renter tenant base. Strengths: cost of living A+, housing A+; Watch: schools F, amenities F, commute F.
- Brownsboro ISD (rural): math 42% / reading 46% proficiency, ranked #290 of 826 in TX (top 35%) — families likely to look elsewhere, expect single-tenant / working-renter base with shorter leases.
- Market conditions: 98 active listings in the ZIP; 263 units permitted in Henderson County in 2024 (0 in 5+ unit buildings).
Forward outlook
- In year one you build about $4k of equity ($794 loan paydown + $3k appreciation (3.0% local appreciation)).
- At projected returns (3.0% appreciation + 3.0% rent growth), your $32k cash investment doubles in ~5 years — after that, you're playing with house money.
- By year 8, paydown + projected appreciation supports a ~$31k cash-out refi (75% LTV) — recoverable capital for the next deal without selling this one.
Negotiation context
- It's been on market 184 days — a 12% lower offer ($101k) is reasonable based on typical stale-listing flexibility.
- 2 sale attempts with the ask held roughly flat each time — persistent listings suggest the price (not the market) is what's stuck; bring a comps-based counter.
Risks & watch-outs
- Climate carrying-cost: major wind risk, 62% chance of damaging wind over 30y; extreme-heat days projected 7→26/yr by 2055 (HVAC capex compounding) — expect insurance premiums to compound above CPI over the hold.
Questions for the listing agent
- It's been on market 184 days. Have you received any prior offers? Is the seller open to a 12% concession, seller financing, or rate buy-down credit?
- Why hasn't it sold? Are there any deal-killer items the seller is aware of (foundation, flood, title, zoning, code violations)?
- Is there a deadline driving the sale (1031 exchange, divorce, estate, relocation)? That informs how much negotiation room exists.
- Schools are F-rated, which usually means shorter tenancies and higher turnover. Who's the typical renter profile here, and what's been the actual vacancy rate?
- What's the average days-on-market for RENTAL listings here right now (not sales)? A rising rental-DOM trend means longer vacancies and softer asking-rent achievability than the comps imply.
- What's the recent tenant-quality profile in this submarket — average credit score on applications, eviction rate, late-payment / NSF rate, and stable-employment percentage? A property-management company in the area should have these aggregated.
- How much new for-sale + rental construction is in the pipeline within 1–3 miles? Heavy new supply typically softens prices + rents 12–24 months out; constrained supply supports both.
Investment metrics
- 1% rule
- 1.04% ✓
- Cap rate
- 8.67%
- Cash-on-cash
- 8.48%
- DSCR
- 1.38
- GRM
- 8.0
CMA / ARV
- ARV (median comp)
- $99,783
- List price
- $114,900
- Delta
- 15.15%
- Verdict
- OVERPRICED
- Comps
- 2 within 1.0 mi
Show comp detail 2 sales within ~0.75 mi
| Address | Dist | Beds/Ba | Sqft | Sold | Price | $/sf | Match |
|---|---|---|---|---|---|---|---|
| 20414 Hillside Dr | 0.68mi | 3/2.0 | 1,568 (+15%) | 10mo | $89,000 | $57 | 36 |
| 4542 Pineview Dr | 0.55mi | 3/2.0 | 1,190 (-13%) | 22mo | $140,000 | $118 | 34 |
Match score weights: distance 35% · size 25% · config 20% · recency 20%. Top-matched comps best support the ARV.
Projected returns pro-forma
3.0% appreciation · 3.0% rent growth · sell at horizon
- IRR
- 15.4%
- Equity multiple
- 1.88×
- Total profit
- $28,297
- Equity at exit
- $51,664
- IRR
- 17.1%
- Equity multiple
- 3.50×
- Total profit
- $80,419
- Equity at exit
- $79,620
Cash invested: $32,172 (down + closing). Projections, not guarantees.
Landlord ↔ Tenant lean methodology
- Overall (STATE)
- 87 Strongly Landlord-Friendly
- State Texas
- 87 Strongly Landlord-Friendly · R+5
- County
- — inherits STATE
- City
- — inherits STATE
ZIP-level market 75770
- Active inventory
- 98
- Price-to-rent
- 8.0×
Monthly cashflow live
- Estimated rent
- $1,200 medium interval (Pro) →
- Mortgage (P&I)
- −$603
- Tax from tax record
- −$70 /mo · $840/yr
- Insurance
- −$48
- HOA
- −$0
- Vacancy / Maint / Mgmt
- −$252
- Net cashflow
- $227
Break-even live
UW: 25.0% down · 7.5% · 30yr · 1.5% tax · 5.0% vac · 8.0% maint · 8.0% mgmt
Financing live
Cash to close
- Down payment
- $28,725
- Closing costs
- $3,447
- Reserves months
- —
- Total cash needed
- —
Loan-product check · same deal, 3 products live
Conventional
25% down · 7.5% · 30yr
- Down + closing
- —
- Monthly P&I
- —
- Monthly cashflow
- —
- DSCR
- —
- Eligible?
- —
Personal DTI + credit; lowest rate.
DSCR
20% down · 8.5% · 30yr
- Down + closing
- —
- Monthly P&I
- —
- Monthly cashflow
- —
- DSCR
- —
- Eligible?
- —
No personal income docs; deal must DSCR.
Hard money
10% down · 12.0% · 12mo
- Down + closing
- —
- Monthly P&I
- —
- Monthly cashflow
- —
- DSCR
- —
- Eligible?
- —
Short-term bridge; refi at stabilization.
Listing history 19 events
-
2026-06-19days on market $114,900 Active 184 DOM
-
2026-06-18days on market $114,900 Active 183 DOM
-
2026-06-17days on market $114,900 Active 182 DOM
-
2026-06-16days on market $114,900 Active 181 DOM
-
2026-06-15days on market $114,900 Active 180 DOM
-
2026-06-14days on market $114,900 Active 178 DOM
-
2026-06-13days on market $114,900 Active 177 DOM
-
2026-06-10days on market $114,900 Active 175 DOM
-
2026-06-09days on market $114,900 Active 174 DOM
-
2026-06-08days on market $114,900 Active 173 DOM
-
2026-06-07days on market $114,900 Active 172 DOM
-
2026-06-02days on market $114,900 Active 167 DOM
-
2026-06-01days on market $114,900 Active 166 DOM
-
2026-05-31days on market $114,900 Active 165 DOM
-
2026-05-30days on market $114,900 Active 164 DOM
-
2025-09-18$114,900 Active 1077-char remark
Show marketing remark (1070 chars)
Welcome to this charming 1-story, 3-bedroom, 2-bath mobile home situated on a generous 1-acre lot in LaRue, TX. With 1,368 square feet of living space, this home offers both comfort and functionality in a peaceful country setting. Step inside to aninviting open layout that connects the living room, dining area, and kitchen, creating a bright and welcoming atmosphere foreveryday living and entertaining. The kitchen features ample counter space and cabinetry, designed for both convenienceand efficiency. The primary bedroom includes a private bath for added comfort, while two additional bedrooms share asecond full bath, making it ideal for family or guests. Outside, the expansive yard provides endless possibilities—whether youenvision a garden, outdoor entertaining area, or simply space to relax and enjoy the tranquility of East Texas living. With a fullacre, there’s plenty of room to expand or customize to fit your lifestyle. Perfect as a starter home, investment property, orpeaceful retreat, this LaRue residence offers a wonderful opportunity.
-
2025-09-18$114,900 Active 1070-char remark
Show marketing remark (1070 chars)
Welcome to this charming 1-story, 3-bedroom, 2-bath mobile home situated on a generous 1-acre lot in LaRue, TX. With 1,368 square feet of living space, this home offers both comfort and functionality in a peaceful country setting. Step inside to aninviting open layout that connects the living room, dining area, and kitchen, creating a bright and welcoming atmosphere foreveryday living and entertaining. The kitchen features ample counter space and cabinetry, designed for both convenienceand efficiency. The primary bedroom includes a private bath for added comfort, while two additional bedrooms share asecond full bath, making it ideal for family or guests. Outside, the expansive yard provides endless possibilities—whether youenvision a garden, outdoor entertaining area, or simply space to relax and enjoy the tranquility of East Texas living. With a fullacre, there’s plenty of room to expand or customize to fit your lifestyle. Perfect as a starter home, investment property, orpeaceful retreat, this LaRue residence offers a wonderful opportunity.
-
2022-08-17soldstatus
-
1998-12-22soldstatus
ⓘ Source: listings_history table (triggers on properties + properties_extension) + one-shot
backfill from property_details.listing_events for pre-trigger history.
Tax reassessment forecast TX · Resets to sale price
- Current annual tax
- $840 · $70/mo
- Projected year-2 tax
- $2,103 · $175/mo
- Expected delta
- +$1,263/yr (+$105/mo · 150.4%)
ⓘ Screening estimate from a state-policy table — verify with the county assessor before closing.
Climate risk First Street
- Flood 1/10 Low FEMA zone X (unshaded) · 0% chance over 30 yrs
- Wildfire 4/10 Moderate
- Heat 7/10 Severe 7 d/yr ≥109°F today · 26 d/yr by 30 yrs out
- Wind 6/10 Major 62% chance of damaging wind over 30 yrs
- Air quality 1/10 Low 0 unhealthy d/yr today · 0 by 30 yrs out
Nearby sold comps map
Loading sold comps map…
Walkable amenities ~0.75 mi
Loading nearby amenities…
Taxation est. · year 1
- Rental income
- $14,397
- − Mortgage interest
- −$6,436
- − Property taxes
- −$840
- − Insurance
- −$574
- − Repairs & maintenance
- −$1,152
- − Management
- −$1,152
- − Depreciation
- −$3,343
- Taxable income
- $900
- Est. tax owed @ 24.0%
- −$216
- After-tax cash flow
- $2,513/yr
For passive investors: Depreciation is non-cash, so a rental often shows a tax loss while cash-flowing — sheltering income. Rental losses are passive: they offset passive income freely, and up to $25,000/yr can offset ordinary (W-2) income if you actively participate and your MAGI is under $100k (phasing out to $0 by $150k); unused losses carry forward. On sale, claimed depreciation is recaptured at up to 25%, and gains may owe capital-gains tax (a 1031 exchange can defer both). Figures are a year-1 estimate at your 24.0% rate — not tax advice; consult a CPA.
Schools (NCES district)
- District
- Brownsboro ISD
- NCES district ID
- 4811640
- Math proficiency
- 42% ▼ -5.00%
- Reading proficiency
- 46% ▬ 0.00%
- Median HH income
- $45,624
- Composite
- 37.38/100
- National rank
- #4429
- State rank
- #290 of 826 in TX
Livability — Coffee City
- Score
- 63/100
- State rank
- #845
- US rank
- #15290
Category grades
Schools grade is shown separately in the Schools card above.
Census & demographics
- Population (ZIP)
- 2,736
Population outlook (Henderson County) Hauer SSP2
- Today (2025)
- 80,471 people
- By 2030
- 80,608 · +0.2%
- By 2040
- 80,087 · -0.5%
- By 2050
- 78,208 · -2.8%
- By 2075
- 72,423 · -10.0%
- By 2100
- 61,012 · -24.2%
Race, ethnicity, and origin ACS 2023
- Neighborhood character
- Predominantly White (78%)
- Race & ethnicity
- White 78% Black 16% Two or more races 3% Asian 2% Hispanic / Latino 1%
- Common ancestry
- Italian 1% Iranian 1% Portuguese 1%
- Foreign-born
- 2%
- Languages at home
- 91% English-only · Spanish 6% Other Asian/Pacific 2%
Political lean MEDSL · Henderson
- 2024 margin
- Solid R (+63.5) · D 18.0% · R 81.4%
- 2008→2024 swing
- -18.8pp toward R · 2008: -44.6pp · 2024: -63.5pp
- All cycles
- 2024: R+63.5 2020: R+60.2 2016: R+60.0 2012: R+54.8 2008: R+44.6
Not yet ingested
- Civics
- —
Market trends
- HPI YoY
- —
- Current HPI
- —
- Rent YoY
- —
- Metro
- —
- State GDP YoY
- ▲ 3.95%
- F500 in state
- 110
Industry mix (Fortune 500 HQ in TX)
| Industry | F500 HQs | Revenue |
|---|---|---|
| Energy | 16 | $1,198B |
|
||
| Technology | 5 | $198B |
|
||
| Engineering / Construction | 4 | $72B |
|
||
| Energy Services | 3 | $60B |
|
||
| Utilities | 3 | $41B |
|
||
| Healthcare | 2 | $330B |
|
||
Price history
+0.0% since first listed4 events — show timeline
- 2025-09-18 Listed $114,900 LAAR
- 2025-09-18 Listed $114,900 GTAR
- 2022-08-17 Sold (Public Records) — Public Records
- 1998-12-22 Sold (Public Records) — Public Records
Property tax history
+1.4%/yrLatest (2025): $840 · +8.1% YoY. Source: county tax records.
Cash-flow waterfall
monthlySold comps — $/sqft
last 12 mo · ≤1 miLoading sold comps…