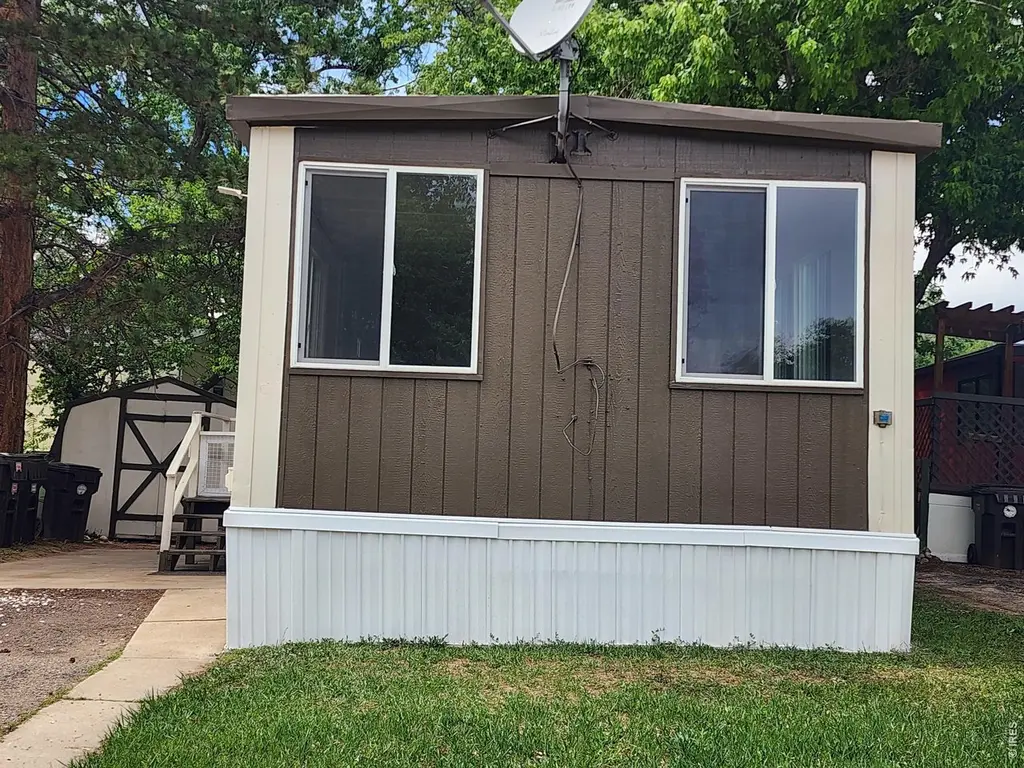
5000 Butte St #107 · Boulder, CO
Flood risk 1/10 · Minimal
- FEMA flood zone
- X (unshaded)
- Chance of flooding over 30 yrs
- 0.0%
- Est. flood insurance / yr
- $507 – $1,088
Fire risk 6/10 · Moderate
- Est. fire insurance / yr
- $939 – $1,743
Heat risk 3/10 · Minor
- Hot days now (above 92°F)
- 7 days/yr
- Hot days in 30 yrs
- 18 days/yr
Wind risk 1/10 · Minimal
- Chance of severe wind over 30 yrs
- —
Air-quality risk 4/10 · Minor
- Unhealthy air days now
- 4 days/yr
- Unhealthy air days in 30 yrs
- 5 days/yr
Risk factors via First Street. Map © Google.
Why this score? — see what drove the B+ grade
The composite is a weighted blend of 9 inputs, each scored 0–100. Each bar is that input's sub-score; the figure is the points it added to the 100-point composite (weight × sub-score).
- Cash flow +30.0/30.0
- ARV discount +15.0/15.0
- 1% rule +10.0/10.0
- DSCR +10.0/10.0
- Schools +5.1/10.0
- Livability +3.9/5.0
- Condition / age +2.5/5.0
- Rent growth +1.9/5.0
- Appreciation +0.0/10.0
$79,500
🖨 Deal sheet 📄 Offer letter ✓ Due diligence
Listing remarks
Freshly painted inside and out, this beautiful home features gorgeous flooring in the raised living room and throughout the rest of the home, a spacious eat-in kitchen, and a renovated bathroom. Also included is a large backyard with the option to install fencing for added privacy. Ideally located near a bike park, dog park, frisbee golf course, and biking and walking trails, this home offers convenient access to a variety of outdoor recreational activities. Also available is an outdoor pool.
Key facts
- Renovated bathroom
- Large backyard
- Freshly painted
Tags
Property features AI
Finance
- Other: Minimal flood risk (C rating)
- HOA & community: No association fees or transfer fees reported; No association reserves
Exterior
- Parking: No garage; No designated parking features listed
- Utilities: City water (meter installed); Public sewer; Natural gas available (Xcel Energy)
- Home design: Manufactured in park (mobile home); Builder: Camelot
- Construction: Composition exterior materials; Metal roof
- Exterior features: Land lease; House faces south; Paved lot; Gutters; Fire hydrant within 500 feet; Privately maintained road to county standards; Asphalt road surface
Interior
- Kitchen: Refrigerator
- Bedrooms: 2 bedrooms
- Bathrooms: One three-quarter bathroom
- Heating & cooling: Forced air heating; Evaporative cooling
- Interior features: Eat-in kitchen
- Laundry & utility: Washer; Dryer
Neighborhood map
What this means for you Summary
Snapshot
- This is a 2-bed/1.0-bath manufactured listed at $80k.
Deal economics
- At list price, monthly cash flow is $1k ($17k/yr) — positive.
- The deal already cash-flows at list — no discount required.
- Meets the 1% rule at list price ($3k rent vs $80k).
- Recommended offer: $78k (1.5% below list) — sets the bar for market timing.
- Cap rate 28.2% vs local median 1.7% in Boulder — top-decile yield for the area; either an underpriced asset or a hidden risk that comps aren't pricing in. Stress-test before assuming the spread holds.
Location & tenants
- Location reads 77/100 on livability (#24 in CO, #2,958 nationally) — a middle-class / working-renter tenant base. Strengths: amenities A+, commute A+, health & safety A+; Watch: crime D+, cost of living F.
- Boulder Valley School District No. Re2 (urban): math 49% / reading 67% proficiency, ranked #6 of 86 in CO (top 7%) — acceptable for families but not a draw, mixed tenant base, ~2y average lease; only 16% free/reduced lunch — higher-income household profile.
- Zoned schools: Whittier Elementary School (math 24% / reading 52%, grade F, #393 of 966 statewide, top 41%, 329 students, 39% FRL); Boulder High School (math 64% / reading 81%, grade B+, #18 of 381 statewide, top 4%, 2,074 students, 28% FRL) — zoned schools average 33% FRL vs 16% district-wide (17 pts higher); higher-poverty schools than district average — tighter screening recommended.
- Market conditions: Rents soft (-2.3%/yr); 185 active listings in the ZIP; 26 comparable units currently listed for rent nearby; rentals leasing fast (median 14d on market — plan ~1-2 weeks tenant-placement turnaround); solid renter incomes; 1,688 units permitted in Boulder County in 2024 (1,136 in 5+ unit buildings).
- This rent runs 32% of the median local income ($95k/yr) — at the standard rent-burdened threshold; future hikes will face affordability resistance.
Forward outlook
- Local home prices are declining (-3.0%/yr); year-one equity from $550 of loan paydown is wiped out by about $2k of value loss. Plan a longer hold.
- Boulder County population projected at +40% by 2050 — long-run rental-demand tailwind backs the buy-and-hold thesis.
- At projected returns (-3.0% appreciation + 0.0% rent growth), your $22k cash investment doubles in ~2 years — after that, you're playing with house money.
Negotiation context
- It's been on market 20 days — a 2% lower offer ($78k) is reasonable based on typical stale-listing flexibility.
- Current owner paid $12k; list at $80k implies a 562% gain — meaningful room to come down on a strong offer.
Risks & watch-outs
- Climate carrying-cost: major wildfire risk — expect insurance premiums to compound above CPI over the hold.
Questions for the listing agent
- Built in 1970 — when were the roof, HVAC, electrical panel, plumbing, and water heater last replaced?
- Is there a deadline driving the sale (1031 exchange, divorce, estate, relocation)? That informs how much negotiation room exists.
- Schools are B-rated — typically a magnet for longer-tenancy family renters. What's the average tenant stay here, and is there a school-zone premium baked into asking?
- Crime grade is D in this area — have there been break-ins, vandalism, or insurance claims at this property in the last 3 years? What carrier currently insures it and at what premium?
- What's the average days-on-market for RENTAL listings here right now (not sales)? A rising rental-DOM trend means longer vacancies and softer asking-rent achievability than the comps imply.
- What's the recent tenant-quality profile in this submarket — average credit score on applications, eviction rate, late-payment / NSF rate, and stable-employment percentage? A property-management company in the area should have these aggregated.
- How much new for-sale + rental construction is in the pipeline within 1–3 miles? Heavy new supply typically softens prices + rents 12–24 months out; constrained supply supports both.
Investment metrics
- 1% rule
- 3.19% ✓
- Cap rate
- 28.24%
- Cash-on-cash
- 78.37%
- DSCR
- 4.49
- GRM
- 2.6
CMA / ARV
- ARV (on-the-fly)
- $131,068
- Comps found
- 2
Show comp detail 2 sales within ~0.75 mi
| Address | Dist | Beds/Ba | Sqft | Sold | Price | $/sf | Match |
|---|---|---|---|---|---|---|---|
| 5000 Butte St #31 | 0.00mi | 2/1.0 | 980 (+13%) | 12mo | $120,000 | $122 | 69 |
| 5000 Butte St #14 | 0.00mi | 2/2.0 | 960 (+11%) | 22mo | $145,000 | $151 | 60 |
Match score weights: distance 35% · size 25% · config 20% · recency 20%. Top-matched comps best support the ARV.
Projected returns pro-forma
-3.0% appreciation · 0.0% rent growth · sell at horizon
- IRR
- 75.0%
- Equity multiple
- 4.25×
- Total profit
- $72,316
- Equity at exit
- $11,854
- IRR
- 77.9%
- Equity multiple
- 7.90×
- Total profit
- $153,636
- Equity at exit
- $6,874
Cash invested: $22,260 (down + closing). Projections, not guarantees.
Landlord ↔ Tenant lean methodology
- Overall (STATE)
- 38 Tenant-Leaning
- State Colorado
- 38 Tenant-Leaning · D+4
- County
- — inherits STATE
- City
- — inherits STATE
ZIP-level market 80301
- Rents YoY
- -2.3%
- Active inventory
- 185
- Price-to-rent
- 2.6×
Monthly cashflow live
- Estimated rent
- $2,536 high interval (Pro) →
- Mortgage (P&I)
- −$417
- Tax est. 1.5%
- −$99 /mo · $1,192/yr
- Insurance
- −$33
- HOA
- −$0
- Vacancy / Maint / Mgmt
- −$532
- Net cashflow
- $1,454
Break-even live
UW: 25.0% down · 7.5% · 30yr · 1.5% tax · 5.0% vac · 8.0% maint · 8.0% mgmt
Financing live
Cash to close
- Down payment
- $19,875
- Closing costs
- $2,385
- Reserves months
- —
- Total cash needed
- —
Loan-product check · same deal, 3 products live
Conventional
25% down · 7.5% · 30yr
- Down + closing
- —
- Monthly P&I
- —
- Monthly cashflow
- —
- DSCR
- —
- Eligible?
- —
Personal DTI + credit; lowest rate.
DSCR
20% down · 8.5% · 30yr
- Down + closing
- —
- Monthly P&I
- —
- Monthly cashflow
- —
- DSCR
- —
- Eligible?
- —
No personal income docs; deal must DSCR.
Hard money
10% down · 12.0% · 12mo
- Down + closing
- —
- Monthly P&I
- —
- Monthly cashflow
- —
- DSCR
- —
- Eligible?
- —
Short-term bridge; refi at stabilization.
Rent comps 26 comps
| Address | Beds | Baths | Sqft | Rent | $/sqft | DOM | Units | Dist |
|---|---|---|---|---|---|---|---|---|
| 3045 Kings Ridge Blvd Unit 1 Boulder, CO | 2.0 | 1.0 | 950 | $1,875 | $1.97 | 21d | 1 | 0.31mi |
| 3073 Fulton Cir Boulder, CO | 2.0 | 1.5 | 1032 | $2,403 | $2.33 | 13d | 1 | 0.34mi |
| 3485 Hayden Pl Unit 3 Boulder, CO | 2.0 | 1.5 | 785 | $2,495 | $3.18 | 21d | 1 | 0.65mi |
| 3715 Canfield St Boulder, CO | 2.0 | 1.0–2.0 | 827 | $2,576 | $3.11 | 13d | 24 | 0.68mi |
| 3303 Bluff St Boulder, CO | 3.0 | 1.0–2.5 | 1131 | $3,789 | $3.35 | 13d | 38 | 0.81mi |
| 3315 Chisholm Trl Unit 1546453P Boulder, CO | 2.0 | 1.0 | 861 | $2,639 | $3.07 | 13d | 1 | 0.82mi |
| 3120 Corona Trl #209 Boulder, CO | 2.0 | 2.0 | 966 | $2,650 | $2.74 | 21d | 1 | 0.85mi |
| 3150 Iris Ave Unit F309 Boulder, CO | 1.0 | 1.0 | 676 | $1,595 | $2.36 | 21d | 1 | 0.88mi |
| 2530 Junction Pl Boulder, CO | 1.0–3.0 | 1.0–3.5 | 1204 | $3,416 | $2.84 | 13d | 69 | 0.88mi |
| 2995 Eagle Way Boulder, CO | 2.0 | 1.0–1.5 | 639 | $1,845 | $2.89 | 21d | 1 | 0.96mi |
| 2995 Glenwood Dr Boulder, CO | 1.0–2.0 | 1.0–1.5 | 807 | $2,136 | $2.65 | 13d | 17 | 0.97mi |
| 3100 Pearl St Boulder, CO | 2.0 | 1.0–2.0 | 849 | $3,875 | $4.56 | 13d | 23 | 1.07mi |
| 3000 Pearl Pkwy Boulder, CO | 2.0 | 1.0–2.0 | 1249 | $3,936 | $3.15 | 13d | 19 | 1.14mi |
| 2820 Hibiscus AVE Boulder, CO | 3.0 | 1.0–2.5 | 1010 | $3,678 | $3.64 | 13d | 91 | 1.16mi |
| 2850 Kalmia Ave Boulder, CO | 1.0–2.0 | 1.0–2.0 | 850 | $2,795 | $3.29 | 13d | 4 | 1.19mi |
| 2800 Kalmia Ave Boulder, CO | 2.0 | 1.5–2.0 | 880 | $2,150 | $2.44 | 21d | 2 | 1.21mi |
| 3487 28th St #21 Boulder, CO | 2.0 | 1.5 | 936 | $2,600 | $2.78 | 21d | 1 | 1.27mi |
| 2747 Glenwood Ct Boulder, CO | 2.0 | 1.5 | 1000 | $1,850 | $1.85 | 13d | 1 | 1.28mi |
| 3545 28th St #308 Boulder, CO | 2.0 | 2.0 | 838 | $2,950 | $3.52 | 21d | 1 | 1.30mi |
| 2707 Valmont Rd Boulder, CO | 1.0–2.0 | 1.0 | 684 | $2,200 | $3.22 | 21d | 6 | 1.31mi |
| 1590 Eisenhower Dr Boulder, CO | 3.0 | 1.0–3.0 | 937 | $3,724 | $3.97 | 13d | 20 | 1.33mi |
| 4970 Meredith Way Boulder, CO | 1.0–2.0 | 1.0–2.0 | 836 | $2,717 | $3.25 | 13d | 15 | 1.36mi |
| 3401 Arapahoe Ave Boulder, CO | 1.0 | 1.0 | 871 | $3,995 | $4.58 | 13d | 1 | 1.38mi |
| 2625 Tabriz Pl Boulder, CO | 3.0 | 1.0 | 1097 | $3,600 | $3.28 | 21d | 1 | 1.40mi |
| 3725 Birchwood Dr #23 Boulder, CO | 2.0 | 1.5 | 1114 | $2,295 | $2.06 | 21d | 1 | 1.40mi |
| 2606 Juniper Ave Unit 34-1 Boulder, CO | 1.0 | 1.0 | 548 | $1,325 | $2.42 | 13d | 1 | 1.44mi |
Listing history 17 events
-
2026-06-18days on market $79,500 Active 20 DOM
-
2026-06-17days on market $79,500 Active 19 DOM
-
2026-06-16days on market $79,500 Active 18 DOM
-
2026-06-15days on market $79,500 Active 17 DOM
-
2026-06-14days on market $79,500 Active 15 DOM
-
2026-06-13days on market $79,500 Active 14 DOM
-
2026-06-10days on market $79,500 Active 12 DOM
-
2026-06-09days on market $79,500 Active 11 DOM
-
2026-06-09days on market $79,500 Active 10 DOM
-
2026-06-07days on market $79,500 Active 9 DOM
-
2026-06-05days on market $79,500 Active 6 DOM
-
2026-06-03days on market $79,500 Active 5 DOM
-
2026-06-02days on market $79,500 Active 4 DOM
-
2026-06-01days on market $79,500 Active 3 DOM
-
2026-05-31days on market $79,500 Active 2 DOM
-
2026-05-30remarks 497-char remark
-
2026-05-30$79,500 Active 1 DOM
ⓘ Source: listings_history table (triggers on properties + properties_extension) + one-shot
backfill from property_details.listing_events for pre-trigger history.
Climate risk First Street
- Flood 1/10 Low FEMA zone X (unshaded) · 0% chance over 30 yrs
- Wildfire 6/10 Major
- Heat 3/10 Moderate 7 d/yr ≥92°F today · 18 d/yr by 30 yrs out
- Wind 1/10 Low
- Air quality 4/10 Moderate 4 unhealthy d/yr today · 5 by 30 yrs out
Nearby sold comps map
Loading sold comps map…
Walkable amenities ~0.75 mi
Loading nearby amenities…
Taxation est. · year 1
- Rental income
- $30,428
- − Mortgage interest
- −$4,453
- − Property taxes
- −$1,192
- − Insurance
- −$398
- − Repairs & maintenance
- −$2,434
- − Management
- −$2,434
- − Depreciation
- −$2,313
- Taxable income
- $17,204
- Est. tax owed @ 24.0%
- −$4,129
- After-tax cash flow
- $13,316/yr
For passive investors: Depreciation is non-cash, so a rental often shows a tax loss while cash-flowing — sheltering income. Rental losses are passive: they offset passive income freely, and up to $25,000/yr can offset ordinary (W-2) income if you actively participate and your MAGI is under $100k (phasing out to $0 by $150k); unused losses carry forward. On sale, claimed depreciation is recaptured at up to 25%, and gains may owe capital-gains tax (a 1031 exchange can defer both). Figures are a year-1 estimate at your 24.0% rate — not tax advice; consult a CPA.
Schools (NCES district)
- District
- Boulder Valley School District No. Re2
- NCES district ID
- 0802490
- Math proficiency
- 49% ▼ -3.00%
- Reading proficiency
- 67% ▲ 4.00%
- Median HH income
- $70,395
- Composite
- 51.3/100
- National rank
- #1747
- State rank
- #6 of 86 in CO
Livability — Boulder
- Score
- 77/100
- State rank
- #24
- US rank
- #2958
Category grades
Schools grade is shown separately in the Schools card above.
Census & demographics
- Census place
- Boulder, CO
- County
- Boulder County · 271,666 people
- City population
- 121,246
- Metro
- Boulder, CO
- Population (ZIP)
- 25,007
- Household income
- $95,207
- Rent vs Own
- Severe rent burden
- 1296.0
Population outlook (Boulder County) Hauer SSP2
- Today (2025)
- 380,833 people
- By 2030
- 412,028 · +8.2%
- By 2040
- 472,764 · +24.1%
- By 2050
- 532,029 · +39.7%
- By 2075
- 679,723 · +78.5%
- By 2100
- 766,278 · +101.2%
Race, ethnicity, and origin ACS 2023
- Neighborhood character
- Predominantly White (80%)
- Race & ethnicity
- White 80% Two or more races 11% Hispanic / Latino 11% Asian 3%
- Hispanic origin (detail)
- Mexican 7%
- Common ancestry
- Italian 4% Slovak 4% Lithuanian 3%
- Foreign-born
- 9% · Canada, China, South Korea
- Languages at home
- 88% English-only · Spanish 6% Other Indo-European 2% Russian/Polish/Slavic 1%
Political lean MEDSL · Boulder
- 2024 margin
- Solid D (+55.8) · D 76.5% · R 20.8% · Other 2.7%
- 2008→2024 swing
- +9.6pp toward D · 2008: 46.1pp · 2024: 55.8pp
- All cycles
- 2024: D+55.8 2020: D+56.6 2016: D+48.6 2012: D+41.5 2008: D+46.1
Not yet ingested
- Civics
- —
Market trends
- HPI YoY
- ▼ -674.67%
- Current HPI
- 286.4092
- Rent YoY
- ▼ -2.27%
- Metro
- Boulder, CO
- State GDP YoY
- ▲ 1.95%
- F500 in state
- 14
Industry mix (Fortune 500 HQ in CO)
| Industry | F500 HQs | Revenue |
|---|---|---|
| Technology Distribution | 1 | $31B |
|
||
| Food / Agriculture | 1 | $18B |
|
||
| Packaging | 1 | $14B |
|
||
| Healthcare | 1 | $13B |
|
||
| Energy | 1 | $10B |
|
||
| Technology | 1 | $4B |
|
||
Price history
+562.5% since first listed3 events — show timeline
- 2026-05-28 Listed $79,500 IRES
- 1994-04-06 Sold (Public Records) $12,000 Public Records
- 1993-03-09 Sold (Public Records) $12,000 Public Records
Property tax history
+8.3%/yrLatest (2021): $112 · +4.6% YoY. Source: county tax records.
Cash-flow waterfall
monthlySold comps — $/sqft
last 12 mo · ≤1 miLoading sold comps…