305 Canadian Dr · Westwood Shores, TX
Flood risk 1/10 · Minimal
- FEMA flood zone
- —
- Chance of flooding over 30 yrs
- 0.0%
- Est. flood insurance / yr
- —
Fire risk 4/10 · Minor
- Est. fire insurance / yr
- $1,222 – $2,270
Heat risk 8/10 · Major
- Hot days now (above 111°F)
- 7 days/yr
- Hot days in 30 yrs
- 24 days/yr
Wind risk 8/10 · Major
- Chance of severe wind over 30 yrs
- 97.0%
Air-quality risk 1/10 · Minimal
- Unhealthy air days now
- 0 days/yr
- Unhealthy air days in 30 yrs
- 0 days/yr
Risk factors via First Street. Map © Google.
Why this score? — see what drove the B+ grade
The composite is a weighted blend of 9 inputs, each scored 0–100. Each bar is that input's sub-score; the figure is the points it added to the 100-point composite (weight × sub-score).
- Cash flow +27.8/30.0
- ARV discount +15.0/15.0
- DSCR +9.8/10.0
- 1% rule +7.4/10.0
- Appreciation +4.7/10.0
- Schools +3.8/10.0
- Livability +3.1/5.0
- Rent growth +2.5/5.0
- Condition / age +2.5/5.0
$110,000
🖨 Deal sheet 📄 Offer letter ✓ Due diligence
Listing remarks MLS
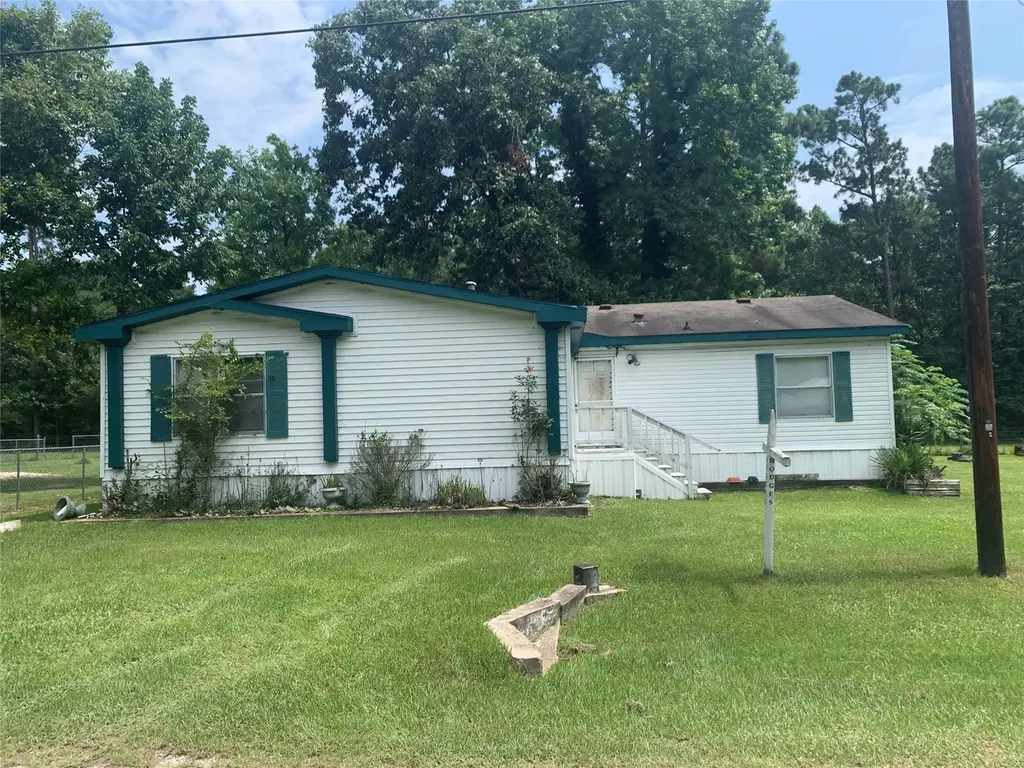
Welcome to Harbor Point, an exclusive lakeside community offering access to Lake Livingston and its many water activities, including fishing and boating. It can be your primary home or weekend gateway. This spacious triple-wide home features 3 bedrooms, 2 baths, a family room, a dining area, a kitchen, and an adjacent living room. Enjoy community amenities, including a pool, putt-putt golf, and a marina. The lot provides covered parking and space to park an RV for your convenience. With a new roof in 2021, this fully furnished home is ready for your immediate enjoyment. Experience tranquility with a manned security gate ensuring safety and peace of mind. Live the lake life!
Key facts
- Manned security gate
- Covered parking
- Space to park an rv
Tags
Neighborhood map
What this means for you Summary
Snapshot
- This is a 3-bed/2.0-bath manufactured listed at $110k.
Deal economics
- At list price, monthly cash flow is $334 ($4k/yr) — positive.
- The deal already cash-flows at list — no discount required.
- Meets the 1% rule at list price ($1k rent vs $110k).
- Recommended offer: $97k (12.0% below list) — sets the bar for market timing.
- Cap rate 9.9% vs local median 3.6% in Westwood Shores — top-decile yield for the area; either an underpriced asset or a hidden risk that comps aren't pricing in. Stress-test before assuming the spread holds.
Location & tenants
- Location reads 62/100 on livability (#914 in TX) — a middle-class / working-renter tenant base. Strengths: crime A+, cost of living A+, housing A+; Watch: schools F, amenities F, commute F.
- Groveton ISD (rural): math 45% / reading 46% proficiency, ranked #281 of 826 in TX (top 34%) — families likely to look elsewhere, expect single-tenant / working-renter base with shorter leases.
- Market conditions: 468 active listings in the ZIP; 1 units permitted in Trinity County in 2024 (0 in 5+ unit buildings).
Forward outlook
- In year one you build about $192 of equity ($761 loan paydown + $-569 appreciation (-0.5% local appreciation)).
- Trinity County population projected at -13% by 2050 — secular population decline; favor cash flow + early exit over multi-decade hold.
- At projected returns (-0.5% appreciation + 3.0% rent growth), your $31k cash investment doubles in ~6 years — after that, you're playing with house money.
Negotiation context
- It's been on market 148 days — a 12% lower offer ($97k) is reasonable based on typical stale-listing flexibility.
- 3 sale attempts since 5y ago with the ask held roughly flat each time — persistent listings suggest the price (not the market) is what's stuck; bring a comps-based counter.
Risks & watch-outs
- Climate carrying-cost: severe wind risk, 97% chance of damaging wind over 30y; extreme-heat days projected 7→24/yr by 2055 (HVAC capex compounding) — expect insurance premiums to compound above CPI over the hold.
Questions for the listing agent
- It's been on market 148 days. Have you received any prior offers? Is the seller open to a 12% concession, seller financing, or rate buy-down credit?
- What does the HOA fee cover, when was the last increase, and are there any pending special assessments or reserve-fund shortfalls?
- Why hasn't it sold? Are there any deal-killer items the seller is aware of (foundation, flood, title, zoning, code violations)?
- Is there a deadline driving the sale (1031 exchange, divorce, estate, relocation)? That informs how much negotiation room exists.
- Schools are F-rated, which usually means shorter tenancies and higher turnover. Who's the typical renter profile here, and what's been the actual vacancy rate?
- What's the average days-on-market for RENTAL listings here right now (not sales)? A rising rental-DOM trend means longer vacancies and softer asking-rent achievability than the comps imply.
- What's the recent tenant-quality profile in this submarket — average credit score on applications, eviction rate, late-payment / NSF rate, and stable-employment percentage? A property-management company in the area should have these aggregated.
- How much new for-sale + rental construction is in the pipeline within 1–3 miles? Heavy new supply typically softens prices + rents 12–24 months out; constrained supply supports both.
Investment metrics
- 1% rule
- 1.24% ✓
- Cap rate
- 9.94%
- Cash-on-cash
- 13.01%
- DSCR
- 1.58
- GRM
- 6.7
CMA / ARV
- ARV (median comp)
- $166,304
- List price
- $110,000
- Delta
- -33.86%
- Verdict
- UNDERPRICED
- Comps
- 5 within 1.0 mi
Show comp detail 5 sales within ~0.75 mi
| Address | Dist | Beds/Ba | Sqft | Sold | Price | $/sf | Match |
|---|---|---|---|---|---|---|---|
| 322 Nueces Dr | 0.21mi | 3/2.0 | 1,668 (-8%) | 2mo | $34,900 | $21 | 76 |
| 505 Harbor Point Dr | 0.19mi | 3/2.0 | 1,920 (+6%) | 6mo | $220,000 | $115 | 75 |
| 277 Rio Grande Dr | 0.24mi | 3/2.0 | 1,560 (-14%) | 2mo | $174,000 | $112 | 65 |
| 176 Cedar Trl | 0.41mi | 3/2.0 | 1,680 (-7%) | 12mo | $170,000 | $101 | 59 |
| 137 Holly Trl | 0.44mi | 3/2.0 | 1,568 (-13%) | 1mo | $55,000 | $35 | 56 |
Match score weights: distance 35% · size 25% · config 20% · recency 20%. Top-matched comps best support the ARV.
Projected returns pro-forma
-0.52% appreciation · 3.0% rent growth · sell at horizon
- IRR
- 10.8%
- Equity multiple
- 1.50×
- Total profit
- $15,423
- Equity at exit
- $29,127
- IRR
- 16.3%
- Equity multiple
- 2.70×
- Total profit
- $52,376
- Equity at exit
- $32,839
Cash invested: $30,800 (down + closing). Projections, not guarantees.
Landlord ↔ Tenant lean methodology
- Overall (STATE)
- 87 Strongly Landlord-Friendly
- State Texas
- 87 Strongly Landlord-Friendly · R+5
- County
- — inherits STATE
- City
- — inherits STATE
ZIP-level market 75862
- Home prices YoY
- -0.3%
- Active inventory
- 468
- Price-to-rent
- 6.7×
Monthly cashflow live
- Estimated rent
- $1,362 medium interval (Pro) →
- Mortgage (P&I)
- −$577
- Tax from tax record
- −$86 /mo · $1,037/yr
- Insurance
- −$46
- HOA
- −$33
- Vacancy / Maint / Mgmt
- −$286
- Net cashflow
- $334
Break-even live
UW: 25.0% down · 7.5% · 30yr · 1.5% tax · 5.0% vac · 8.0% maint · 8.0% mgmt
Financing live
Cash to close
- Down payment
- $27,500
- Closing costs
- $3,300
- Reserves months
- —
- Total cash needed
- —
Loan-product check · same deal, 3 products live
Conventional
25% down · 7.5% · 30yr
- Down + closing
- —
- Monthly P&I
- —
- Monthly cashflow
- —
- DSCR
- —
- Eligible?
- —
Personal DTI + credit; lowest rate.
DSCR
20% down · 8.5% · 30yr
- Down + closing
- —
- Monthly P&I
- —
- Monthly cashflow
- —
- DSCR
- —
- Eligible?
- —
No personal income docs; deal must DSCR.
Hard money
10% down · 12.0% · 12mo
- Down + closing
- —
- Monthly P&I
- —
- Monthly cashflow
- —
- DSCR
- —
- Eligible?
- —
Short-term bridge; refi at stabilization.
HOA detail
- Monthly dues
- $33 · $396/yr
- Likely covers
- waterpoolsecurity
Listing history 29 events
-
2026-06-19days on market $110,000 Active 148 DOM
-
2026-06-18days on market $110,000 Active 147 DOM
-
2026-06-17days on market $110,000 Active 146 DOM
-
2026-06-16days on market $110,000 Active 145 DOM
-
2026-06-15days on market $110,000 Active 144 DOM
-
2026-06-14days on market $110,000 Active 142 DOM
-
2026-06-13days on market $110,000 Active 141 DOM
-
2026-06-10days on market $110,000 Active 139 DOM
-
2026-06-09days on market $110,000 Active 138 DOM
-
2026-06-08days on market $110,000 Active 137 DOM
-
2026-06-07days on market $110,000 Active 136 DOM
-
2026-06-05days on market $110,000 Active 133 DOM
-
2026-06-02days on market $110,000 Active 131 DOM
-
2026-06-01days on market $110,000 Active 130 DOM
-
2026-05-31days on market $110,000 Active 129 DOM
-
2026-05-30days on market $110,000 Active 128 DOM
-
2026-01-23$110,000 Active 682-char remark
Show marketing remark (682 chars)
Welcome to Harbor Point, an exclusive lakeside community offering access to Lake Livingston and its many water activities, including fishing and boating. It can be your primary home or weekend gateway. This spacious triple-wide home features 3 bedrooms, 2 baths, a family room, a dining area, a kitchen, and an adjacent living room. Enjoy community amenities, including a pool, putt-putt golf, and a marina. The lot provides covered parking and space to park an RV for your convenience. With a new roof in 2021, this fully furnished home is ready for your immediate enjoyment. Experience tranquility with a manned security gate ensuring safety and peace of mind. Live the lake life!
-
2025-12-10historical
-
2025-08-02price $105,000
-
2025-01-02price $115,000
-
2024-03-08price $138,500
-
2024-02-17$147,900 Active
-
2022-07-11soldstatus Sold
-
2022-06-02status Pending
-
2021-12-21status Pending, Continue to Show
-
2021-12-12status Option Pending
-
2021-11-18price $88,900
-
2021-10-12price $89,000
-
2021-08-27$99,000 Active
ⓘ Source: listings_history table (triggers on properties + properties_extension) + one-shot
backfill from property_details.listing_events for pre-trigger history.
Tax reassessment forecast TX · Resets to sale price
- Current annual tax
- $1,037 · $86/mo
- Projected year-2 tax
- $2,013 · $168/mo
- Expected delta
- +$976/yr (+$81/mo · 94.2%)
ⓘ Screening estimate from a state-policy table — verify with the county assessor before closing.
Climate risk First Street
- Flood 1/10 Low 0% chance over 30 yrs
- Wildfire 4/10 Moderate
- Heat 8/10 Severe 7 d/yr ≥111°F today · 24 d/yr by 30 yrs out
- Wind 8/10 Severe 97% chance of damaging wind over 30 yrs
- Air quality 1/10 Low 0 unhealthy d/yr today · 0 by 30 yrs out
Nearby sold comps map
Loading sold comps map…
Walkable amenities ~0.75 mi
Loading nearby amenities…
Taxation est. · year 1
- Rental income
- $16,346
- − Mortgage interest
- −$6,162
- − Property taxes
- −$1,037
- − Insurance
- −$550
- − Repairs & maintenance
- −$1,308
- − Management
- −$1,308
- − HOA
- −$396
- − Depreciation
- −$3,200
- Taxable income
- $2,386
- Est. tax owed @ 24.0%
- −$573
- After-tax cash flow
- $3,436/yr
For passive investors: Depreciation is non-cash, so a rental often shows a tax loss while cash-flowing — sheltering income. Rental losses are passive: they offset passive income freely, and up to $25,000/yr can offset ordinary (W-2) income if you actively participate and your MAGI is under $100k (phasing out to $0 by $150k); unused losses carry forward. On sale, claimed depreciation is recaptured at up to 25%, and gains may owe capital-gains tax (a 1031 exchange can defer both). Figures are a year-1 estimate at your 24.0% rate — not tax advice; consult a CPA.
Schools (NCES district)
- District
- Groveton ISD
- NCES district ID
- 4821900
- Math proficiency
- 45% ▼ -2.00%
- Reading proficiency
- 46% ▲ 1.00%
- Median HH income
- $36,375
- Composite
- 37.76/100
- National rank
- #4348
- State rank
- #281 of 826 in TX
Livability — Westwood Shores
- Score
- 62/100
- State rank
- #914
- US rank
- #16347
Category grades
Schools grade is shown separately in the Schools card above.
Census & demographics
- Population (ZIP)
- 10,030
Population outlook (Trinity County) Hauer SSP2
- Today (2025)
- 13,746 people
- By 2030
- 13,333 · -3.0%
- By 2040
- 12,542 · -8.8%
- By 2050
- 11,942 · -13.1%
- By 2075
- 10,871 · -20.9%
- By 2100
- 9,784 · -28.8%
Race, ethnicity, and origin ACS 2023
- Neighborhood character
- Predominantly White (74%)
- Race & ethnicity
- White 74% Hispanic / Latino 12% Black 10% Two or more races 7%
- Hispanic origin (detail)
- Mexican 11%
- Common ancestry
- Lithuanian 3% Serbian 2% Slovak 2%
- Foreign-born
- 4% · Canada
- Languages at home
- 89% English-only · Spanish 9% French/Haitian/Cajun 2%
Political lean MEDSL · Trinity
- 2024 margin
- Solid R (+67.0) · D 16.2% · R 83.2%
- 2008→2024 swing
- -31.3pp toward R · 2008: -35.7pp · 2024: -67.0pp
- All cycles
- 2024: R+67.0 2020: R+61.3 2016: R+59.9 2012: R+46.9 2008: R+35.7
Not yet ingested
- Civics
- —
Market trends
- HPI YoY
- ▼ -0.52%
- Current HPI
- 174.6638
- Rent YoY
- —
- Metro
- —
- State GDP YoY
- ▲ 3.95%
- F500 in state
- 110
Industry mix (Fortune 500 HQ in TX)
| Industry | F500 HQs | Revenue |
|---|---|---|
| Energy | 16 | $1,198B |
|
||
| Technology | 5 | $198B |
|
||
| Engineering / Construction | 4 | $72B |
|
||
| Energy Services | 3 | $60B |
|
||
| Utilities | 3 | $41B |
|
||
| Healthcare | 2 | $330B |
|
||
Price history
+11.1% since first listed13 events — show timeline
- 2026-01-23 Listed $110,000 HARMLS
- 2025-12-10 Listing Removed — HARMLS
- 2025-08-02 Price Changed $105,000 HARMLS
- 2025-01-02 Price Changed $115,000 HARMLS
- 2024-03-08 Price Changed $138,500 HARMLS
- 2024-02-17 Listed $147,900 HARMLS
- 2022-07-11 Sold (MLS) — HARMLS
- 2022-06-02 Pending — HARMLS
- 2021-12-21 Pending — HARMLS
- 2021-12-12 Pending — HARMLS
- 2021-11-18 Price Changed $88,900 HARMLS
- 2021-10-12 Price Changed $89,000 HARMLS
- 2021-08-27 Listed $99,000 HARMLS
Property tax history
+0.1%/yrLatest (2025): $1,037 · -22.1% YoY. Source: county tax records.
Cash-flow waterfall
monthlySold comps — $/sqft
last 12 mo · ≤1 miLoading sold comps…