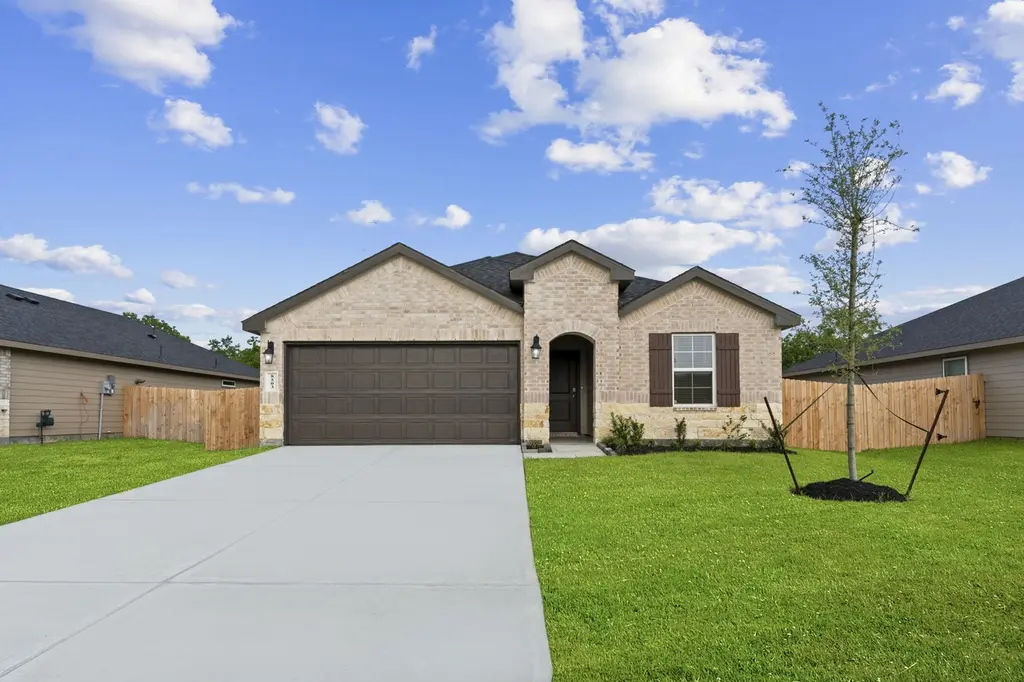
1511 Splashing Wave Dr · Iowa Colony, TX
Flood risk No data
- FEMA flood zone
- —
- Chance of flooding over 30 yrs
- —
- Est. flood insurance / yr
- —
Fire risk No data
- Est. fire insurance / yr
- —
Heat risk No data
- Hot days now (above threshold)
- —
- Hot days in 30 yrs
- —
Wind risk No data
- Chance of severe wind over 30 yrs
- —
Air-quality risk No data
- Unhealthy air days now
- —
- Unhealthy air days in 30 yrs
- —
Risk factors via First Street. Map © Google.
Why this score? — see what drove the D- grade
The composite is a weighted blend of 9 inputs, each scored 0–100. Each bar is that input's sub-score; the figure is the points it added to the 100-point composite (weight × sub-score).
- Cash flow +10.7/30.0
- ARV discount +8.9/15.0
- Condition / age +4.0/5.0
- Schools +3.9/10.0
- 1% rule +3.5/10.0
- Livability +3.2/5.0
- DSCR +3.1/10.0
- Rent growth +2.6/5.0
- Appreciation +0.0/10.0
$319,490
🖨 Deal sheet 📄 Offer letter ✓ Due diligence
Listing remarks MLS
Welcome to the Harris plan in the Caldwell Crossing community! This single-story home spans 1,831 sq. ft. and features 4 bedrooms, 2.5 bathrooms, and a 2-car garage. Upon entering, you'll find two secondary bedrooms with access to a shared bathroom, each with carpet flooring, a bright window, and a tall closet. The bathroom has vinyl flooring and a tub/shower combo. Further down the foyer, you'll pass the powder room, utility room (with washer/dryer space), and a third secondary bedroom with carpet flooring and a tall closet. At the back of the home is the open-concept family room, dining room, and L-shaped kitchen, perfect for entertaining. The kitchen has stainless-steel appliances, a pantry, and vinyl floors. The primary bedroom features carpet flooring, two windows, and a walk-in closet. The primary bathroom includes double sinks, a tub/shower combo, and a separate toilet room. Enjoy the covered back patio and spacious backyard!
Key facts
- Spacious backyard
- L-shaped kitchen
- Covered back patio
Tags
Neighborhood map
What this means for you Summary
Snapshot
- This is a 4-bed/2.5-bath single-family listed at $319k. Condition is rated good.
Deal economics
- At list price, monthly cash flow is $-150 ($-2k/yr) — negative.
- To cash-flow at today's rent, offer at most $298k (6.8% below list).
- To meet the 1% rule (rent ≥ 1% of price), the offer needs to be $270k (15.5% below list).
- Recommended offer: $270k (15.5% below list) — sets the bar for 1% rule.
- Cap rate 5.7% vs local median 4.2% in Iowa Colony — top-decile yield for the area; either an underpriced asset or a hidden risk that comps aren't pricing in. Stress-test before assuming the spread holds.
Location & tenants
- Location reads 64/100 on livability (#757 in TX) — a middle-class / working-renter tenant base. Strengths: crime A+, employment A+, cost of living A+; Watch: schools F, amenities F, commute F.
- Alvin ISD (suburban): math 39% / reading 48% proficiency, ranked #255 of 826 in TX (top 31%) — families likely to look elsewhere, expect single-tenant / working-renter base with shorter leases.
- Market conditions: Rents flat; 1139 active listings in the ZIP; 23 comparable units currently listed for rent nearby; rentals lingering (median 44d on market — plan ~5-8 weeks vacancy on turnover, expect pricing pressure); 57% of comp listings sitting > 30 days — soft ceiling on asking rent; high-income renter base; 3,960 units permitted in Brazoria County in 2024 (593 in 5+ unit buildings).
Forward outlook
- Local home prices are declining (-3.0%/yr); year-one equity from $2k of loan paydown is wiped out by about $10k of value loss. Plan a longer hold.
- Brazoria County population projected at +44% by 2050 — long-run rental-demand tailwind backs the buy-and-hold thesis.
Negotiation context
- It's been on market 58 days — a 3% lower offer ($310k) is reasonable based on typical stale-listing flexibility.
Questions for the listing agent
- What do current leases actually rent for vs. the listed asking? Can we see a recent rent roll and the last 12 months of T-12 income?
- It's been on market 58 days. Have you received any prior offers? Is the seller open to a 15% concession, seller financing, or rate buy-down credit?
- What does the HOA fee cover, when was the last increase, and are there any pending special assessments or reserve-fund shortfalls?
- Is there a deadline driving the sale (1031 exchange, divorce, estate, relocation)? That informs how much negotiation room exists.
- Schools are F-rated, which usually means shorter tenancies and higher turnover. Who's the typical renter profile here, and what's been the actual vacancy rate?
- The area grade is low — what's the realistic commute time and amenity access for the typical tenant pool here? Any planned neighborhood developments (good or bad) we should know about?
- What's the average days-on-market for RENTAL listings here right now (not sales)? A rising rental-DOM trend means longer vacancies and softer asking-rent achievability than the comps imply.
- What's the recent tenant-quality profile in this submarket — average credit score on applications, eviction rate, late-payment / NSF rate, and stable-employment percentage? A property-management company in the area should have these aggregated.
- How much new for-sale + rental construction is in the pipeline within 1–3 miles? Heavy new supply typically softens prices + rents 12–24 months out; constrained supply supports both.
Investment metrics
- 1% rule
- 0.85% ✗
- Cap rate
- 5.73%
- Cash-on-cash
- -2.01%
- DSCR
- 0.91
- GRM
- 9.9
CMA / ARV
- ARV (median comp)
- $329,740
- List price
- $319,490
- Delta
- -3.11%
- Verdict
- FAIR
- Comps
- 20 within 1.0 mi
Show comp detail 12 sales within ~0.75 mi
| Address | Dist | Beds/Ba | Sqft | Sold | Price | $/sf | Match |
|---|---|---|---|---|---|---|---|
| 9134 Sunset Marina Way | 0.15mi | 4/2.5 | 1,831 (0%) | 2mo | $311,990 | $170 | 91 |
| 1523 Splashing Wave Dr | 0.03mi | 4/2.0 | 2,031 (+11%) | 0mo | $349,490 | $172 | 78 |
| 1419 Splashing Wave Dr | 0.04mi | 4/2.0 | 2,031 (+11%) | 1mo | $319,990 | $158 | 78 |
| 1522 Shimmering Ocean Way | 0.04mi | 4/3.0 | 2,042 (+12%) | 1mo | $331,000 | $162 | 76 |
| 1507 Shimmering Ocean Way | 0.06mi | 4/3.0 | 2,042 (+12%) | 1mo | $354,490 | $174 | 75 |
| 9111 Serene Haven Dr | 0.08mi | 4/2.0 | 2,035 (+11%) | 1mo | $319,490 | $157 | 75 |
| 9114 Serene Hvn | 0.10mi | 4/3.0 | 2,042 (+12%) | 1mo | $352,865 | $173 | 73 |
| 9007 Serene Hvn | 0.11mi | 4/3.0 | 2,042 (+12%) | 2mo | $356,865 | $175 | 72 |
| 1511 Shimmering Ocean Way | 0.06mi | 3/2.0 (-1) | 1,595 (-13%) | 1mo | $299,990 | $188 | 68 |
| 1222 Sandy Shore Ln | 0.15mi | 3/2.0 (-1) | 1,595 (-13%) | 2mo | $309,990 | $194 | 63 |
| 9015 Rose Water Trl | 0.22mi | 3/2.0 (-1) | 1,595 (-13%) | 1mo | $309,490 | $194 | 60 |
| 9203 Waldrick Trace Dr | 0.36mi | 3/2.0 (-1) | 1,634 (-11%) | 0mo | $275,000 | $168 | 58 |
Match score weights: distance 35% · size 25% · config 20% · recency 20%. Top-matched comps best support the ARV.
Projected returns pro-forma
-3.0% appreciation · 0.44% rent growth · sell at horizon
- IRR
- -22.6%
- Equity multiple
- 0.24×
- Total profit
- $-68,009
- Equity at exit
- $47,637
- IRR
- -25.5%
- Equity multiple
- -0.09×
- Total profit
- $-97,594
- Equity at exit
- $27,624
Cash invested: $89,457 (down + closing). Projections, not guarantees.
Landlord ↔ Tenant lean methodology
- Overall (STATE)
- 87 Strongly Landlord-Friendly
- State Texas
- 87 Strongly Landlord-Friendly · R+5
- County
- — inherits STATE
- City
- — inherits STATE
ZIP-level market 77583
- Rents YoY
- 0.4%
- Active inventory
- 1139
- Price-to-rent
- 9.9×
Monthly cashflow live
- Estimated rent
- $2,700 high interval (Pro) →
- Mortgage (P&I)
- −$1,675
- Tax est. 1.5%
- −$399 /mo · $4,792/yr
- Insurance
- −$133
- HOA
- −$75
- Vacancy / Maint / Mgmt
- −$567
- Net cashflow
- $-150
Break-even live
UW: 25.0% down · 7.5% · 30yr · 1.5% tax · 5.0% vac · 8.0% maint · 8.0% mgmt
Financing live
Cash to close
- Down payment
- $79,872
- Closing costs
- $9,585
- Reserves months
- —
- Total cash needed
- —
Loan-product check · same deal, 3 products live
Conventional
25% down · 7.5% · 30yr
- Down + closing
- —
- Monthly P&I
- —
- Monthly cashflow
- —
- DSCR
- —
- Eligible?
- —
Personal DTI + credit; lowest rate.
DSCR
20% down · 8.5% · 30yr
- Down + closing
- —
- Monthly P&I
- —
- Monthly cashflow
- —
- DSCR
- —
- Eligible?
- —
No personal income docs; deal must DSCR.
Hard money
10% down · 12.0% · 12mo
- Down + closing
- —
- Monthly P&I
- —
- Monthly cashflow
- —
- DSCR
- —
- Eligible?
- —
Short-term bridge; refi at stabilization.
Rent comps 23 comps
| Address | Beds | Baths | Sqft | Rent | $/sqft | DOM | Units | Dist |
|---|---|---|---|---|---|---|---|---|
| 9423 Grand Spark Dr Rosharon, TX | 3.0 | 3.0 | 1999 | $2,600 | $1.30 | 43d | 1 | 0.44mi |
| 9439 Ruby Mist Dr Rosharon, TX | 5.0 | 2.5 | 2605 | $2,456 | $0.94 | 7d | 1 | 0.52mi |
| 1014 Star Grass Ln Rosharon, TX | 4.0 | 2.0 | 2067 | $2,375 | $1.15 | 43d | 1 | 0.53mi |
| 1123 Diamond Drape Dr Rosharon, TX | 4.0 | 2.0 | 1844 | $2,000 | $1.08 | 12d | 1 | 0.53mi |
| 1119 Toledo Bend Pass Rosharon, TX | 5.0 | 3.0 | 2200 | $2,500 | $1.14 | 43d | 1 | 0.82mi |
| 9518 Peridot Green Dr Rosharon, TX | 4.0 | 2.0 | 1593 | $1,886 | $1.18 | 22d | 1 | 0.85mi |
| 8219 House Dr Rosharon, TX | 3.0 | 2.0 | 1263 | $1,970 | $1.56 | 22d | 1 | 0.97mi |
| 2510 Green Jasper Dr Rosharon, TX | 3.0 | 2.0 | 1561 | $2,375 | $1.52 | 43d | 1 | 0.99mi |
| 8414 Aster Glen Way Rosharon, TX | 4.0 | 2.5 | 2588 | $2,650 | $1.02 | 43d | 1 | 1.04mi |
| 8043 House Bank Ln Rosharon, TX | 4.0 | 3.0 | 2512 | $2,550 | $1.02 | 18d | 1 | 1.07mi |
| 8102 Buck Ln Rosharon, TX | 3.0 | 2.0 | 1409 | $2,100 | $1.49 | 43d | 1 | 1.07mi |
| 2523 Topaz Hill Ln Rosharon, TX | 3.0–4.0 | 2.0–2.5 | 1857 | $2,950 | $1.59 | 16d | 1 | 1.10mi |
| 8310 Rose Petals Ln Rosharon, TX | 4.0 | 2.0 | 1833 | $2,300 | $1.25 | 43d | 1 | 1.17mi |
| 10313 Malta Trace Dr Rosharon, TX | 4.0 | 2.0 | 1802 | $2,545 | $1.41 | 43d | 1 | 1.19mi |
| 1816 Corsica Creek Ln Rosharon, TX | 3.0–4.0 | 2.0–2.5 | 1653 | $2,719 | $1.64 | 1d | 21 | 1.24mi |
| 10211 Alpine Lake Ln Rosharon, TX | 3.0–4.0 | 2.0–2.5 | 1731 | $3,025 | $1.75 | 1d | 6 | 1.30mi |
| 10211 Alpine Lake Ln Rosharon, TX | 3.0–4.0 | 2.0–2.5 | 1731 | $2,875 | $1.66 | 43d | 7 | 1.30mi |
| 2314 Red Slate Dr Rosharon, TX | 4.0 | 4.0 | 2531 | $2,850 | $1.13 | 43d | 1 | 1.34mi |
| 8210 Radial Ct Rosharon, TX | 5.0 | 2.5 | 2506 | $2,550 | $1.02 | 43d | 1 | 1.34mi |
| 10610 Cascade Creek Dr Rosharon, TX | 3.0 | 2.0 | 1548 | $2,700 | $1.74 | 43d | 1 | 1.46mi |
| 10502 Moon Valley Ln Rosharon, TX | 3.0 | 2.0 | 1615 | $2,725 | $1.69 | 1d | 1 | 1.46mi |
| 10507 Moon Valley Ln Rosharon, TX | 3.0 | 2.0 | 1548 | $2,650 | $1.71 | 1d | 1 | 1.46mi |
| 10622 Cascade Creek Dr Rosharon, TX | 4.0 | 2.0 | 1780 | $2,775 | $1.56 | 43d | 1 | 1.49mi |
HOA detail
- Monthly dues
- $75 · $900/yr
Listing history 2 events
-
2026-04-23price $319,490 946-char remark
Show marketing remark (946 chars)
Welcome to the Harris plan in the Caldwell Crossing community! This single-story home spans 1,831 sq. ft. and features 4 bedrooms, 2.5 bathrooms, and a 2-car garage. Upon entering, you'll find two secondary bedrooms with access to a shared bathroom, each with carpet flooring, a bright window, and a tall closet. The bathroom has vinyl flooring and a tub/shower combo. Further down the foyer, you'll pass the powder room, utility room (with washer/dryer space), and a third secondary bedroom with carpet flooring and a tall closet. At the back of the home is the open-concept family room, dining room, and L-shaped kitchen, perfect for entertaining. The kitchen has stainless-steel appliances, a pantry, and vinyl floors. The primary bedroom features carpet flooring, two windows, and a walk-in closet. The primary bathroom includes double sinks, a tub/shower combo, and a separate toilet room. Enjoy the covered back patio and spacious backyard!
-
2026-03-25$335,490 Active 946-char remark
Show marketing remark (946 chars)
Welcome to the Harris plan in the Caldwell Crossing community! This single-story home spans 1,831 sq. ft. and features 4 bedrooms, 2.5 bathrooms, and a 2-car garage. Upon entering, you'll find two secondary bedrooms with access to a shared bathroom, each with carpet flooring, a bright window, and a tall closet. The bathroom has vinyl flooring and a tub/shower combo. Further down the foyer, you'll pass the powder room, utility room (with washer/dryer space), and a third secondary bedroom with carpet flooring and a tall closet. At the back of the home is the open-concept family room, dining room, and L-shaped kitchen, perfect for entertaining. The kitchen has stainless-steel appliances, a pantry, and vinyl floors. The primary bedroom features carpet flooring, two windows, and a walk-in closet. The primary bathroom includes double sinks, a tub/shower combo, and a separate toilet room. Enjoy the covered back patio and spacious backyard!
ⓘ Source: listings_history table (triggers on properties + properties_extension) + one-shot
backfill from property_details.listing_events for pre-trigger history.
Nearby sold comps map
Loading sold comps map…
Walkable amenities ~0.75 mi
Loading nearby amenities…
Taxation est. · year 1
- Rental income
- $32,401
- − Mortgage interest
- −$17,896
- − Property taxes
- −$4,792
- − Insurance
- −$1,597
- − Repairs & maintenance
- −$2,592
- − Management
- −$2,592
- − HOA
- −$900
- − Depreciation
- −$9,294
- Taxable loss
- −$7,263
- Est. tax savings @ 24.0%
- +$1,743
- After-tax cash flow
- $-55/yr
For passive investors: Depreciation is non-cash, so a rental often shows a tax loss while cash-flowing — sheltering income. Rental losses are passive: they offset passive income freely, and up to $25,000/yr can offset ordinary (W-2) income if you actively participate and your MAGI is under $100k (phasing out to $0 by $150k); unused losses carry forward. On sale, claimed depreciation is recaptured at up to 25%, and gains may owe capital-gains tax (a 1031 exchange can defer both). Figures are a year-1 estimate at your 24.0% rate — not tax advice; consult a CPA.
Condition & rehab AI · 1 photo
This single-story home in the Caldwell Crossing community is in good condition with minimal repairs needed. It offers a good balance of updates and maintenance to increase its resale and rental value.
Value-add opportunities
- Both Painting exterior and interior walls — Enhances curb appeal and interior aesthetics
- Both Landscaping and curb appeal improvements — Improves curb appeal and enhances property value
- Resale Replace carpet with hardwood or tile in bedrooms — Hardwood or tile flooring is more desirable and durable
- Both Install smart home features — Enhances home's appeal and marketability
Renovation cost estimate screening
Value-add ROI direction
- Both Painting exterior and interior walls — Enhances curb appeal and interior aesthetics ↑
- Both Landscaping and curb appeal improvements — Improves curb appeal and enhances property value ↑
- Resale Replace carpet with hardwood or tile in bedrooms — Hardwood or tile flooring is more desirable and durable ↑
- Both Install smart home features — Enhances home's appeal and marketability ↑
ⓘ Cost ranges are severity-bucket heuristics (US national rule-of-thumb). Get contractor quotes + a written scope before underwriting a rehab budget.
Schools (NCES district)
- District
- Alvin ISD
- NCES district ID
- 4808090
- Math proficiency
- 39% ▼ -11.00%
- Reading proficiency
- 48% ▬ 0.00%
- Median HH income
- $66,740
- Composite
- 38.96/100
- National rank
- #4080
- State rank
- #255 of 826 in TX
Livability — Iowa Colony
- Score
- 64/100
- State rank
- #757
- US rank
- #13904
Category grades
Schools grade is shown separately in the Schools card above.
Census & demographics
- Census place
- Iowa Colony, TX
- County
- Brazoria County · 374,982 people
- City population
- 26,236
- Metro
- Houston-The Woodlands-Sugar Land, TX
- Population (ZIP)
- 52,747
- Household income
- $119,287
- Rent vs Own
- Severe rent burden
- 251.0
Population outlook (Brazoria County) Hauer SSP2
- Today (2025)
- 420,414 people
- By 2030
- 457,585 · +8.8%
- By 2040
- 532,232 · +26.6%
- By 2050
- 605,399 · +44.0%
- By 2075
- 779,358 · +85.4%
- By 2100
- 883,759 · +110.2%
Race, ethnicity, and origin ACS 2023
- Neighborhood character
- Highly diverse neighborhood (Simpson 0.70)
- Race & ethnicity
- Hispanic / Latino 38% Black 34% White 20% Two or more races 18% Asian 5%
- Hispanic origin (detail)
- Mexican 31% Puerto Rican 2%
- Common ancestry
- Lithuanian 1% Slovak 1% Romanian 1%
- Foreign-born
- 16% · Canada, Vietnam, China
- Languages at home
- 64% English-only · Spanish 28% Other Asian/Pacific 2% Vietnamese 1%
Political lean MEDSL · Brazoria
- 2024 margin
- R (+19.7) · D 39.5% · R 59.2% · Other 1.3%
- 2008→2024 swing
- +9.9pp toward D · 2008: -29.6pp · 2024: -19.7pp
- All cycles
- 2024: R+19.7 2020: R+18.2 2016: R+24.6 2012: R+34.2 2008: R+29.6
Not yet ingested
- Civics
- —
Market trends
- HPI YoY
- ▼ -120.19%
- Current HPI
- 198.6559
- Rent YoY
- ▲ 0.44%
- Metro
- Houston-The Woodlands-Sugar Land, TX
- State GDP YoY
- ▲ 3.95%
- F500 in state
- 110
Industry mix (Fortune 500 HQ in TX)
| Industry | F500 HQs | Revenue |
|---|---|---|
| Energy | 16 | $1,198B |
|
||
| Technology | 5 | $198B |
|
||
| Engineering / Construction | 4 | $72B |
|
||
| Energy Services | 3 | $60B |
|
||
| Utilities | 3 | $41B |
|
||
| Healthcare | 2 | $330B |
|
||
Price history
-4.8% since first listed2 events — show timeline
- 2026-04-23 Price Changed $319,490 HARMLS
- 2026-03-25 Listed $335,490 HARMLS
Cash-flow waterfall
monthlySold comps — $/sqft
last 12 mo · ≤1 miLoading sold comps…