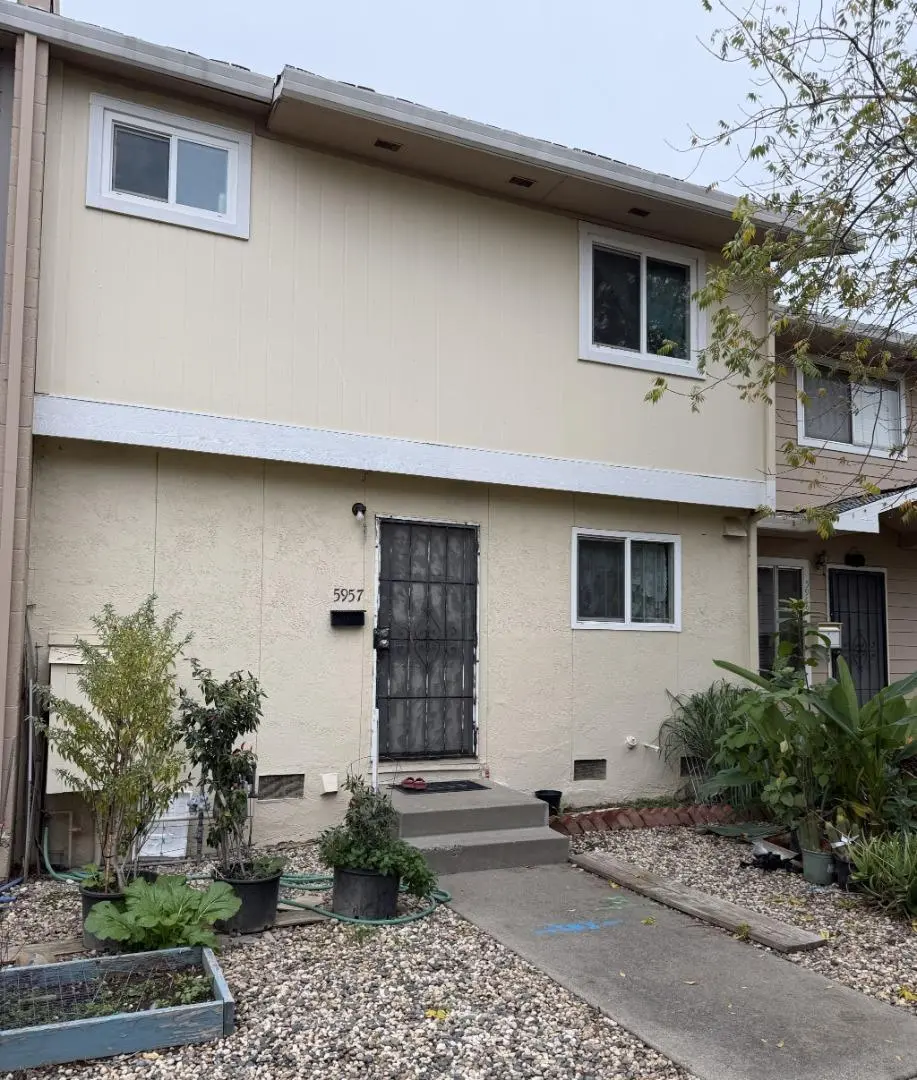
5957 Mack Rd · Sacramento, CA
Flood risk 1/10 · Minimal
- FEMA flood zone
- X (shaded)
- Chance of flooding over 30 yrs
- 0.0%
- Est. flood insurance / yr
- $507 – $1,088
Fire risk 2/10 · Minimal
- Est. fire insurance / yr
- $659 – $1,223
Heat risk 7/10 · Major
- Hot days now (above 102°F)
- 7 days/yr
- Hot days in 30 yrs
- 15 days/yr
Wind risk 1/10 · Minimal
- Chance of severe wind over 30 yrs
- —
Air-quality risk 10/10 · Severe
- Unhealthy air days now
- 28 days/yr
- Unhealthy air days in 30 yrs
- 33 days/yr
Risk factors via First Street. Map © Google.
Why this score? — see what drove the C- grade
The composite is a weighted blend of 9 inputs, each scored 0–100. Each bar is that input's sub-score; the figure is the points it added to the 100-point composite (weight × sub-score).
- Cash flow +15.5/30.0
- ARV discount +15.0/15.0
- 1% rule +5.9/10.0
- DSCR +4.8/10.0
- Schools +4.1/10.0
- Livability +3.6/5.0
- Rent growth +2.5/5.0
- Condition / age +2.5/5.0
- Appreciation +0.0/10.0
$225,000
🖨 Deal sheet 📄 Offer letter ✓ Due diligence
Listing remarks MLS
Wecome to this charming 3 beds, 1.5 bath townhouse offering a fantastic opportunity to add your personal touch. The spacious layout includes a convenient downstairs half bath, generous living area, and 3 well-size bedrooms. Though the home could use updating, it's clean, functional, and full of potential. Perfect for buyers looking to create their own modern style or investors seeking a great value. Enjoy easy access to shops, dining, and major commute routes. Don't miss this chance to transform this home into a gem.
Key facts
- $365 HOA
- 2 garage spots
- Built 1966
Neighborhood map
What this means for you Summary
Snapshot
- This is a 3-bed/1.5-bath condo listed at $225k.
Deal economics
- At list price, monthly cash flow is $89 ($1k/yr) — positive.
- The deal already cash-flows at list — no discount required.
- Meets the 1% rule at list price ($2k rent vs $225k).
- Recommended offer: $198k (12.0% below list) — sets the bar for market timing.
- Cap rate 6.8% vs local median 3.0% in Sacramento — top-decile yield for the area; either an underpriced asset or a hidden risk that comps aren't pricing in. Stress-test before assuming the spread holds.
Location & tenants
- Location reads 71/100 on livability (#218 in CA) — a middle-class / working-renter tenant base. Strengths: amenities A+, commute A+, housing A; Watch: schools D+, crime F, cost of living F.
- Elk Grove Unified (suburban): math 40% / reading 51% proficiency, ranked #165 of 517 in CA (top 32%) — families likely to look elsewhere, expect single-tenant / working-renter base with shorter leases.
- Market conditions: Rents flat; 181 active listings in the ZIP; 23 comparable units currently listed for rent nearby; rentals at typical pace (median 24d on market — plan ~3-4 weeks tenant-placement turnaround); 43% of comp listings sitting > 30 days — soft ceiling on asking rent; 6,825 units permitted in Sacramento County in 2024 (1,752 in 5+ unit buildings).
- This rent runs 44% of the median local income ($67k/yr) — at the standard rent-burdened threshold; future hikes will face affordability resistance.
Forward outlook
- Local home prices are declining (-3.0%/yr); year-one equity from $2k of loan paydown is wiped out by about $7k of value loss. Plan a longer hold.
- Sacramento County population projected at +17% by 2050 — long-run rental-demand tailwind backs the buy-and-hold thesis.
Negotiation context
- It's been on market 194 days — a 12% lower offer ($198k) is reasonable based on typical stale-listing flexibility.
- 2 sale attempts; this cycle's ask has dropped $25k (10%) from the opening price — seller is motivated, your offer sets the floor, not the list.
- Current owner paid $40k; list at $225k implies a 462% gain — meaningful room to come down on a strong offer.
Risks & watch-outs
- Climate carrying-cost: extreme-heat days projected 7→15/yr by 2055 (HVAC capex compounding) — expect insurance premiums to compound above CPI over the hold.
Questions for the listing agent
- It's been on market 194 days. Have you received any prior offers? Is the seller open to a 12% concession, seller financing, or rate buy-down credit?
- Built in 1966 — when were the roof, HVAC, electrical panel, plumbing, and water heater last replaced?
- What does the HOA fee cover, when was the last increase, and are there any pending special assessments or reserve-fund shortfalls?
- Any open or pending special assessments — roof, HVAC, plumbing, elevator, façade? What's the per-unit balance and payoff schedule, and is the seller paying it off at close or rolling it to the buyer?
- Why hasn't it sold? Are there any deal-killer items the seller is aware of (foundation, flood, title, zoning, code violations)?
- Is there a deadline driving the sale (1031 exchange, divorce, estate, relocation)? That informs how much negotiation room exists.
- Schools are D-rated, which usually means shorter tenancies and higher turnover. Who's the typical renter profile here, and what's been the actual vacancy rate?
- Crime grade is F in this area — have there been break-ins, vandalism, or insurance claims at this property in the last 3 years? What carrier currently insures it and at what premium?
- What's the average days-on-market for RENTAL listings here right now (not sales)? A rising rental-DOM trend means longer vacancies and softer asking-rent achievability than the comps imply.
- What's the recent tenant-quality profile in this submarket — average credit score on applications, eviction rate, late-payment / NSF rate, and stable-employment percentage? A property-management company in the area should have these aggregated.
- How much new apartment / multifamily construction is in the pipeline within 1–3 miles? Heavy new supply (>2% of stock underway) typically softens rents 12–24 months out; light construction supports rent growth.
Investment metrics
- 1% rule
- 1.09% ✓
- Cap rate
- 6.77%
- Cash-on-cash
- 1.69%
- DSCR
- 1.08
- GRM
- 7.7
CMA / ARV
- ARV (median comp)
- $284,637
- List price
- $225,000
- Delta
- -20.95%
- Verdict
- UNDERPRICED
- Comps
- 20 within 1.0 mi
Projected returns pro-forma
-3.0% appreciation · 0.02% rent growth · sell at horizon
- IRR
- -17.5%
- Equity multiple
- 0.40×
- Total profit
- $-37,731
- Equity at exit
- $33,548
- IRR
- -18.2%
- Equity multiple
- 0.17×
- Total profit
- $-52,279
- Equity at exit
- $19,454
Cash invested: $63,000 (down + closing). Projections, not guarantees.
Landlord ↔ Tenant lean methodology
- Overall (STATE)
- 18 Strongly Tenant-Friendly
- State California
- 18 Strongly Tenant-Friendly · D+13
- County
- — inherits STATE
- City
- — inherits STATE
ZIP-level market 95823
- Rents YoY
- 0.0%
- Active inventory
- 181
- Price-to-rent
- 7.7×
Monthly cashflow live
- Estimated rent
- $2,449 high interval (Pro) →
- Mortgage (P&I)
- −$1,180
- Tax from tax record
- −$207 /mo · $2,488/yr
- Insurance
- −$94
- HOA
- −$365
- Vacancy / Maint / Mgmt
- −$514
- Net cashflow
- $89
Break-even live
UW: 25.0% down · 7.5% · 30yr · 1.5% tax · 5.0% vac · 8.0% maint · 8.0% mgmt
Financing live
Cash to close
- Down payment
- $56,250
- Closing costs
- $6,750
- Reserves months
- —
- Total cash needed
- —
Loan-product check · same deal, 3 products live
Conventional
25% down · 7.5% · 30yr
- Down + closing
- —
- Monthly P&I
- —
- Monthly cashflow
- —
- DSCR
- —
- Eligible?
- —
Personal DTI + credit; lowest rate.
DSCR
20% down · 8.5% · 30yr
- Down + closing
- —
- Monthly P&I
- —
- Monthly cashflow
- —
- DSCR
- —
- Eligible?
- —
No personal income docs; deal must DSCR.
Hard money
10% down · 12.0% · 12mo
- Down + closing
- —
- Monthly P&I
- —
- Monthly cashflow
- —
- DSCR
- —
- Eligible?
- —
Short-term bridge; refi at stabilization.
Rent comps 23 comps
| Address | Beds | Baths | Sqft | Rent | $/sqft | DOM | Units | Dist |
|---|---|---|---|---|---|---|---|---|
| 5943 Mack Rd Sacramento, CA | 3.0 | 2.0 | 1309 | $2,495 | $1.91 | 14d | 1 | 0.01mi |
| 7982 Center Pkwy Sacramento, CA | 3.0 | 2.0 | 1640 | $2,400 | $1.46 | 11d | 1 | 0.59mi |
| 7874 Golden Field Way Sacramento, CA | 3.0 | 1.0 | 1014 | $2,100 | $2.07 | 14d | 1 | 0.60mi |
| 6808 Wyndham Dr Sacramento, CA | 2.0 | 1.0–2.0 | 742 | $2,165 | $2.92 | 1d | 7 | 0.78mi |
| 7416 Mimosa Way Sacramento, CA | 4.0 | 2.5 | 1582 | $2,475 | $1.56 | 43d | 1 | 0.80mi |
| 4985 Valley Hi Dr Sacramento, CA | 3.0 | 2.0 | 1507 | $2,300 | $1.53 | 43d | 1 | 0.83mi |
| 4690 Brookfield Dr Sacramento, CA | 4.0 | 2.0 | 1753 | $2,500 | $1.43 | 19d | 1 | 0.87mi |
| 7826 Brizio Walk Sacramento, CA | 3.0 | 2.5 | 1616 | $2,950 | $1.83 | 2d | 1 | 0.98mi |
| 7639 Clover Woods Ct Sacramento, CA | 2.0 | 1.0 | 1032 | $1,895 | $1.84 | 43d | 1 | 1.13mi |
| 8236 Center Pkwy #59 Sacramento, CA | 2.0 | 1.0 | 906 | $1,825 | $2.01 | 4d | 1 | 1.16mi |
| 7283 Florin Mall Dr #14 Sacramento, CA | 2.0 | 2.0 | 902 | $1,675 | $1.86 | 43d | 1 | 1.17mi |
| 7733 Robinette Rd Sacramento, CA | 3.0 | 2.0 | 1120 | $2,150 | $1.92 | 43d | 1 | 1.23mi |
| 7252 Florin Mall Dr Unit 7252 Sacramento, CA | 2.0 | 2.0 | 900 | $1,725 | $1.92 | 43d | 1 | 1.25mi |
| 4264 Chinquapin Way Sacramento, CA | 2.0 | 1.0 | 900 | $2,195 | $2.44 | 43d | 1 | 1.28mi |
| 4623 Goya Pkwy Sacramento, CA | 3.0 | 2.0 | 1242 | $2,400 | $1.93 | 43d | 1 | 1.28mi |
| 451 Ashwick Loop Sacramento, CA | 3.0 | 2.5 | 1538 | $2,395 | $1.56 | 7d | 1 | 1.33mi |
| 4812 D Pkwy Sacramento, CA | 3.0 | 1.5 | 1505 | $2,295 | $1.52 | 23d | 1 | 1.38mi |
| 8112 Creeping Willow Ln Sacramento, CA | 3.0 | 2.5 | 1214 | $2,495 | $2.06 | 11d | 1 | 1.42mi |
| 4400 Shining Star Dr Sacramento, CA | 1.0–4.0 | 1.0–2.0 | 1225 | $2,768 | $2.26 | 43d | 1 | 1.44mi |
| 88 Del Vista Cir Sacramento, CA | 2.0 | 2.0 | 1037 | $1,795 | $1.73 | 23d | 1 | 1.44mi |
| 4074 Weymouth Ln Sacramento, CA | 2.0 | 2.0 | 1200 | $2,498 | $2.08 | 17d | 1 | 1.47mi |
| 4066 Weymouth Ln Sacramento, CA | 3.0 | 1.5 | 1323 | $1,900 | $1.44 | 43d | 1 | 1.47mi |
| 8159 Laurel Willow Ln Sacramento, CA | 3.0 | 2.5 | 1214 | $2,396 | $1.97 | 4d | 1 | 1.48mi |
HOA detail condo
- Monthly dues
- $365 · $4,380/yr
- Assessments
- None detected in remarks — confirm with the listing agent.
Listing history 20 events
-
2026-06-18days on market $225,000 Active 194 DOM
-
2026-06-17days on market $225,000 Active 193 DOM
-
2026-06-16days on market $225,000 Active 192 DOM
-
2026-06-15days on market $225,000 Active 191 DOM
-
2026-06-13days on market $225,000 Active 189 DOM
-
2026-06-13days on market $225,000 Active 188 DOM
-
2026-06-09days on market $225,000 Active 185 DOM
-
2026-06-08days on market $225,000 Active 184 DOM
-
2026-06-07days on market $225,000 Active 183 DOM
-
2026-06-05days on market $225,000 Active 180 DOM
-
2026-06-03remarks 539-char remark
-
2026-06-03pricedays on market $225,000 Active 179 DOM
-
2026-06-01days on market $250,000 Active 178 DOM
-
2026-05-31days on market $250,000 Active 177 DOM
-
2025-12-05$250,000 Active 522-char remark
Show marketing remark (522 chars)
Wecome to this charming 3 beds, 1.5 bath townhouse offering a fantastic opportunity to add your personal touch. The spacious layout includes a convenient downstairs half bath, generous living area, and 3 well-size bedrooms. Though the home could use updating, it's clean, functional, and full of potential. Perfect for buyers looking to create their own modern style or investors seeking a great value. Enjoy easy access to shops, dining, and major commute routes. Don't miss this chance to transform this home into a gem.
-
1997-12-16soldstatus $40,000
-
1992-08-19soldstatus $81,500
-
1992-05-01soldstatus $81,500
-
1987-12-30soldstatus $1,175,000
ⓘ Source: listings_history table (triggers on properties + properties_extension) + one-shot
backfill from property_details.listing_events for pre-trigger history.
Tax reassessment forecast CA · Resets to sale price
- Current annual tax
- $2,488 · $207/mo
- Projected year-2 tax
- $2,488 · $207/mo
- Expected delta
- $0/yr ($0/mo · 0.0%)
ⓘ Screening estimate from a state-policy table — verify with the county assessor before closing.
Climate risk First Street
- Flood 1/10 Low FEMA zone X (shaded) · 0% chance over 30 yrs
- Wildfire 2/10 Low
- Heat 7/10 Severe 7 d/yr ≥102°F today · 15 d/yr by 30 yrs out
- Wind 1/10 Low
- Air quality 10/10 Extreme 28 unhealthy d/yr today · 33 by 30 yrs out
Nearby sold comps map
Loading sold comps map…
Walkable amenities ~0.75 mi
Loading nearby amenities…
Taxation est. · year 1
- Rental income
- $29,386
- − Mortgage interest
- −$12,603
- − Property taxes
- −$2,488
- − Insurance
- −$1,125
- − Repairs & maintenance
- −$2,351
- − Management
- −$2,351
- − HOA
- −$4,380
- − Depreciation
- −$6,545
- Taxable loss
- −$2,457
- Est. tax savings @ 24.0%
- +$590
- After-tax cash flow
- $1,653/yr
For passive investors: Depreciation is non-cash, so a rental often shows a tax loss while cash-flowing — sheltering income. Rental losses are passive: they offset passive income freely, and up to $25,000/yr can offset ordinary (W-2) income if you actively participate and your MAGI is under $100k (phasing out to $0 by $150k); unused losses carry forward. On sale, claimed depreciation is recaptured at up to 25%, and gains may owe capital-gains tax (a 1031 exchange can defer both). Figures are a year-1 estimate at your 24.0% rate — not tax advice; consult a CPA.
Schools (NCES district)
- District
- Elk Grove Unified
- NCES district ID
- 0612330
- Math proficiency
- 40% ▼ -5.00%
- Reading proficiency
- 51% ▼ -5.00%
- Median HH income
- $67,860
- Composite
- 40.72/100
- National rank
- #3658
- State rank
- #165 of 517 in CA
Livability — Sacramento
- Score
- 71/100
- State rank
- #218
- US rank
- #6957
Category grades
Schools grade is shown separately in the Schools card above.
Census & demographics
- Census place
- Sacramento, CA
- County
- Sacramento County · 1,539,646 people
- City population
- 761,410
- Metro
- Sacramento-Roseville-Folsom, CA
- Population (ZIP)
- 83,607
- Household income
- $66,895
- Rent vs Own
- Severe rent burden
- 4034.0
Population outlook (Sacramento County) Hauer SSP2
- Today (2025)
- 1,660,763 people
- By 2030
- 1,732,990 · +4.3%
- By 2040
- 1,855,755 · +11.7%
- By 2050
- 1,941,335 · +16.9%
- By 2075
- 2,046,162 · +23.2%
- By 2100
- 1,961,444 · +18.1%
Race, ethnicity, and origin ACS 2023
- Neighborhood character
- Highly diverse neighborhood (Simpson 0.77)
- Race & ethnicity
- Hispanic / Latino 35% Asian 25% Black 17% Two or more races 16% White 11% Pacific Islander 4% Native American 1%
- Hispanic origin (detail)
- Mexican 29% Puerto Rican 1%
- Common ancestry
- Lithuanian 1% Italian 1% Scotch-Irish 1%
- Foreign-born
- 30% · Canada, Vietnam, China
- Languages at home
- 47% English-only · Spanish 25% Other Asian/Pacific 9% Other Indo-European 8%
Political lean MEDSL · Sacramento
- 2024 margin
- D (+19.7) · D 58.1% · R 38.4% · Other 3.5%
- 2008→2024 swing
- +0.7pp no change · 2008: 19.0pp · 2024: 19.7pp
- All cycles
- 2024: D+19.7 2020: D+25.3 2016: D+23.7 2012: D+16.3 2008: D+19.0
Not yet ingested
- Civics
- —
Market trends
- HPI YoY
- ▼ -331.02%
- Current HPI
- 377.4278
- Rent YoY
- ▬ 0.02%
- Metro
- Sacramento-Roseville-Folsom, CA
- State GDP YoY
- ▲ 3.21%
- F500 in state
- 116
Industry mix (Fortune 500 HQ in CA)
| Industry | F500 HQs | Revenue |
|---|---|---|
| Technology | 27 | $1,492B |
|
||
| Financial Services | 3 | $174B |
|
||
| Retail | 3 | $44B |
|
||
| Insurance | 3 | $26B |
|
||
| Media / Entertainment | 2 | $115B |
|
||
| Pharmaceuticals / Biotech | 2 | $62B |
|
||
Price history
-78.7% since first listed6 events — show timeline
- 2025-12-05 Listed $250,000 MLSListings
- 2025-12-05 Listed $250,000 bridgeMLS, Bay East AOR, or Contra Costa AOR
- 1997-12-16 Sold (Public Records) $40,000 Public Records
- 1992-08-19 Sold (Public Records) $81,500 Public Records
- 1992-05-01 Sold (Public Records) $81,500 Public Records
- 1987-12-30 Sold (Public Records) $1,175,000 Public Records
Property tax history
+5.7%/yrLatest (2025): $2,488 · -13.3% YoY. Source: county tax records.
Cash-flow waterfall
monthlySold comps — $/sqft
last 12 mo · ≤1 miLoading sold comps…