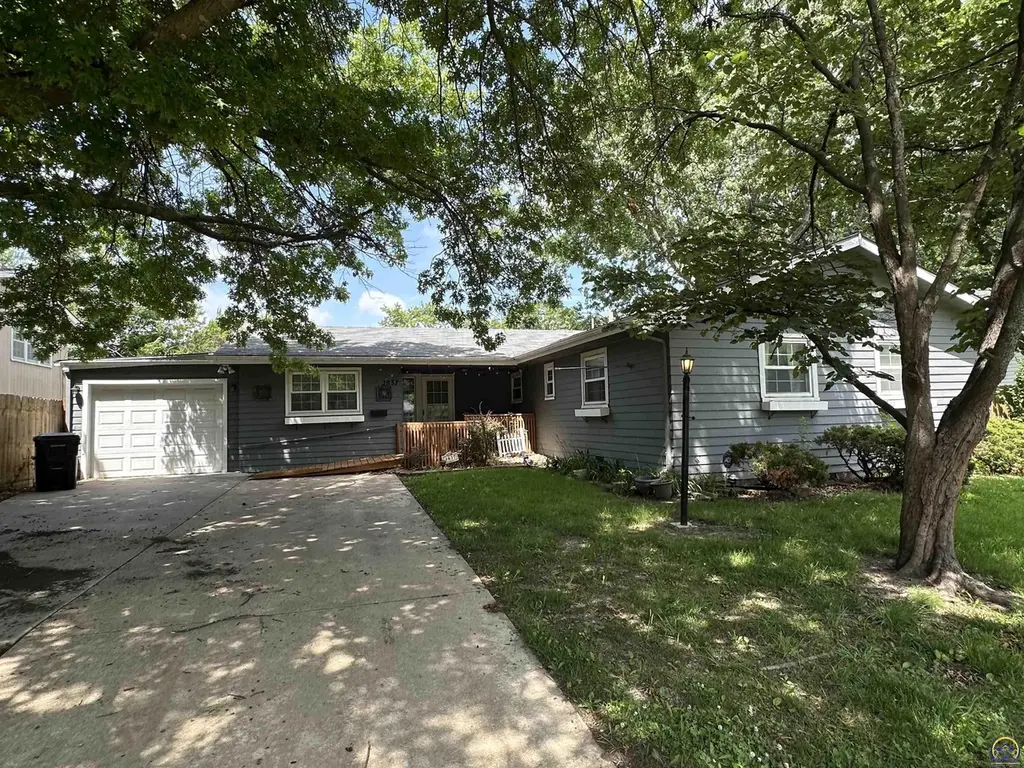
2837 SW Mcalister Ave · Topeka, KS
Flood risk 1/10 · Minimal
- FEMA flood zone
- X (unshaded)
- Chance of flooding over 30 yrs
- 0.0%
- Est. flood insurance / yr
- $507 – $1,088
Fire risk 4/10 · Minor
- Est. fire insurance / yr
- $1,154 – $2,142
Heat risk 5/10 · Moderate
- Hot days now (above 107°F)
- 7 days/yr
- Hot days in 30 yrs
- 17 days/yr
Wind risk 2/10 · Minimal
- Chance of severe wind over 30 yrs
- —
Air-quality risk 3/10 · Minor
- Unhealthy air days now
- 3 days/yr
- Unhealthy air days in 30 yrs
- 4 days/yr
Risk factors via First Street. Map © Google.
Why this score? — see what drove the C- grade
The composite is a weighted blend of 9 inputs, each scored 0–100. Each bar is that input's sub-score; the figure is the points it added to the 100-point composite (weight × sub-score).
- Cash flow +17.0/30.0
- ARV discount +15.0/15.0
- DSCR +5.3/10.0
- 1% rule +5.0/10.0
- Rent growth +5.0/5.0
- Livability +3.5/5.0
- Condition / age +2.5/5.0
- Schools +1.7/10.0
- Appreciation +0.0/10.0
$150,000
🖨 Deal sheet 📄 Offer letter ✓ Due diligence
Listing remarks
Affordably priced 4 bedroom, 2 bath ranch home with over 1600 square feet on the main floor! Covered deck in the back, multiple living spaces, & nicer windows. Priced below county value and is being sold as-is!
Key facts
- Covered deck
- 7,841 sq ft lot
- Built 1956
Tags
Property features AI
Finance
- Other: Lot size approximately 0.18 acres; Property listed by ReeceNichols Topeka Elite
Exterior
- Parking: Carport
- Utilities: Public water; Public sewer
- Home design: Single family residence; Residential property; Single house
- Construction: Frame construction; Composition roof; Above-grade finished living area approximately 1,608 (value provided)
- Exterior features: Deck; Fenced yard
Interior
- Kitchen: Gas range; Microwave; Dishwasher; Refrigerator
- Flooring: Hardwood; Vinyl; Carpet
- Bathrooms: 2 full bathrooms
- Heating & cooling: Central air conditioning
- Interior features: Gas water heater; Concrete and crawl space basement
- Laundry & utility: Washer; Dryer; Main level laundry
Neighborhood map
What this means for you Summary
Snapshot
- This is a 3-bed/2.0-bath single-family listed at $150k.
Deal economics
- At list price, monthly cash flow is $103 ($1k/yr) — positive.
- The deal already cash-flows at list — no discount required.
- Meets the 1% rule at list price ($2k rent vs $150k).
- Cap rate 7.1% vs local median 4.3% in Topeka — top-decile yield for the area; either an underpriced asset or a hidden risk that comps aren't pricing in. Stress-test before assuming the spread holds.
Location & tenants
- Location reads 69/100 on livability (#195 in KS) — a middle-class / working-renter tenant base. Strengths: cost of living A+, housing A+, health & safety A+; Watch: employment C-, crime F, commute F.
- Topeka Public Schools (urban): math 17% / reading 23% proficiency, ranked #158 of 169 in KS (top 94%) — low school quality limits family demand, transient renter base, plan for 1-2y turnover; 69% free/reduced lunch — lower-income household profile, screen leases tightly.
- Zoned schools: Marjorie French Middle School (math 23% / reading 30%, grade F, #98 of 219 statewide, top 44%, 436 students, 70% FRL); Topeka West High (math 13% / reading 20%, grade F, #244 of 327 statewide, top 75%, 1,085 students, 59% FRL) — zoned schools at 64% FRL track the district average.
- Market conditions: Rents rising fast (+9.9%/yr); 137 active listings in the ZIP; 5 comparable units currently listed for rent nearby; rentals at typical pace (median 21d on market — plan ~3-4 weeks tenant-placement turnaround); 219 units permitted in Shawnee County in 2024 (25 in 5+ unit buildings).
Forward outlook
- Local home prices are declining (-3.0%/yr); year-one equity from $1k of loan paydown is wiped out by about $4k of value loss. Plan a longer hold.
- Shawnee County population projected to shrink 7% by 2050 — rents likely to lag national; underwrite the cash flow, not the appreciation.
- At projected returns (-3.0% appreciation + 8.0% rent growth), your $42k cash investment doubles in ~10 years — after that, you're playing with house money.
Negotiation context
- Only 3 days on market — expect competitive offers; lowballing is unlikely to land.
- Current owner paid $68k; list at $150k implies a 122% gain — meaningful room to come down on a strong offer.
Risks & watch-outs
- Watch-outs: built in 1956 — expect roof / HVAC / electrical / plumbing capex.
- Climate carrying-cost: extreme-heat days projected 7→17/yr by 2055 (HVAC capex compounding) — expect insurance premiums to compound above CPI over the hold.
Questions for the listing agent
- Built in 1956 — when were the roof, HVAC, electrical panel, plumbing, and water heater last replaced?
- Is there a deadline driving the sale (1031 exchange, divorce, estate, relocation)? That informs how much negotiation room exists.
- Schools are D-rated, which usually means shorter tenancies and higher turnover. Who's the typical renter profile here, and what's been the actual vacancy rate?
- Crime grade is F in this area — have there been break-ins, vandalism, or insurance claims at this property in the last 3 years? What carrier currently insures it and at what premium?
- What's the average days-on-market for RENTAL listings here right now (not sales)? A rising rental-DOM trend means longer vacancies and softer asking-rent achievability than the comps imply.
- What's the recent tenant-quality profile in this submarket — average credit score on applications, eviction rate, late-payment / NSF rate, and stable-employment percentage? A property-management company in the area should have these aggregated.
- How much new for-sale + rental construction is in the pipeline within 1–3 miles? Heavy new supply typically softens prices + rents 12–24 months out; constrained supply supports both.
Investment metrics
- 1% rule
- 1.00% ✓
- Cap rate
- 7.11%
- Cash-on-cash
- 2.93%
- DSCR
- 1.13
- GRM
- 8.3
CMA / ARV
- ARV (on-the-fly)
- $180,096
- Comps found
- 5
Show comp detail 5 sales within ~0.75 mi
| Address | Dist | Beds/Ba | Sqft | Sold | Price | $/sf | Match |
|---|---|---|---|---|---|---|---|
| 4212 SW 28th Ter | 0.10mi | 4/1.5 (+1) | 1,508 (-6%) | 0mo | $225,000 | $149 | 78 |
| 4413 SW Twilight Dr | 0.27mi | 4/2.0 (+1) | 1,695 (+5%) | 3mo | $244,900 | $144 | 71 |
| 4200 29th St | 0.11mi | 4/1.5 (+1) | 1,792 (+11%) | 9mo | $110,000 | $61 | 61 |
| 2505 SW Burnett Rd | 0.45mi | 3/2.0 | 1,560 (-3%) | 21mo | $170,000 | $109 | 57 |
| 4907 30th St | 0.45mi | 3/2.0 | 1,512 (-6%) | 24mo | $169,000 | $112 | 49 |
Match score weights: distance 35% · size 25% · config 20% · recency 20%. Top-matched comps best support the ARV.
Projected returns pro-forma
-3.0% appreciation · 8.0% rent growth · sell at horizon
- IRR
- -6.0%
- Equity multiple
- 0.77×
- Total profit
- $-9,773
- Equity at exit
- $22,365
- IRR
- 9.1%
- Equity multiple
- 1.86×
- Total profit
- $36,269
- Equity at exit
- $12,969
Cash invested: $42,000 (down + closing). Projections, not guarantees.
Landlord ↔ Tenant lean methodology
- Overall (STATE)
- 83 Strongly Landlord-Friendly
- State Kansas
- 83 Strongly Landlord-Friendly · R+10
- County
- — inherits STATE
- City
- — inherits STATE
ZIP-level market 66614
- Rents YoY
- 9.9%
- Active inventory
- 137
- Price-to-rent
- 8.3×
Monthly cashflow live
- Estimated rent
- $1,503 high interval (Pro) →
- Mortgage (P&I)
- −$787
- Tax from tax record
- −$235 /mo · $2,825/yr
- Insurance
- −$62
- HOA
- −$0
- Vacancy / Maint / Mgmt
- −$316
- Net cashflow
- $103
Break-even live
UW: 25.0% down · 7.5% · 30yr · 1.5% tax · 5.0% vac · 8.0% maint · 8.0% mgmt
Financing live
Cash to close
- Down payment
- $37,500
- Closing costs
- $4,500
- Reserves months
- —
- Total cash needed
- —
Loan-product check · same deal, 3 products live
Conventional
25% down · 7.5% · 30yr
- Down + closing
- —
- Monthly P&I
- —
- Monthly cashflow
- —
- DSCR
- —
- Eligible?
- —
Personal DTI + credit; lowest rate.
DSCR
20% down · 8.5% · 30yr
- Down + closing
- —
- Monthly P&I
- —
- Monthly cashflow
- —
- DSCR
- —
- Eligible?
- —
No personal income docs; deal must DSCR.
Hard money
10% down · 12.0% · 12mo
- Down + closing
- —
- Monthly P&I
- —
- Monthly cashflow
- —
- DSCR
- —
- Eligible?
- —
Short-term bridge; refi at stabilization.
Rent comps 5 comps
| Address | Beds | Baths | Sqft | Rent | $/sqft | DOM | Units | Dist |
|---|---|---|---|---|---|---|---|---|
| 4110 SW Twilight Dr Topeka, KS | 2.0 | 1.5 | 1746 | $1,150 | $0.66 | 21d | 1 | 0.38mi |
| 3211 SW Twilight Ct Topeka, KS | 1.0–3.0 | 1.0–2.0 | 965 | $1,245 | $1.29 | 21d | 6 | 0.42mi |
| 2320 SW Valley Brook Ln Topeka, KS | 3.0 | 1.0 | 1200 | $1,500 | $1.25 | 21d | 1 | 0.74mi |
| 2211 SW Burnett Rd Topeka, KS | 3.0 | 1.0 | 1239 | $1,595 | $1.29 | 21d | 1 | 0.81mi |
| 5237 SW 20th Ter Topeka, KS | 2.0 | 2.0 | 1050 | $1,205 | $1.15 | 21d | 1 | 1.29mi |
Listing history 4 events
-
2026-06-09status $150,000 Pending 3 DOM
-
2026-06-08days on market $150,000 Active 3 DOM
-
2026-06-07remarks 211-char remark
-
2026-06-07$150,000 Active 2 DOM
ⓘ Source: listings_history table (triggers on properties + properties_extension) + one-shot
backfill from property_details.listing_events for pre-trigger history.
Tax reassessment forecast KS · Resets to sale price
- Current annual tax
- $2,825 · $235/mo
- Projected year-2 tax
- $2,825 · $235/mo
- Expected delta
- $0/yr ($0/mo · 0.0%)
ⓘ Screening estimate from a state-policy table — verify with the county assessor before closing.
Climate risk First Street
- Flood 1/10 Low FEMA zone X (unshaded) · 0% chance over 30 yrs
- Wildfire 4/10 Moderate
- Heat 5/10 Major 7 d/yr ≥107°F today · 17 d/yr by 30 yrs out
- Wind 2/10 Low
- Air quality 3/10 Moderate 3 unhealthy d/yr today · 4 by 30 yrs out
Nearby sold comps map
Loading sold comps map…
Walkable amenities ~0.75 mi
Loading nearby amenities…
Taxation est. · year 1
- Rental income
- $18,033
- − Mortgage interest
- −$8,402
- − Property taxes
- −$2,825
- − Insurance
- −$750
- − Repairs & maintenance
- −$1,443
- − Management
- −$1,443
- − Depreciation
- −$4,364
- Taxable loss
- −$1,193
- Est. tax savings @ 24.0%
- +$286
- After-tax cash flow
- $1,518/yr
For passive investors: Depreciation is non-cash, so a rental often shows a tax loss while cash-flowing — sheltering income. Rental losses are passive: they offset passive income freely, and up to $25,000/yr can offset ordinary (W-2) income if you actively participate and your MAGI is under $100k (phasing out to $0 by $150k); unused losses carry forward. On sale, claimed depreciation is recaptured at up to 25%, and gains may owe capital-gains tax (a 1031 exchange can defer both). Figures are a year-1 estimate at your 24.0% rate — not tax advice; consult a CPA.
Schools (NCES district)
- District
- Topeka Public Schools
- NCES district ID
- 2012260
- Math proficiency
- 17% ▼ -8.00%
- Reading proficiency
- 23% ▼ -2.00%
- Median HH income
- $37,405
- Composite
- 16.69/100
- National rank
- #9167
- State rank
- #158 of 169 in KS
Livability — Topeka
- Score
- 69/100
- State rank
- #195
- US rank
- #8848
Category grades
Schools grade is shown separately in the Schools card above.
Census & demographics
- Census place
- Topeka, KS
- County
- Shawnee County · 118,130 people
- City population
- 118,130
- Metro
- Topeka, KS
- Population (ZIP)
- 32,538
- Household income
- $71,377
- Rent vs Own
- Severe rent burden
- 852.0
Population outlook (Shawnee County) Hauer SSP2
- Today (2025)
- 179,277 people
- By 2030
- 177,762 · -0.8%
- By 2040
- 172,341 · -3.9%
- By 2050
- 166,330 · -7.2%
- By 2075
- 152,417 · -15.0%
- By 2100
- 134,782 · -24.8%
Race, ethnicity, and origin ACS 2023
- Neighborhood character
- Predominantly White (79%)
- Race & ethnicity
- White 79% Hispanic / Latino 9% Two or more races 7% Black 4% Asian 3%
- Hispanic origin (detail)
- Mexican 8%
- Common ancestry
- Italian 3% Slovak 2% Romanian 2%
- Foreign-born
- 5% · Canada, China
- Languages at home
- 94% English-only · Spanish 3% Other Asian/Pacific 1% Other Indo-European 1%
Political lean MEDSL · Shawnee
- 2024 margin
- Toss-up / Even · D 49.3% · R 48.8% · Other 2.0%
- 2008→2024 swing
- +0.8pp no change · 2008: -0.3pp · 2024: 0.5pp
- All cycles
- 2024: D+0.5 2020: D+3.0 2016: R+2.8 2012: R+1.7 2008: R+0.3
Not yet ingested
- Civics
- —
Market trends
- HPI YoY
- ▼ -160.56%
- Current HPI
- 225.5592
- Rent YoY
- ▲ 9.88%
- Metro
- Topeka, KS
- State GDP YoY
- —
- F500 in state
- 0
Price history
+122.2% since first listed3 events — show timeline
- 2026-06-05 Listed $150,000 Sunflower MLS as distributed by MLS GRID
- 2000-07-14 Sold (Public Records) — Public Records
- 1996-11-01 Sold (Public Records) $67,500 Public Records
Property tax history
+3.9%/yrLatest (2025): $2,825 · +10.3% YoY. Source: county tax records.
Cash-flow waterfall
monthlySold comps — $/sqft
last 12 mo · ≤1 miLoading sold comps…