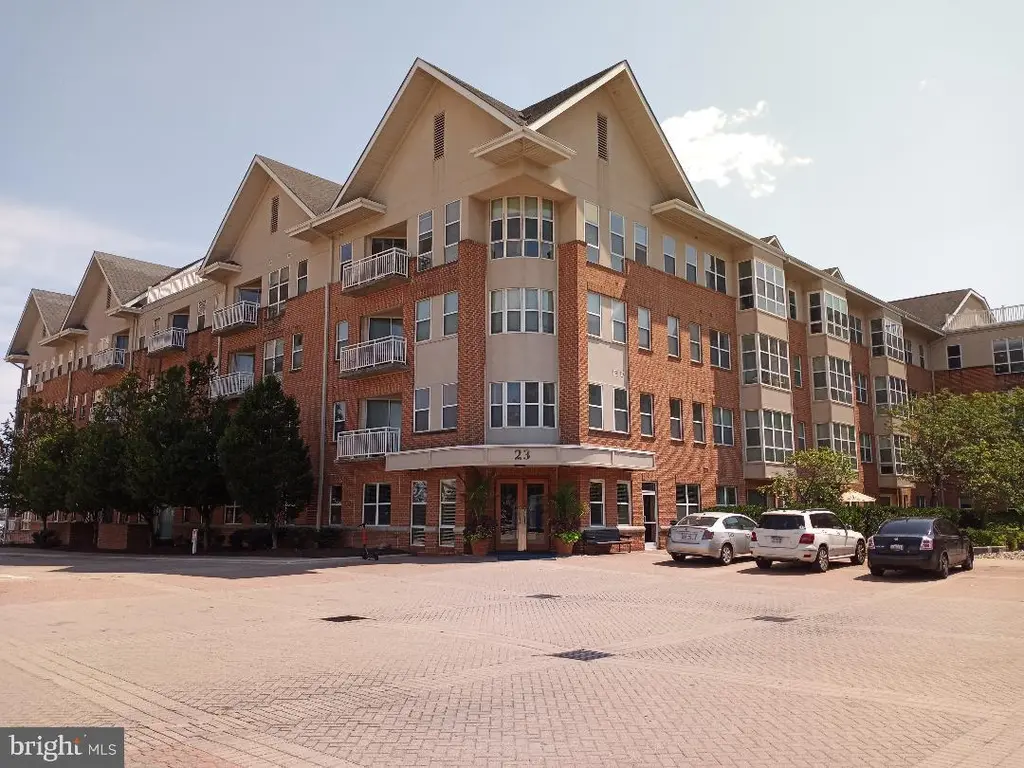
23 Pierside Dr #203 · Baltimore, MD
Flood risk No data
- FEMA flood zone
- —
- Chance of flooding over 30 yrs
- —
- Est. flood insurance / yr
- —
Fire risk No data
- Est. fire insurance / yr
- —
Heat risk No data
- Hot days now (above threshold)
- —
- Hot days in 30 yrs
- —
Wind risk No data
- Chance of severe wind over 30 yrs
- —
Air-quality risk No data
- Unhealthy air days now
- —
- Unhealthy air days in 30 yrs
- —
Risk factors via First Street. Map © Google.
Why this score? — see what drove the D grade
The composite is a weighted blend of 9 inputs, each scored 0–100. Each bar is that input's sub-score; the figure is the points it added to the 100-point composite (weight × sub-score).
- 1% rule +9.9/10.0
- Cash flow +8.7/30.0
- ARV discount +7.5/15.0
- Schools +5.0/10.0
- Livability +3.8/5.0
- Condition / age +2.5/5.0
- DSCR +2.4/10.0
- Rent growth +2.2/5.0
- Appreciation +0.0/10.0
$130,000
🖨 Deal sheet (PDF) 📄 Offer letter ✓ Due diligence
Listing remarks
Beautiful One Bedroom Condo with numerous updates and amenities including Restaurant, Scenic Walk/Bike Paths, Pool, Conference Room, 24 hr Concierge Service, and GYM. .3-4 Minute Drive to 95. Walk to Museums, Farmers Market, Entertainment, Federal Hill, McHenry Row, Harris Teeters, shopping and wide selections of Fine and casual restaurants and Salons. Walk promenade to Water-Taxi, Inner Harbor, Fells Point and Canton along well Lighted Waterfront!
Key facts
- $612 HOA
- Garage
- Community pool
Property features AI
Finance
- Financial info: Monthly association fee: $283.58; Additional HOA fee listed: $329 monthly; Other monthly fees: $357
- HOA & community: Monthly condo/coop fee (professional on-site management); HOA/Condo fee includes ground care, common area maintenance, custodial services, exterior building maintenance, health club, lawn care, management and related services; Community amenities include bar/lounge, common grounds, concierge, dog park, elevator, exercise/fitness room, jogging/walking path, marina/marina club, meeting room, pier/dock, outdoor pool
Exterior
- Parking: Underground parking garage with one assigned space; Reserved/assigned parking available
- Utilities: Public water; Public sewer; Electric service available; Cable TV available; Municipal trash service
- Home design: Condominium unit (unit/flat); Mid-rise building (5–8 floors); Entry on level 2; Brick construction; Property in excellent condition; Pets allowed (dogs and cats)
- Construction: Brick construction; Building not winterized
- Exterior features: Community pool; Water access to the bay; Water-oriented property; Navigable water
Interior
- Bedrooms: One bedroom on the main level
- Bathrooms: One full bathroom on the main level; One full bathroom
- Heating & cooling: Central heating (electric); Central air conditioning (electric); Hot water: other
- Interior features: Two or more access exits; No basement; Living area per assessor
- Laundry & utility: Washer/dryer hookup in unit
Neighborhood map
What this means for you Summary
Snapshot
- This is a 1-bed/1.0-bath condo listed at $130k.
Deal economics
- At list price, monthly cash flow is $-110 ($-1k/yr) — negative.
- To cash-flow at today's rent, offer at most $111k (15.0% below list).
- Meets the 1% rule at list price ($2k rent vs $130k).
- Recommended offer: $111k (15.0% below list) — sets the bar for cash-flow.
Location & tenants
- Location reads 76/100 on livability (#90 in MD, #3,396 nationally) — a middle-class / working-renter tenant base. Strengths: amenities A+, commute A+, housing A+; Watch: crime F.
- Zoned schools: Elmer A. Henderson: A Johns Hopkins Partnership (math 2% / reading 16%, grade F, #650 of 860 statewide, top 77%, 642 students, 80% FRL); Baltimore Polytechnic Institute (math 71% / reading 84%, grade A-, #22 of 222 statewide, top 10%, 1,555 students, 43% FRL).
- Market conditions: Rents soft (-1.0%/yr); 363 active listings in the ZIP; 40 comparable units currently listed for rent nearby; rentals leasing fast (median 5d on market — plan ~1-2 weeks tenant-placement turnaround); solid renter incomes; 1,273 units permitted in Baltimore city in 2024 (1,104 in 5+ unit buildings).
Forward outlook
- Local home prices are declining (-3.0%/yr); year-one equity from $899 of loan paydown is wiped out by about $4k of value loss. Plan a longer hold.
- Baltimore County population projected to shrink 4% by 2050 — rents likely to lag national; underwrite the cash flow, not the appreciation.
Negotiation context
- It's been on market 17 days — a 2% lower offer ($128k) is reasonable based on typical stale-listing flexibility.
- 20 sale attempts since 20y ago; this cycle's ask has dropped $10k (7%) from the opening price — seller is motivated, your offer sets the floor, not the list.
Risks & watch-outs
- Watch-outs: property tax is 2.7% of price; HOA is 32% of rent.
Questions for the listing agent
- What do current leases actually rent for vs. the listed asking? Can we see a recent rent roll and the last 12 months of T-12 income?
- Property tax is high relative to price — has the assessment been appealed recently, and will the sale trigger a re-assessment?
- What does the HOA fee cover, when was the last increase, and are there any pending special assessments or reserve-fund shortfalls?
- Any open or pending special assessments — roof, HVAC, plumbing, elevator, façade? What's the per-unit balance and payoff schedule, and is the seller paying it off at close or rolling it to the buyer?
- Is there a deadline driving the sale (1031 exchange, divorce, estate, relocation)? That informs how much negotiation room exists.
- Schools are D-rated, which usually means shorter tenancies and higher turnover. Who's the typical renter profile here, and what's been the actual vacancy rate?
- Crime grade is F in this area — have there been break-ins, vandalism, or insurance claims at this property in the last 3 years? What carrier currently insures it and at what premium?
- The area grade is low — what's the realistic commute time and amenity access for the typical tenant pool here? Any planned neighborhood developments (good or bad) we should know about?
- What's the average days-on-market for RENTAL listings here right now (not sales)? A rising rental-DOM trend means longer vacancies and softer asking-rent achievability than the comps imply.
- What's the recent tenant-quality profile in this submarket — average credit score on applications, eviction rate, late-payment / NSF rate, and stable-employment percentage? A property-management company in the area should have these aggregated.
- How much new apartment / multifamily construction is in the pipeline within 1–3 miles? Heavy new supply (>2% of stock underway) typically softens rents 12–24 months out; light construction supports rent growth.
Investment metrics
- 1% rule
- 1.49% ✓
- Cap rate
- 5.28%
- Cash-on-cash
- -3.63%
- DSCR
- 0.84
- GRM
- 5.6
CMA / ARV
No comps found within radius.
Projected returns pro-forma
-3.0% appreciation · 0.0% rent growth · sell at horizon
- IRR
- -28.7%
- Equity multiple
- 0.09×
- Total profit
- $-33,273
- Equity at exit
- $19,383
- IRR
- -74.1%
- Equity multiple
- -0.59×
- Total profit
- $-57,992
- Equity at exit
- $11,240
Cash invested: $36,400 (down + closing). Projections, not guarantees.
Landlord ↔ Tenant lean methodology
- Overall (CITY)
- 12 Strongly Tenant-Friendly
- State Maryland
- 27 Tenant-Leaning · D+14
- County
- — inherits STATE
- City Baltimore
- 12 Strongly Tenant-Friendly · D+58
ZIP-level market 21230
- Rents YoY
- -1.0%
- Active inventory
- 363
- Price-to-rent
- 5.6×
Monthly cashflow live
- Estimated rent
- $1,940 high interval (Pro) →
- Mortgage (P&I)
- −$682
- Tax from tax record
- −$295 /mo · $3,534/yr
- Insurance
- −$54
- HOA
- −$612
- Vacancy / Maint / Mgmt
- −$407
- Net cashflow
- $-110
Break-even live
Sensitivity live
| Price | -10% $-36 | -5% $-73 | +0% $-110 | +5% $-147 | +10% $-184 |
|---|---|---|---|---|---|
| Rent | -10% $-263 | -5% $-187 | +0% $-110 | +5% $-33 | +10% $43 |
| Rate | -1.0pp $-45 | -0.5pp $-77 | base $-110 | +0.5pp $-144 | +1.0pp $-178 |
UW: 25.0% down · 7.5% · 30yr · 1.5% tax · 5.0% vac · 8.0% maint · 8.0% mgmt
Financing live
Cash to close
- Down payment
- $32,500
- Closing costs
- $3,900
- Reserves months
- —
- Total cash needed
- —
Loan-product check · same deal, 3 products live
Conventional
25% down · 7.5% · 30yr
- Down + closing
- —
- Monthly P&I
- —
- Monthly cashflow
- —
- DSCR
- —
- Eligible?
- —
Personal DTI + credit; lowest rate.
DSCR
20% down · 8.5% · 30yr
- Down + closing
- —
- Monthly P&I
- —
- Monthly cashflow
- —
- DSCR
- —
- Eligible?
- —
No personal income docs; deal must DSCR.
Hard money
10% down · 12.0% · 12mo
- Down + closing
- —
- Monthly P&I
- —
- Monthly cashflow
- —
- DSCR
- —
- Eligible?
- —
Short-term bridge; refi at stabilization.
Rent comps 40 comps
| Address | Beds | Baths | Sqft | Rent | $/sqft | DOM | Units | Dist |
|---|---|---|---|---|---|---|---|---|
| 23 Pierside Dr Baltimore, MD | 1.0–2.0 | 1.0–2.0 | 975 | $1,800 | $1.85 | 46d | 1 | 0.03mi |
| 1110 Key Hwy Baltimore, MD | 1.0–2.0 | 1.0–2.5 | 1197 | $1,956 | $1.63 | 0d | 30 | 0.09mi |
| 1265 Riverside Ave Unit 1st Floor Baltimore, MD | 1.0 | 1.0 | 700 | $1,350 | $1.93 | 25d | 1 | 0.25mi |
| 1111 Light St Baltimore, MD | 2.0 | 1.0–2.0 | 982 | $2,154 | $2.19 | 0d | 12 | 0.33mi |
| 900 E Fort Ave Baltimore, MD | 2.0 | 1.0–2.5 | 936 | $2,789 | $2.98 | 0d | 19 | 0.44mi |
| 707 President St Baltimore, MD | 1.0 | 1.0–1.5 | 740 | $2,534 | $3.42 | 0d | 15 | 0.45mi |
| 1305 Dock St Baltimore, MD | — | 1.0 | 405 | $1,866 | $4.61 | 13d | 1 | 0.45mi |
| 1405 Point St Baltimore, MD | — | 1.0 | 368 | $1,959 | $5.32 | 0d | 1 | 0.47mi |
| 1001 Aliceanna St Baltimore, MD | 1.0 | 1.0 | 626 | $2,320 | $3.71 | 0d | 2 | 0.50mi |
| 7 W Cross St Baltimore, MD | — | 1.0 | 330 | $1,370 | $4.14 | 0d | 17 | 0.53mi |
| 1 E Montgomery St Baltimore, MD | — | 1.0 | 585 | $1,750 | $2.99 | 25d | 1 | 0.54mi |
| 1 E Montgomery St Baltimore, MD | — | 1.0 | 535 | $1,950 | $3.64 | 45d | 1 | 0.54mi |
| 910 S Charles St Unit B Baltimore, MD | 2.0 | 1.0 | 700 | $1,650 | $2.36 | 0d | 1 | 0.54mi |
| 1 E Montgomery St Unit 6 Baltimore, MD | — | 1.0 | 425 | $1,750 | $4.12 | 45d | 1 | 0.54mi |
| 1 E Montgomery St Unit 7 Baltimore, MD | 1.0 | 1.0 | 535 | $1,950 | $3.64 | 45d | 1 | 0.54mi |
| 1 E Montgomery St Unit 4 Baltimore, MD | 1.0 | 1.0 | 445 | $1,750 | $3.93 | 45d | 1 | 0.54mi |
| 1301 Aliceanna St Baltimore, MD | 1.0 | 1.0 | 669 | $3,755 | $5.61 | 0d | 2 | 0.55mi |
| 555 President St Baltimore, MD | 3.0 | 1.0–4.0 | 1352 | $3,209 | $2.37 | 0d | 1 | 0.57mi |
| 1702 Light St Unit 302 Baltimore, MD | 2.0 | 2.0 | 735 | $2,300 | $3.13 | 19d | 1 | 0.58mi |
| 611 S Charles St Baltimore, MD | 2.0 | 1.0–2.0 | 823 | $2,498 | $3.03 | 0d | 7 | 0.59mi |
| 1312 S Hanover St Apt 3 Baltimore, MD | 2.0 | 1.0 | 750 | $2,200 | $2.93 | 45d | 1 | 0.60mi |
| 101 W Cross St Baltimore, MD | 2.0 | 1.0–2.0 | 937 | $2,566 | $2.74 | 0d | 25 | 0.64mi |
| 1625 Olive St Baltimore, MD | 2.0 | 2.0 | 672 | $2,500 | $3.72 | 45d | 1 | 0.66mi |
| 1700 S Charles St Baltimore, MD | 1.0 | 1.0 | 600 | $1,300 | $2.17 | 45d | 1 | 0.67mi |
| 103 E Wells St Baltimore, MD | 1.0–2.0 | 1.0 | 1008 | $1,530 | $1.52 | 4d | 11 | 0.67mi |
| 520 S Caroline St Unit 301 Baltimore, MD | 1.0 | 1.0 | 625 | $2,100 | $3.36 | 6d | 1 | 0.68mi |
| 1705 Olive St Baltimore, MD | 2.0 | 2.0 | 648 | $2,500 | $3.86 | 22d | 1 | 0.69mi |
| 714 S Broadway Baltimore, MD | — | 1.0 | 500 | $1,550 | $3.10 | 23d | 1 | 0.74mi |
| 103 S Gay St Baltimore, MD | 1.0 | 1.0 | 695 | $1,420 | $2.04 | 0d | 6 | 0.76mi |
| 622 S Broadway Baltimore, MD | 2.0 | 1.0–2.0 | 953 | $2,282 | $2.39 | 0d | 12 | 0.77mi |
| 111 W Heath St Baltimore, MD | 2.0 | 1.0–2.5 | 1263 | $2,230 | $1.76 | 4d | 7 | 0.77mi |
| 1800 S Hanover St Baltimore, MD | 1.0–3.0 | 1.0–2.0 | 1052 | $1,951 | $1.85 | 0d | 22 | 0.78mi |
| 1900 S Hanover St Baltimore, MD | 3.0 | 1.0–2.0 | 875 | $2,309 | $2.64 | 0d | 76 | 0.81mi |
| 601 S Broadway Unit 305 Baltimore, MD | 1.0 | 1.0 | 592 | $1,600 | $2.70 | 6d | 1 | 0.82mi |
| 601 S Broadway Unit 305 Baltimore, MD | 1.0 | 1.0 | 592 | $1,600 | $2.70 | 45d | 1 | 0.82mi |
| 414 Water St Baltimore, MD | 1.0–3.0 | 1.0–2.5 | 751 | $1,700 | $2.26 | 4d | 7 | 0.85mi |
| 414 Water St Baltimore, MD | 1.0–3.0 | 1.0–2.5 | 751 | $1,800 | $2.40 | 4d | 6 | 0.85mi |
| 210 S Caroline St Baltimore, MD | 1.0–2.0 | 1.0 | 808 | $1,604 | $1.99 | 45d | 23 | 0.87mi |
| 250 Mission Blvd Baltimore, MD | 2.0 | 1.0–2.0 | 790 | $2,654 | $3.36 | 3d | 21 | 0.88mi |
| 26 S Calvert St Baltimore, MD | 1.0–2.0 | 1.0–2.0 | 669 | $1,160 | $1.73 | 0d | 10 | 0.89mi |
HOA detail condo
- Monthly dues
- $612 · $7,344/yr
- Likely covers
- waterpoolgymdoorman
- Assessments
- None detected in remarks — confirm with the listing agent.
Listing history 10 events
-
2026-06-21days on market $130,000 Active 17 DOM
-
2026-06-18days on market $130,000 Active 14 DOM
-
2026-06-17days on market $130,000 Active 13 DOM
-
2026-06-16days on market $130,000 Active 12 DOM
-
2026-06-15days on market $130,000 Active 11 DOM
-
2026-06-13days on market $130,000 Active 9 DOM
-
2026-06-09days on market $130,000 Active 5 DOM
-
2026-06-08days on market $130,000 Active 4 DOM
-
2026-06-07remarks 455-char remark
-
2026-06-07$130,000 Active 3 DOM
ⓘ Source: listings_history table (triggers on properties + properties_extension) + one-shot
backfill from property_details.listing_events for pre-trigger history.
Tax reassessment forecast MD · Partial reset (capped growth)
- Current annual tax
- $3,534 · $295/mo
- Projected year-2 tax
- $3,534 · $295/mo
- Expected delta
- $0/yr ($0/mo · 0.0%)
ⓘ Screening estimate from a state-policy table — verify with the county assessor before closing.
Nearby sold comps map
Loading sold comps map…
Walkable amenities ~0.75 mi
Loading nearby amenities…
Taxation est. · year 1
- Rental income
- $23,276
- − Mortgage interest
- −$7,282
- − Property taxes
- −$3,534
- − Insurance
- −$650
- − Repairs & maintenance
- −$1,862
- − Management
- −$1,862
- − HOA
- −$7,344
- − Depreciation
- −$3,782
- Taxable loss
- −$3,040
- Est. tax savings @ 24.0%
- +$730
- After-tax cash flow
- $-591/yr
For passive investors: Depreciation is non-cash, so a rental often shows a tax loss while cash-flowing — sheltering income. Rental losses are passive: they offset passive income freely, and up to $25,000/yr can offset ordinary (W-2) income if you actively participate and your MAGI is under $100k (phasing out to $0 by $150k); unused losses carry forward. On sale, claimed depreciation is recaptured at up to 25%, and gains may owe capital-gains tax (a 1031 exchange can defer both). Figures are a year-1 estimate at your 24.0% rate — not tax advice; consult a CPA.
Schools (NCES district)
No district data.
Livability — Baltimore
- Score
- 76/100
- State rank
- #90
- US rank
- #3396
Category grades
Schools grade is shown separately in the Schools card above.
Census & demographics
- Census place
- Baltimore, MD
- County
- Baltimore City · 558,601 people
- City population
- 588,727
- Metro
- Baltimore-Columbia-Towson, MD
- Population (ZIP)
- 32,977
- Household income
- $91,842
- Rent vs Own
- Severe rent burden
- 1463.0
Population outlook (Baltimore County) Hauer SSP2
- Today (2025)
- 624,249 people
- By 2030
- 621,541 · -0.4%
- By 2040
- 609,756 · -2.3%
- By 2050
- 597,249 · -4.3%
- By 2075
- 552,236 · -11.5%
- By 2100
- 513,934 · -17.7%
Race, ethnicity, and origin ACS 2023
- Neighborhood character
- Diverse neighborhood (Simpson 0.63)
- Race & ethnicity
- White 55% Black 23% Hispanic / Latino 13% Two or more races 6% Asian 4%
- Hispanic origin (detail)
- Mexican 1% Puerto Rican 1%
- Common ancestry
- Romanian 5% Lithuanian 2% Italian 2%
- Foreign-born
- 10% · Canada, China
- Languages at home
- 85% English-only · Spanish 9% Other Indo-European 1% Other Asian/Pacific 1%
Political lean MEDSL · Baltimore
- 2024 margin
- Solid D (+73.0) · D 85.2% · R 12.2% · Other 2.6%
- 2008→2024 swing
- -2.5pp toward R · 2008: 75.5pp · 2024: 73.0pp
- All cycles
- 2024: D+73.0 2020: D+76.6 2016: D+74.6 2012: D+76.4 2008: D+75.5
Not yet ingested
- Civics
- —
Market trends
- HPI YoY
- ▼ -311.43%
- Current HPI
- 284.338
- Rent YoY
- ▼ -1.00%
- Metro
- Baltimore-Columbia-Towson, MD
- State GDP YoY
- ▲ 2.97%
- F500 in state
- 12
Industry mix (Fortune 500 HQ in MD)
| Industry | F500 HQs | Revenue |
|---|---|---|
| Aerospace / Defense | 1 | $71B |
|
||
| Utilities | 1 | $25B |
|
||
| Hotels | 1 | $24B |
|
||
| Consumer Goods | 1 | $7B |
|
||
| Real Estate | 1 | $6B |
|
||
| Chemicals | 1 | $2B |
|
||
Price history
-43.5% since first listed71 events — show timeline
- 2026-06-05 Price Changed $130,000 BRIGHT MLS
- 2026-06-04 Listed $140,000 BRIGHT MLS
- 2025-11-30 Listing Removed — BRIGHT MLS
- 2025-05-31 Listing Removed — BRIGHT MLS
- 2025-05-17 Price Changed $159,000 BRIGHT MLS
- 2025-05-15 Listed $169,900 BRIGHT MLS
- 2025-03-27 Price Changed $350,000 BRIGHT MLS
- 2025-03-14 Listed $365,000 BRIGHT MLS
- 2024-05-31 Listing Removed — BRIGHT MLS
- 2023-12-18 Rental Removed $1,600 BRIGHTMLS
- 2023-12-13 Price Changed $169,900 BRIGHT MLS
- 2023-11-10 Price Changed $179,000 BRIGHT MLS
- 2023-11-07 Price Changed $1,600 BRIGHTMLS
- 2023-11-07 Price Changed $184,900 BRIGHT MLS
- 2023-10-01 Listing Removed — BRIGHT MLS
- 2023-10-01 Listing Removed — BRIGHT MLS
- 2023-09-29 Listed $186,900 BRIGHT MLS
- 2023-09-26 Listed for Rent $1,750 BRIGHTMLS
- 2023-07-26 Listed $750,000 BRIGHT MLS
- 2023-07-01 Listed $395,000 BRIGHT MLS
- 2023-06-29 Coming Soon — BRIGHT MLS
- 2013-08-29 Sold (Public Records) $145,000 Public Records
- 2013-08-06 Delisted — MRIS
- 2013-08-05 Sold (MLS) $145,000 BRIGHT MLS
- 2013-08-05 Sold (MLS) $145,000 MRIS
- 2013-07-13 Pending — MRIS
- 2013-07-11 Listing Removed — BRIGHT MLS
- 2013-04-10 Listed $149,000 MRIS
- 2013-04-10 Listed $149,000 BRIGHT MLS
- 2011-03-28 Sold (MLS) $109,900 BRIGHT MLS
- 2011-03-28 Sold (MLS) $109,900 MRIS
- 2011-02-11 Pending — MRIS
- 2011-02-11 Listing Removed — BRIGHT MLS
- 2011-01-30 Price Changed $109,900 MRIS
- 2011-01-06 Listed $119,900 MRIS
- 2011-01-06 Listed $109,900 BRIGHT MLS
- 2010-12-16 Listing Removed — BRIGHT MLS
- 2010-12-07 Price Changed — MRIS
- 2010-11-29 Price Changed — MRIS
- 2010-11-23 Delisted — MRIS
- 2010-10-27 Price Changed — MRIS
- 2010-09-22 Price Changed — MRIS
- 2010-07-27 Price Changed — MRIS
- 2010-06-30 Price Changed — MRIS
- 2010-04-07 Price Changed — MRIS
- 2010-03-23 Listed — MRIS
- 2010-03-23 Listed $119,900 BRIGHT MLS
- 2009-01-07 Delisted — MRIS
- 2009-01-06 Relisted — MRIS
- 2009-01-02 Delisted — MRIS
- 2008-10-16 Listed — MRIS
- 2008-10-07 Delisted — MRIS
- 2008-09-03 Listed — MRIS
- 2008-04-21 Delisted — MRIS
- 2008-03-17 Price Changed — MRIS
- 2008-01-24 Price Changed — MRIS
- 2008-01-22 Price Changed — MRIS
- 2008-01-17 Price Changed — MRIS
- 2008-01-11 Price Changed — MRIS
- 2008-01-09 Price Changed — MRIS
- 2007-12-09 Price Changed — MRIS
- 2007-11-13 Price Changed — MRIS
- 2007-10-31 Listed — MRIS
- 2007-09-01 Delisted — MRIS
- 2007-06-23 Listed — MRIS
- 2007-05-21 Delisted — MRIS
- 2007-04-20 Listed — MRIS
- 2007-03-14 Sold (Public Records) $229,900 Public Records
- 2007-01-31 Sold (MLS) $229,900 MRIS
- 2006-12-22 Delisted — MRIS
- 2006-11-20 Listed $229,900 MRIS
Property tax history
-1.5%/yrLatest (2025): $3,534 · +5.7% YoY. Source: county tax records.
Cash-flow waterfall
monthlySold comps — $/sqft
last 12 mo · ≤1 miLoading sold comps…