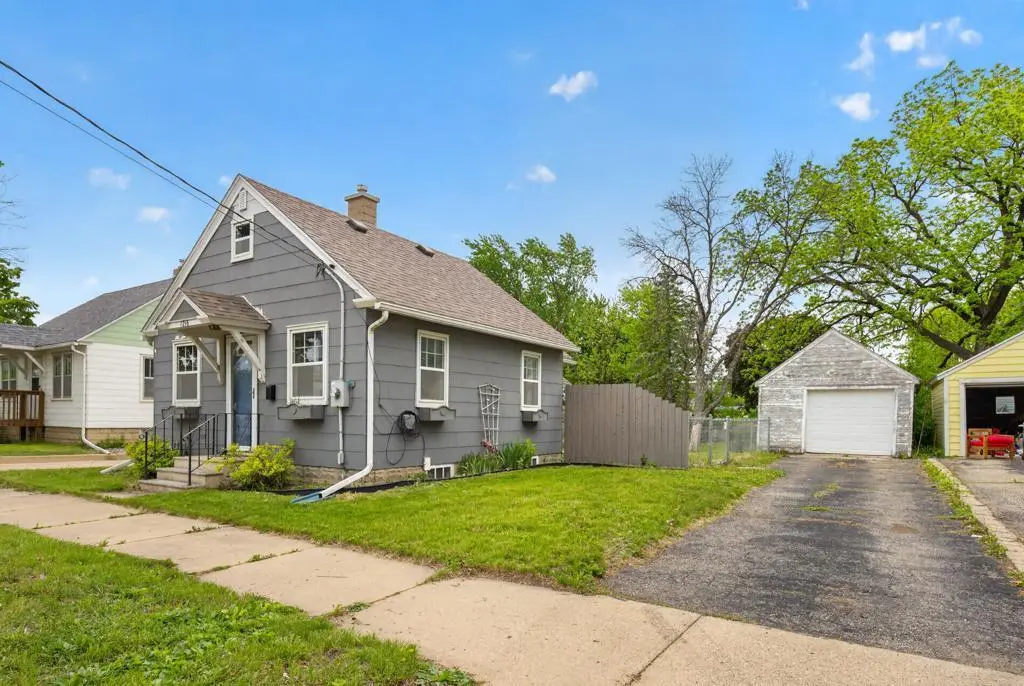
1216 9th Ave SE · Rochester, MN
Flood risk 3/10 · Minor
- FEMA flood zone
- X (unshaded)
- Chance of flooding over 30 yrs
- 0.2%
- Est. flood insurance / yr
- $473 – $860
Fire risk 1/10 · Minimal
- Est. fire insurance / yr
- $888 – $1,650
Heat risk 2/10 · Minimal
- Hot days now (above 98°F)
- 7 days/yr
- Hot days in 30 yrs
- 15 days/yr
Wind risk 2/10 · Minimal
- Chance of severe wind over 30 yrs
- —
Air-quality risk 2/10 · Minimal
- Unhealthy air days now
- 1 days/yr
- Unhealthy air days in 30 yrs
- 1 days/yr
Risk factors via First Street. Map © Google.
Why this score? — see what drove the D grade
The composite is a weighted blend of 9 inputs, each scored 0–100. Each bar is that input's sub-score; the figure is the points it added to the 100-point composite (weight × sub-score).
- Cash flow +13.0/30.0
- ARV discount +7.5/15.0
- Livability +4.6/5.0
- Schools +4.1/10.0
- DSCR +3.9/10.0
- 1% rule +3.1/10.0
- Rent growth +3.0/5.0
- Condition / age +2.5/5.0
- Appreciation +0.0/10.0
$145,000
🖨 Deal sheet (PDF) 📄 Offer letter ✓ Due diligence
Listing remarks MLS
Check out this adorable "tiny home" in SE Rochester! With tons of charm and a great location, this home is going to sell fast! This is a great opportunity for someone that wants a home they can put their personal touches on, without needing a large amount of work.This home would be a great investment opportunity with possibility of becoming a rental as well. Come see it today!
Key facts
- Newer shingles
- Large fenced yard
- Detached garage
Tags
Property features AI
Exterior
- Parking: Detached or on-site asphalt parking; 1-car garage (approx. 14 x 20)
- Utilities: City water; City sewer; Natural gas; Circuit breaker electric service; Power provided by Rochester Public Utilities
- Home design: Residential property; One story
- Construction: Block and frame construction; Block foundation; Roof replaced/installed within last 8 years; Basement: full, block construction with sump pump
- Exterior features: Patio; Chain link fencing; City street frontage; Publicly maintained road
Interior
- Kitchen: Range; Microwave; Refrigerator; Dishwasher
- Bedrooms: 1 bedroom
- Bathrooms: Main floor full bathroom
- Heating & cooling: Forced air heating; Window AC unit(s)
- Interior features: Informal dining area; Water softener (owned)
- Laundry & utility: Washer and Dryer (located in basement)
Neighborhood map
What this means for you Summary
Snapshot
- This is a 1-bed/1.0-bath single-family listed at $145k.
Deal economics
- At list price, monthly cash flow is $-7 ($-84/yr) — negative.
- To cash-flow at today's rent, offer at most $144k (0.9% below list).
- To meet the 1% rule (rent ≥ 1% of price), the offer needs to be $117k (19.4% below list).
- Recommended offer: $117k (19.4% below list) — sets the bar for 1% rule.
- Cap rate 6.2% vs local median 3.5% in Rochester — top-decile yield for the area; either an underpriced asset or a hidden risk that comps aren't pricing in. Stress-test before assuming the spread holds.
Location & tenants
- Location reads 92/100 on livability (#1 in MN, #27 nationally) — a professional / high-income tenant draw. Strengths: amenities A+, commute A+, employment A+.
- Rochester Public School District (urban): math 40% / reading 51% proficiency, ranked #152 of 301 in MN (top 50%) — families likely to look elsewhere, expect single-tenant / working-renter base with shorter leases.
- Zoned schools: Franklin Elementary (math 31% / reading 37%, grade F, #666 of 857 statewide, top 78%, 562 students, 67% FRL); Willow Creek Middle (math 19% / reading 36%, grade F, #213 of 258 statewide, top 82%, 890 students, 45% FRL); Mayo Senior High (math 42% / reading 65%, grade C-, #104 of 471 statewide, top 22%, 1,862 students, 31% FRL) — zoned schools average 48% FRL vs 31% district-wide (17 pts higher); higher-poverty schools than district average — tighter screening recommended.
- Market conditions: Rents rising (+2.1%/yr); 151 active listings in the ZIP; 17 comparable units currently listed for rent nearby; rentals at typical pace (median 15d on market — plan ~3-4 weeks tenant-placement turnaround); solid renter incomes; 1,267 units permitted in Olmsted County in 2024 (915 in 5+ unit buildings).
Forward outlook
- Local home prices are declining (-3.0%/yr); year-one equity from $1k of loan paydown is wiped out by about $4k of value loss. Plan a longer hold.
- Olmsted County population projected at +16% by 2050 — long-run rental-demand tailwind backs the buy-and-hold thesis.
Negotiation context
- It's been on market 15 days — a 2% lower offer ($143k) is reasonable based on typical stale-listing flexibility.
- 2 sale attempts since 7y ago with the ask held roughly flat each time — persistent listings suggest the price (not the market) is what's stuck; bring a comps-based counter.
- Current owner paid $90k; list at $145k implies a 61% gain — meaningful room to come down on a strong offer.
Risks & watch-outs
- Watch-outs: built in 1930 — expect roof / HVAC / electrical / plumbing capex.
Questions for the listing agent
- What do current leases actually rent for vs. the listed asking? Can we see a recent rent roll and the last 12 months of T-12 income?
- Built in 1930 — when were the roof, HVAC, electrical panel, plumbing, and water heater last replaced?
- Is there a deadline driving the sale (1031 exchange, divorce, estate, relocation)? That informs how much negotiation room exists.
- Schools are A-rated — typically a magnet for longer-tenancy family renters. What's the average tenant stay here, and is there a school-zone premium baked into asking?
- The area grade is low — what's the realistic commute time and amenity access for the typical tenant pool here? Any planned neighborhood developments (good or bad) we should know about?
- What's the average days-on-market for RENTAL listings here right now (not sales)? A rising rental-DOM trend means longer vacancies and softer asking-rent achievability than the comps imply.
- What's the recent tenant-quality profile in this submarket — average credit score on applications, eviction rate, late-payment / NSF rate, and stable-employment percentage? A property-management company in the area should have these aggregated.
- How much new for-sale + rental construction is in the pipeline within 1–3 miles? Heavy new supply typically softens prices + rents 12–24 months out; constrained supply supports both.
Investment metrics
- 1% rule
- 0.81% ✗
- Cap rate
- 6.23%
- Cash-on-cash
- -0.21%
- DSCR
- 0.99
- GRM
- 10.3
CMA / ARV
No comps found within radius.
Projected returns pro-forma
-3.0% appreciation · 2.1% rent growth · sell at horizon
- IRR
- -17.6%
- Equity multiple
- 0.38×
- Total profit
- $-25,018
- Equity at exit
- $21,620
- IRR
- -11.4%
- Equity multiple
- 0.34×
- Total profit
- $-26,694
- Equity at exit
- $12,537
Cash invested: $40,600 (down + closing). Projections, not guarantees.
Landlord ↔ Tenant lean methodology
- Overall (STATE)
- 46 Balanced
- State Minnesota
- 46 Balanced · D+2
- County
- — inherits STATE
- City
- — inherits STATE
ZIP-level market 55904
- Rents YoY
- 2.1%
- Active inventory
- 151
- Price-to-rent
- 10.3×
Monthly cashflow live
- Estimated rent
- $1,168 high interval (Pro) →
- Mortgage (P&I)
- −$760
- Tax from tax record
- −$109 /mo · $1,310/yr
- Insurance
- −$60
- HOA
- −$0
- Vacancy / Maint / Mgmt
- −$245
- Net cashflow
- $-7
Break-even live
Sensitivity live
| Price | -10% $75 | -5% $34 | +0% $-7 | +5% $-48 | +10% $-89 |
|---|---|---|---|---|---|
| Rent | -10% $-99 | -5% $-53 | +0% $-7 | +5% $39 | +10% $85 |
| Rate | -1.0pp $66 | -0.5pp $30 | base $-7 | +0.5pp $-45 | +1.0pp $-83 |
UW: 25.0% down · 7.5% · 30yr · 1.5% tax · 5.0% vac · 8.0% maint · 8.0% mgmt
Financing live
Cash to close
- Down payment
- $36,250
- Closing costs
- $4,350
- Reserves months
- —
- Total cash needed
- —
Loan-product check · same deal, 3 products live
Conventional
25% down · 7.5% · 30yr
- Down + closing
- —
- Monthly P&I
- —
- Monthly cashflow
- —
- DSCR
- —
- Eligible?
- —
Personal DTI + credit; lowest rate.
DSCR
20% down · 8.5% · 30yr
- Down + closing
- —
- Monthly P&I
- —
- Monthly cashflow
- —
- DSCR
- —
- Eligible?
- —
No personal income docs; deal must DSCR.
Hard money
10% down · 12.0% · 12mo
- Down + closing
- —
- Monthly P&I
- —
- Monthly cashflow
- —
- DSCR
- —
- Eligible?
- —
Short-term bridge; refi at stabilization.
Rent comps 17 comps
| Address | Beds | Baths | Sqft | Rent | $/sqft | DOM | Units | Dist |
|---|---|---|---|---|---|---|---|---|
| 1427 6th Ave SE Unit 4 Rochester, MN | 1.0 | 1.0 | 650 | $825 | $1.27 | 45d | 1 | 0.35mi |
| 504 14th St SE #6 Rochester, MN | 2.0 | 1.0 | 725 | $995 | $1.37 | 45d | 1 | 0.36mi |
| 1505 Marion Rd SE Rochester, MN | 1.0–3.0 | 1.0–2.0 | 864 | $1,225 | $1.42 | 15d | 1 | 0.79mi |
| 705 1st Ave SW Rochester, MN | 3.0 | 1.0–2.5 | 1135 | $2,422 | $2.13 | 15d | 91 | 0.91mi |
| 223 8th Ave SE Unit 2 Rochester, MN | 1.0 | 1.0 | 600 | $975 | $1.62 | 45d | 1 | 0.97mi |
| 28 6th Ave SE Unit 3 Rochester, MN | 1.0 | 1.0 | 650 | $1,050 | $1.62 | 22d | 1 | 1.09mi |
| 511 3rd Ave SW Rochester, MN | 2.0 | 1.0 | 647 | $1,520 | $2.35 | 15d | 26 | 1.11mi |
| 418 6th St SW Unit A418-924 Rochester, MN | 1.0 | 1.0 | 500 | $1,200 | $2.40 | 22d | 1 | 1.13mi |
| 418 6th St SW Unit A418-936 Rochester, MN | 1.0 | 1.0 | 500 | $1,150 | $2.30 | 45d | 1 | 1.13mi |
| 418 6th St SW Unit A418-929 Rochester, MN | 1.0 | 1.0 | 400 | $1,100 | $2.75 | 22d | 1 | 1.13mi |
| 504 E Center St Unit 2 Rochester, MN | 1.0 | 1.0 | 675 | $800 | $1.19 | 45d | 1 | 1.15mi |
| 449 E Center St Rochester, MN | 1.0–3.0 | 1.0–2.0 | 1165 | $1,545 | $1.33 | 15d | 40 | 1.20mi |
| 1513 2nd St NE Rochester, MN | 1.0 | 1.0 | 496 | $1,150 | $2.32 | 15d | 1 | 1.37mi |
| 718 5th St SW Rochester, MN | 2.0 | 1.0 | 722 | $1,150 | $1.59 | 15d | 4 | 1.37mi |
| 625 3rd St SW Rochester, MN | 1.0–2.0 | 1.0 | 612 | $1,170 | $1.91 | 15d | 3 | 1.45mi |
| 620 2nd St SW Rochester, MN | 1.0 | 1.0 | 406 | $995 | $2.45 | 15d | 11 | 1.45mi |
| 603 1st St SW Rochester, MN | 2.0 | 1.0 | 512 | $1,120 | $2.19 | 15d | 3 | 1.49mi |
Listing history 19 events
-
2026-06-07statusdays on market $145,000 Pending 15 DOM
-
2026-06-05days on market $145,000 Contingent - Inspection 13 DOM
-
2026-06-03days on market $145,000 Contingent - Inspection 12 DOM
-
2026-06-02days on market $145,000 Contingent - Inspection 11 DOM
-
2026-06-01days on market $145,000 Contingent - Inspection 10 DOM
-
2026-05-31days on market $145,000 Contingent - Inspection 9 DOM
-
2026-05-30days on market $145,000 Contingent - Inspection 8 DOM
-
2026-05-22$145,000 Active
-
2019-11-14soldstatus $89,900
-
2019-11-08soldstatus $89,900 Sold 390-char remark
Show marketing remark (390 chars)
Check out this adorable "tiny home" in SE Rochester! With tons of charm and a great location, this home is going to sell fast! This is a great opportunity for someone that wants a home they can put their personal touches on, without needing a large amount of work.This home would be a great investment opportunity with possibility of becoming a rental as well. Come see it today!
-
2019-10-14status Pending 390-char remark
Show marketing remark (390 chars)
Check out this adorable "tiny home" in SE Rochester! With tons of charm and a great location, this home is going to sell fast! This is a great opportunity for someone that wants a home they can put their personal touches on, without needing a large amount of work.This home would be a great investment opportunity with possibility of becoming a rental as well. Come see it today!
-
2019-10-08historical Contingent - Inspection 390-char remark
Show marketing remark (390 chars)
Check out this adorable "tiny home" in SE Rochester! With tons of charm and a great location, this home is going to sell fast! This is a great opportunity for someone that wants a home they can put their personal touches on, without needing a large amount of work.This home would be a great investment opportunity with possibility of becoming a rental as well. Come see it today!
-
2019-10-04$89,900 Active 390-char remark
Show marketing remark (390 chars)
Check out this adorable "tiny home" in SE Rochester! With tons of charm and a great location, this home is going to sell fast! This is a great opportunity for someone that wants a home they can put their personal touches on, without needing a large amount of work.This home would be a great investment opportunity with possibility of becoming a rental as well. Come see it today!
-
2019-10-01historical $89,900 390-char remark
Show marketing remark (390 chars)
Check out this adorable "tiny home" in SE Rochester! With tons of charm and a great location, this home is going to sell fast! This is a great opportunity for someone that wants a home they can put their personal touches on, without needing a large amount of work.This home would be a great investment opportunity with possibility of becoming a rental as well. Come see it today!
-
2004-06-07soldstatus $74,000
-
2004-05-27soldstatus $74,000
-
1996-04-01soldstatus $38,250
-
1991-04-01soldstatus $30,000
-
1989-10-01soldstatus $26,500
ⓘ Source: listings_history table (triggers on properties + properties_extension) + one-shot
backfill from property_details.listing_events for pre-trigger history.
Tax reassessment forecast MN · Partial reset (capped growth)
- Current annual tax
- $1,310 · $109/mo
- Projected year-2 tax
- $1,467 · $122/mo
- Expected delta
- +$157/yr (+$13/mo · 12.0%)
ⓘ Screening estimate from a state-policy table — verify with the county assessor before closing.
Climate risk First Street
- Flood 3/10 Moderate FEMA zone X (unshaded) · 20% chance over 30 yrs
- Wildfire 1/10 Low
- Heat 2/10 Low 7 d/yr ≥98°F today · 15 d/yr by 30 yrs out
- Wind 2/10 Low
- Air quality 2/10 Low 1 unhealthy d/yr today · 1 by 30 yrs out
Nearby sold comps map
Loading sold comps map…
Walkable amenities ~0.75 mi
Loading nearby amenities…
Taxation est. · year 1
- Rental income
- $14,020
- − Mortgage interest
- −$8,122
- − Property taxes
- −$1,310
- − Insurance
- −$725
- − Repairs & maintenance
- −$1,122
- − Management
- −$1,122
- − Depreciation
- −$4,218
- Taxable loss
- −$2,599
- Est. tax savings @ 24.0%
- +$624
- After-tax cash flow
- $540/yr
For passive investors: Depreciation is non-cash, so a rental often shows a tax loss while cash-flowing — sheltering income. Rental losses are passive: they offset passive income freely, and up to $25,000/yr can offset ordinary (W-2) income if you actively participate and your MAGI is under $100k (phasing out to $0 by $150k); unused losses carry forward. On sale, claimed depreciation is recaptured at up to 25%, and gains may owe capital-gains tax (a 1031 exchange can defer both). Figures are a year-1 estimate at your 24.0% rate — not tax advice; consult a CPA.
Schools (NCES district)
- District
- Rochester Public School District
- NCES district ID
- 2731800
- Math proficiency
- 40% ▼ -10.00%
- Reading proficiency
- 51% ▼ -4.00%
- Median HH income
- $66,540
- Composite
- 40.6/100
- National rank
- #3695
- State rank
- #152 of 301 in MN
Livability — Rochester
- Score
- 92/100
- State rank
- #1
- US rank
- #27
Category grades
Schools grade is shown separately in the Schools card above.
Census & demographics
- Census place
- Rochester, MN
- County
- Olmsted County · 135,035 people
- City population
- 135,035
- Metro
- Rochester, MN
- Population (ZIP)
- 29,639
- Household income
- $77,016
- Rent vs Own
- Severe rent burden
- 864.0
Population outlook (Olmsted County) Hauer SSP2
- Today (2025)
- 165,999 people
- By 2030
- 172,425 · +3.9%
- By 2040
- 183,785 · +10.7%
- By 2050
- 192,981 · +16.3%
- By 2075
- 215,284 · +29.7%
- By 2100
- 224,887 · +35.5%
Race, ethnicity, and origin ACS 2023
- Neighborhood character
- Predominantly White (74%)
- Race & ethnicity
- White 74% Black 10% Hispanic / Latino 8% Two or more races 5% Asian 3%
- Hispanic origin (detail)
- Mexican 6%
- Common ancestry
- Portuguese 11% Lithuanian 2% Italian 2%
- Foreign-born
- 11% · Canada, China, Vietnam
- Languages at home
- 84% English-only · Spanish 5% Other Asian/Pacific 3% Arabic 2%
Political lean MEDSL · Olmsted
- 2024 margin
- D (+10.7) · D 54.3% · R 43.6% · Other 2.1%
- 2008→2024 swing
- +7.4pp toward D · 2008: 3.3pp · 2024: 10.7pp
- All cycles
- 2024: D+10.7 2020: D+10.7 2016: D+0.8 2012: D+3.2 2008: D+3.3
Not yet ingested
- Civics
- —
Market trends
- HPI YoY
- ▼ -161.04%
- Current HPI
- 267.168
- Rent YoY
- ▲ 2.10%
- Metro
- Rochester, MN
- State GDP YoY
- ▲ 2.41%
- F500 in state
- 34
Industry mix (Fortune 500 HQ in MN)
| Industry | F500 HQs | Revenue |
|---|---|---|
| Healthcare | 2 | $407B |
|
||
| Retail | 2 | $150B |
|
||
| Consumer Goods | 2 | $32B |
|
||
| Industrial Machinery | 2 | $6B |
|
||
| Agriculture | 1 | $40B |
|
||
| Healthcare / Medical Devices | 1 | $32B |
|
||
Price history
+447.2% since first listed12 events — show timeline
- 2026-05-22 Listed $145,000 NORTHSTARMLS as Distributed by MLS Grid
- 2019-11-14 Sold (Public Records) $89,900 Public Records
- 2019-11-08 Sold (MLS) $89,900 NORTHSTARMLS as Distributed by MLS Grid
- 2019-10-14 Pending — NORTHSTARMLS as Distributed by MLS Grid
- 2019-10-08 Contingent — NORTHSTARMLS as Distributed by MLS Grid
- 2019-10-04 Listed $89,900 NORTHSTARMLS as Distributed by MLS Grid
- 2019-10-01 Coming Soon $89,900 NORTHSTARMLS as Distributed by MLS Grid
- 2004-06-07 Sold (Public Records) $74,000 Public Records
- 2004-05-27 Sold (Public Records) $74,000 Public Records
- 1996-04-01 Sold (Public Records) $38,250 Public Records
- 1991-04-01 Sold (Public Records) $30,000 Public Records
- 1989-10-01 Sold (Public Records) $26,500 Public Records
Property tax history
+8.1%/yrLatest (2025): $1,310 · +3.6% YoY. Source: county tax records.
Cash-flow waterfall
monthlySold comps — $/sqft
last 12 mo · ≤1 miLoading sold comps…