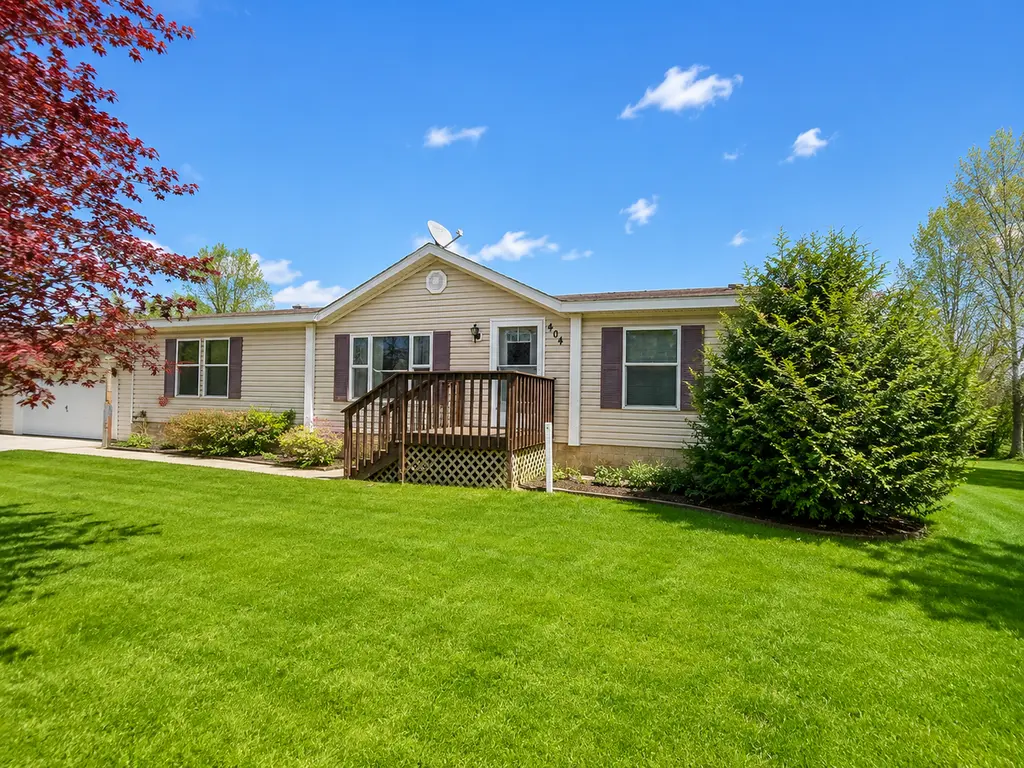
404 Hummingbird Ln · New York Mills, MN
Flood risk 1/10 · Minimal
- FEMA flood zone
- —
- Chance of flooding over 30 yrs
- 0.0%
- Est. flood insurance / yr
- —
Fire risk 2/10 · Minimal
- Est. fire insurance / yr
- $888 – $1,650
Heat risk 2/10 · Minimal
- Hot days now (above 96°F)
- 7 days/yr
- Hot days in 30 yrs
- 12 days/yr
Wind risk 2/10 · Minimal
- Chance of severe wind over 30 yrs
- —
Air-quality risk 3/10 · Minor
- Unhealthy air days now
- 2 days/yr
- Unhealthy air days in 30 yrs
- 3 days/yr
Risk factors via First Street. Map © Google.
Why this score? — see what drove the D grade
The composite is a weighted blend of 9 inputs, each scored 0–100. Each bar is that input's sub-score; the figure is the points it added to the 100-point composite (weight × sub-score).
- ARV discount +9.9/15.0
- Appreciation +9.1/10.0
- Cash flow +6.6/30.0
- Livability +3.9/5.0
- Schools +3.8/10.0
- Rent growth +2.5/5.0
- Condition / age +2.5/5.0
- 1% rule +1.1/10.0
- DSCR +0.9/10.0
$194,900
🖨 Deal sheet 📄 Offer letter ✓ Due diligence
Listing remarks
Welcome to this well-maintained 3 bedroom, 2 bath home offering spacious living both inside and out! Enjoy the large kitchen with abundant cabinet and counter space, open dining area, and comfortable living room designed for everyday living and entertaining. The attached 2 stall garage provides convenience and extra storage. Situated on a large yard filled with mature trees, this property offers shade, privacy, and plenty of room to relax, garden or play. A great combination of space, comfort and peaceful outdoor living.
Key facts
- 0.48 acre lot
- 2 garage spots
- Built 2001
Property features AI
Exterior
- Parking: Attached garage; 2-car garage
- Utilities: City water (connected); City sewer (connected); Natural gas
- Home design: Residential property; Manufactured home; Single story
- Construction: 1,352 square feet main level (finished); Foundation: pillar/post/pier
- Exterior features: Vinyl exterior; Lot about 0.482 acres
Interior
- Bedrooms: 3 bedrooms
- Bathrooms: 2 full bathrooms
- Heating & cooling: Forced air heating; Central air conditioning
- Interior features: Pillar/post/pier foundation; One-level layout; No basement
Neighborhood map
What this means for you Summary
Snapshot
- This is a 3-bed/2.0-bath manufactured listed at $195k.
Deal economics
- At list price, monthly cash flow is $-317 ($-4k/yr) — negative.
- To cash-flow at today's rent, offer at most $139k (28.7% below list).
- To meet the 1% rule (rent ≥ 1% of price), the offer needs to be $118k (39.4% below list).
- Recommended offer: $118k (39.4% below list) — sets the bar for 1% rule.
Location & tenants
- Location reads 78/100 on livability (#112 in MN, #2,554 nationally) — a middle-class / working-renter tenant base. Strengths: crime A+, cost of living A+, housing A+; Watch: employment C-, amenities F, commute F.
- New York Mills Public School District (rural): math 41% / reading 47% proficiency, ranked #189 of 301 in MN (top 63%) — families likely to look elsewhere, expect single-tenant / working-renter base with shorter leases.
- Market conditions: 31 active listings in the ZIP; 140 units permitted in Otter Tail County in 2024 (48 in 5+ unit buildings).
Forward outlook
- In year one you build about $17k of equity ($1k loan paydown + $16k appreciation (8.2% local appreciation)).
- By year 3, paydown + projected appreciation supports a ~$43k cash-out refi (75% LTV) — recoverable capital for the next deal without selling this one.
Negotiation context
- It's been on market 19 days — a 2% lower offer ($192k) is reasonable based on typical stale-listing flexibility.
Questions for the listing agent
- What do current leases actually rent for vs. the listed asking? Can we see a recent rent roll and the last 12 months of T-12 income?
- Is there a deadline driving the sale (1031 exchange, divorce, estate, relocation)? That informs how much negotiation room exists.
- Schools are B-rated — typically a magnet for longer-tenancy family renters. What's the average tenant stay here, and is there a school-zone premium baked into asking?
- The area grade is low — what's the realistic commute time and amenity access for the typical tenant pool here? Any planned neighborhood developments (good or bad) we should know about?
- What's the average days-on-market for RENTAL listings here right now (not sales)? A rising rental-DOM trend means longer vacancies and softer asking-rent achievability than the comps imply.
- What's the recent tenant-quality profile in this submarket — average credit score on applications, eviction rate, late-payment / NSF rate, and stable-employment percentage? A property-management company in the area should have these aggregated.
- How much new for-sale + rental construction is in the pipeline within 1–3 miles? Heavy new supply typically softens prices + rents 12–24 months out; constrained supply supports both.
Investment metrics
- 1% rule
- 0.61% ✗
- Cap rate
- 4.34%
- Cash-on-cash
- -6.97%
- DSCR
- 0.69
- GRM
- 13.8
CMA / ARV
- ARV (median comp)
- $205,740
- List price
- $194,900
- Delta
- -5.27%
- Verdict
- FAIR
- Comps
- 1 within 2.0 mi
Projected returns pro-forma
8.2% appreciation · 3.0% rent growth · sell at horizon
- IRR
- 15.2%
- Equity multiple
- 2.15×
- Total profit
- $62,599
- Equity at exit
- $150,785
- IRR
- 14.9%
- Equity multiple
- 4.60×
- Total profit
- $196,674
- Equity at exit
- $301,934
Cash invested: $54,572 (down + closing). Projections, not guarantees.
Landlord ↔ Tenant lean methodology
- Overall (STATE)
- 46 Balanced
- State Minnesota
- 46 Balanced · D+2
- County
- — inherits STATE
- City
- — inherits STATE
ZIP-level market 56567
- Home prices YoY
- 3.5%
- Active inventory
- 31
- Price-to-rent
- 13.8×
Monthly cashflow live
- Estimated rent
- $1,181 medium interval (Pro) →
- Mortgage (P&I)
- −$1,022
- Tax from tax record
- −$147 /mo · $1,764/yr
- Insurance
- −$81
- HOA
- −$0
- Vacancy / Maint / Mgmt
- −$248
- Net cashflow
- $-317
Break-even live
UW: 25.0% down · 7.5% · 30yr · 1.5% tax · 5.0% vac · 8.0% maint · 8.0% mgmt
Financing live
Cash to close
- Down payment
- $48,725
- Closing costs
- $5,847
- Reserves months
- —
- Total cash needed
- —
Loan-product check · same deal, 3 products live
Conventional
25% down · 7.5% · 30yr
- Down + closing
- —
- Monthly P&I
- —
- Monthly cashflow
- —
- DSCR
- —
- Eligible?
- —
Personal DTI + credit; lowest rate.
DSCR
20% down · 8.5% · 30yr
- Down + closing
- —
- Monthly P&I
- —
- Monthly cashflow
- —
- DSCR
- —
- Eligible?
- —
No personal income docs; deal must DSCR.
Hard money
10% down · 12.0% · 12mo
- Down + closing
- —
- Monthly P&I
- —
- Monthly cashflow
- —
- DSCR
- —
- Eligible?
- —
Short-term bridge; refi at stabilization.
Listing history 13 events
-
2026-06-13statusdays on market $194,900 Pending 19 DOM
-
2026-06-12days on market $194,900 Contingent - Inspection 18 DOM
-
2026-06-09days on market $194,900 Contingent - Inspection 15 DOM
-
2026-06-08days on market $194,900 Contingent - Inspection 14 DOM
-
2026-06-07days on market $194,900 Contingent - Inspection 13 DOM
-
2026-06-05days on market $194,900 Contingent - Inspection 11 DOM
-
2026-06-04days on market $194,900 Contingent - Inspection 9 DOM
-
2026-06-03status $194,900 Contingent - Inspection 8 DOM
-
2026-06-02days on market $194,900 Active 8 DOM
-
2026-06-01days on market $194,900 Active 7 DOM
-
2026-05-31days on market $194,900 Active 6 DOM
-
2026-05-31days on market $194,900 Active 5 DOM
-
2026-05-13historical $194,900 530-char remark
ⓘ Source: listings_history table (triggers on properties + properties_extension) + one-shot
backfill from property_details.listing_events for pre-trigger history.
Tax reassessment forecast MN · Partial reset (capped growth)
- Current annual tax
- $1,764 · $147/mo
- Projected year-2 tax
- $1,973 · $164/mo
- Expected delta
- +$209/yr (+$17/mo · 11.9%)
ⓘ Screening estimate from a state-policy table — verify with the county assessor before closing.
Climate risk First Street
- Flood 1/10 Low 0% chance over 30 yrs
- Wildfire 2/10 Low
- Heat 2/10 Low 7 d/yr ≥96°F today · 12 d/yr by 30 yrs out
- Wind 2/10 Low
- Air quality 3/10 Moderate 2 unhealthy d/yr today · 3 by 30 yrs out
Nearby sold comps map
Loading sold comps map…
Walkable amenities ~0.75 mi
Loading nearby amenities…
Taxation est. · year 1
- Rental income
- $14,174
- − Mortgage interest
- −$10,917
- − Property taxes
- −$1,764
- − Insurance
- −$974
- − Repairs & maintenance
- −$1,134
- − Management
- −$1,134
- − Depreciation
- −$5,670
- Taxable loss
- −$7,419
- Est. tax savings @ 24.0%
- +$1,781
- After-tax cash flow
- $-2,025/yr
For passive investors: Depreciation is non-cash, so a rental often shows a tax loss while cash-flowing — sheltering income. Rental losses are passive: they offset passive income freely, and up to $25,000/yr can offset ordinary (W-2) income if you actively participate and your MAGI is under $100k (phasing out to $0 by $150k); unused losses carry forward. On sale, claimed depreciation is recaptured at up to 25%, and gains may owe capital-gains tax (a 1031 exchange can defer both). Figures are a year-1 estimate at your 24.0% rate — not tax advice; consult a CPA.
Schools (NCES district)
- District
- New York Mills Public School District
- NCES district ID
- 2723520
- Math proficiency
- 41% ▼ -15.00%
- Reading proficiency
- 47% ▼ -13.00%
- Median HH income
- $47,845
- Composite
- 37.59/100
- National rank
- #4382
- State rank
- #189 of 301 in MN
Livability — New York Mills
- Score
- 78/100
- State rank
- #112
- US rank
- #2554
Category grades
Schools grade is shown separately in the Schools card above.
Census & demographics
- Census place
- New York Mills, MN
- Population (ZIP)
- 3,247
Population outlook (Otter Tail County) Hauer SSP2
- Today (2025)
- 58,183 people
- By 2030
- 58,267 · +0.1%
- By 2040
- 57,999 · -0.3%
- By 2050
- 57,183 · -1.7%
- By 2075
- 57,638 · -0.9%
- By 2100
- 54,697 · -6.0%
Race, ethnicity, and origin ACS 2023
- Neighborhood character
- Predominantly White (93%)
- Race & ethnicity
- White 93% Two or more races 4% Hispanic / Latino 1%
- Common ancestry
- Portuguese 10% Romanian 6% Iranian 3%
- Foreign-born
- 1% · Canada
- Languages at home
- 94% English-only · Spanish 2% German/W. Germanic 2%
Political lean MEDSL · Otter Tail
- 2024 margin
- Solid R (+34.2) · D 32.1% · R 66.3% · Other 1.6%
- 2008→2024 swing
- -21.3pp toward R · 2008: -12.9pp · 2024: -34.2pp
- All cycles
- 2024: R+34.2 2020: R+32.5 2016: R+35.9 2012: R+21.2 2008: R+12.9
Not yet ingested
- Civics
- —
Market trends
- HPI YoY
- ▲ 8.20%
- Current HPI
- 244.2142
- Rent YoY
- —
- Metro
- —
- State GDP YoY
- ▲ 2.41%
- F500 in state
- 34
Industry mix (Fortune 500 HQ in MN)
| Industry | F500 HQs | Revenue |
|---|---|---|
| Healthcare | 2 | $407B |
|
||
| Retail | 2 | $150B |
|
||
| Consumer Goods | 2 | $32B |
|
||
| Industrial Machinery | 2 | $6B |
|
||
| Agriculture | 1 | $40B |
|
||
| Healthcare / Medical Devices | 1 | $32B |
|
||
Price history
+0.0% since first listed4 events — show timeline
- 2026-06-13 Pending — NORTHSTARMLS as Distributed by MLS Grid
- 2026-06-02 Contingent — NORTHSTARMLS as Distributed by MLS Grid
- 2026-05-26 Listed $194,900 NORTHSTARMLS as Distributed by MLS Grid
- 2026-05-13 Coming Soon $194,900 NORTHSTARMLS as Distributed by MLS Grid
Property tax history
+8.2%/yrLatest (2025): $1,764 · +3.8% YoY. Source: county tax records.
Cash-flow waterfall
monthlySold comps — $/sqft
last 12 mo · ≤1 miLoading sold comps…