1551 Acapulco Rd NE · Rio Rancho, NM
Flood risk 1/10 · Minimal
- FEMA flood zone
- X (unshaded)
- Chance of flooding over 30 yrs
- 0.0%
- Est. flood insurance / yr
- $507 – $1,088
Fire risk 4/10 · Minor
- Est. fire insurance / yr
- $706 – $1,312
Heat risk 5/10 · Moderate
- Hot days now (above 95°F)
- 7 days/yr
- Hot days in 30 yrs
- 19 days/yr
Wind risk 1/10 · Minimal
- Chance of severe wind over 30 yrs
- —
Air-quality risk 3/10 · Minor
- Unhealthy air days now
- 2 days/yr
- Unhealthy air days in 30 yrs
- 3 days/yr
Risk factors via First Street. Map © Google.
Why this score? — see what drove the C grade
The composite is a weighted blend of 9 inputs, each scored 0–100. Each bar is that input's sub-score; the figure is the points it added to the 100-point composite (weight × sub-score).
- Cash flow +16.4/30.0
- ARV discount +15.0/15.0
- Schools +5.2/10.0
- DSCR +5.1/10.0
- Rent growth +4.2/5.0
- Livability +3.6/5.0
- 1% rule +3.5/10.0
- Condition / age +2.5/5.0
- Appreciation +0.0/10.0
$310,000
🖨 Deal sheet 📄 Offer letter ✓ Due diligence
Listing remarks
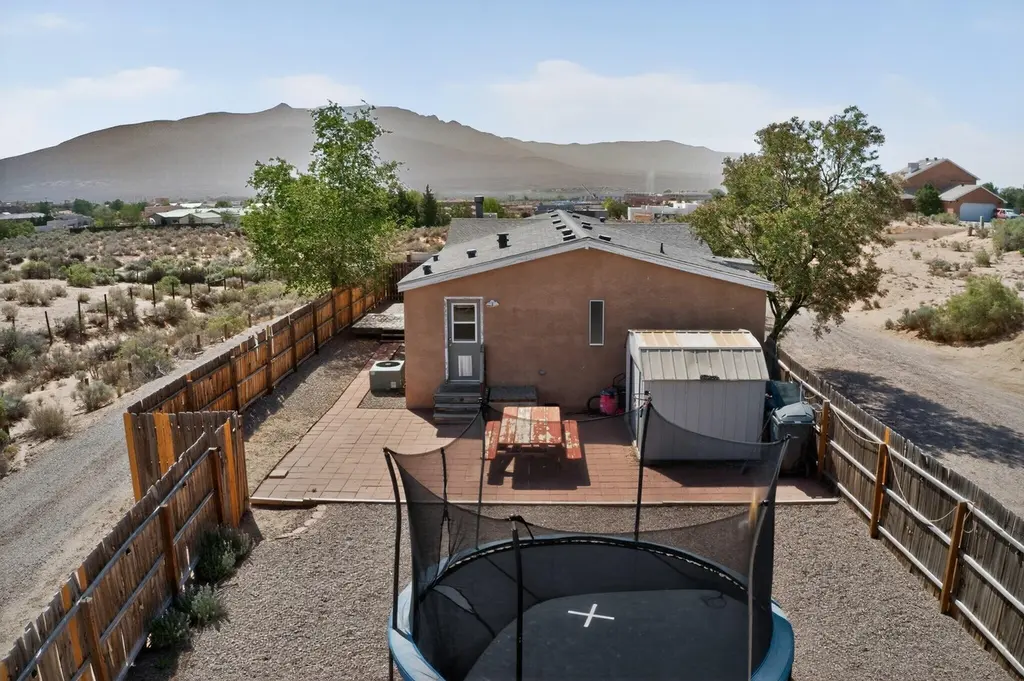
Opportunity awaits with this spacious 4 bedroom manufactured home situated on a generous gated 1/2 acre lot in a very desirable Rio Rancho location. Breathtaking mountain views truly cannot be beat! Inside you'll find a bright & open floor plan featuring solid surface flooring throughout, 2 living areas, & a cozy fireplace. The roof is approximately 7 year old, providing added peace of mind. As an added bonus- the adjacent lot is also available for purchase, offering a rare opportunity to expand your property, create additional space, or invest for the future. No special financing required- the title is deactivated, making this home eligible for traditional financing options. Th
Key facts
- Two living areas
- Mountain views
- 0.5 acre lot
Tags
Property features AI
Exterior
- Utilities: Electricity connected; Propane service; Water available; Private well; Septic tank
- Home design: Double-wide mobile home; Single-story; Resale property; Faces south
- Construction: Stucco construction; Pitched roof; Built by Palm Harbor; Mobile home approx. 65' x 28'
- Exterior features: Owned propane tank; Open patio; Patio; Shed(s); Gate; Landscaped lot; Scenic views; Dirt road access; Has view
Interior
- Kitchen: Free-standing electric range; Microwave; Dishwasher
- Bedrooms: Main-level primary
- Flooring: Laminate
- Bathrooms: 2 full bathrooms
- Heating & cooling: Central heating; Forced-air heating; Propane heating; Refrigerated cooling
- Interior features: Breakfast bar; Ceiling fans; Dual sinks; Great room; Multiple living areas; Main-level primary bedroom; Pantry; Skylights; Double-pane insulated vinyl windows
- Laundry & utility: Washer; Dryer; Electric dryer hookup; Propane dryer hookup
Neighborhood map
What this means for you Summary
Snapshot
- This is a 4-bed/2.0-bath single-family listed at $310k.
Deal economics
- At list price, monthly cash flow is $178 ($2k/yr) — positive.
- The deal already cash-flows at list — no discount required.
- To meet the 1% rule (rent ≥ 1% of price), the offer needs to be $265k (14.5% below list).
- Recommended offer: $265k (14.5% below list) — sets the bar for 1% rule.
- Cap rate 7.0% vs local median 3.6% in Rio Rancho — top-decile yield for the area; either an underpriced asset or a hidden risk that comps aren't pricing in. Stress-test before assuming the spread holds.
Location & tenants
- Location reads 71/100 on livability (#17 in NM) — a middle-class / working-renter tenant base. Strengths: housing A+, cost of living A; Watch: schools C-, amenities D, commute F.
- Rio Rancho Public Schools (suburban): math 48% / reading 73% proficiency, ranked #4 of 29 in NM (top 14%) — acceptable for families but not a draw, mixed tenant base, ~2y average lease.
- Market conditions: Rents rising fast (+6.9%/yr); 1315 active listings in the ZIP; 2 comparable units currently listed for rent nearby; solid renter incomes; 1,278 units permitted in Sandoval County in 2024 (216 in 5+ unit buildings).
- This rent runs 34% of the median local income ($95k/yr) — at the standard rent-burdened threshold; future hikes will face affordability resistance.
Forward outlook
- Local home prices are declining (-3.0%/yr); year-one equity from $2k of loan paydown is wiped out by about $9k of value loss. Plan a longer hold.
- Sandoval County population projected at +15% by 2050 — long-run rental-demand tailwind backs the buy-and-hold thesis.
Negotiation context
- Only 2 days on market — expect competitive offers; lowballing is unlikely to land.
- 3 sale attempts since 7y ago with the ask held roughly flat each time — persistent listings suggest the price (not the market) is what's stuck; bring a comps-based counter.
Risks & watch-outs
- Climate carrying-cost: extreme-heat days projected 7→19/yr by 2055 (HVAC capex compounding) — expect insurance premiums to compound above CPI over the hold.
Questions for the listing agent
- Is there a deadline driving the sale (1031 exchange, divorce, estate, relocation)? That informs how much negotiation room exists.
- What's the average days-on-market for RENTAL listings here right now (not sales)? A rising rental-DOM trend means longer vacancies and softer asking-rent achievability than the comps imply.
- What's the recent tenant-quality profile in this submarket — average credit score on applications, eviction rate, late-payment / NSF rate, and stable-employment percentage? A property-management company in the area should have these aggregated.
- How much new for-sale + rental construction is in the pipeline within 1–3 miles? Heavy new supply typically softens prices + rents 12–24 months out; constrained supply supports both.
Investment metrics
- 1% rule
- 0.85% ✗
- Cap rate
- 6.98%
- Cash-on-cash
- 2.46%
- DSCR
- 1.11
- GRM
- 9.7
CMA / ARV
- ARV (on-the-fly)
- $384,116
- Comps found
- 5
Show comp detail 5 sales within ~0.75 mi
| Address | Dist | Beds/Ba | Sqft | Sold | Price | $/sf | Match |
|---|---|---|---|---|---|---|---|
| 6383 Roadrunner Loop NE | 0.67mi | 4/2.0 | 1,772 (+1%) | 3mo | $344,900 | $195 | 66 |
| 5983 Kim Rd NE | 0.38mi | 3/2.0 (-1) | 1,616 (-8%) | 8mo | $499,000 | $309 | 57 |
| 5870 Miller Rd NE | 0.27mi | 3/2.0 (-1) | 1,881 (+7%) | 20mo | $415,000 | $221 | 54 |
| 6301 Magpie Way NE | 0.59mi | 4/2.0 | 1,558 (-12%) | 9mo | $340,000 | $218 | 46 |
| 6404 Gambel Quail Rd NE | 0.71mi | 3/2.0 (-1) | 1,633 (-7%) | 6mo | $309,900 | $190 | 45 |
Match score weights: distance 35% · size 25% · config 20% · recency 20%. Top-matched comps best support the ARV.
Projected returns pro-forma
-3.0% appreciation · 6.88% rent growth · sell at horizon
- IRR
- -8.6%
- Equity multiple
- 0.67×
- Total profit
- $-28,270
- Equity at exit
- $46,222
- IRR
- 5.0%
- Equity multiple
- 1.43×
- Total profit
- $37,333
- Equity at exit
- $26,803
Cash invested: $86,800 (down + closing). Projections, not guarantees.
Landlord ↔ Tenant lean methodology
- Overall (STATE)
- 55 Moderately Landlord-Leaning
- State New Mexico
- 55 Moderately Landlord-Leaning · D+3
- County
- — inherits STATE
- City
- — inherits STATE
ZIP-level market 87144
- Home prices YoY
- -30.8%
- Rents YoY
- 6.9%
- Active inventory
- 1315
- Price-to-rent
- 9.7×
Monthly cashflow live
- Estimated rent
- $2,650 medium interval (Pro) →
- Mortgage (P&I)
- −$1,626
- Tax from tax record
- −$161 /mo · $1,935/yr
- Insurance
- −$129
- HOA
- −$0
- Vacancy / Maint / Mgmt
- −$557
- Net cashflow
- $178
Break-even live
UW: 25.0% down · 7.5% · 30yr · 1.5% tax · 5.0% vac · 8.0% maint · 8.0% mgmt
Financing live
Cash to close
- Down payment
- $77,500
- Closing costs
- $9,300
- Reserves months
- —
- Total cash needed
- —
Loan-product check · same deal, 3 products live
Conventional
25% down · 7.5% · 30yr
- Down + closing
- —
- Monthly P&I
- —
- Monthly cashflow
- —
- DSCR
- —
- Eligible?
- —
Personal DTI + credit; lowest rate.
DSCR
20% down · 8.5% · 30yr
- Down + closing
- —
- Monthly P&I
- —
- Monthly cashflow
- —
- DSCR
- —
- Eligible?
- —
No personal income docs; deal must DSCR.
Hard money
10% down · 12.0% · 12mo
- Down + closing
- —
- Monthly P&I
- —
- Monthly cashflow
- —
- DSCR
- —
- Eligible?
- —
Short-term bridge; refi at stabilization.
Rent comps 2 comps
| Address | Beds | Baths | Sqft | Rent | $/sqft | DOM | Units | Dist |
|---|---|---|---|---|---|---|---|---|
| 1416 Monterrey Rd NE Rio Rancho, NM | 3.0 | 2.0 | 2212 | $2,600 | $1.18 | 16d | 1 | 0.36mi |
| 2059 Columbia Ct NE Rio Rancho, NM | 4.0 | 2.5 | 1887 | $2,300 | $1.22 | 43d | 1 | 1.45mi |
Listing history 4 events
-
2026-06-09status $310,000 Pending 2 DOM
-
2026-06-08days on market $310,000 Active 2 DOM
-
2026-06-07remarks 691-char remark
-
2026-06-07$310,000 Active 1 DOM
ⓘ Source: listings_history table (triggers on properties + properties_extension) + one-shot
backfill from property_details.listing_events for pre-trigger history.
Tax reassessment forecast NM · Resets to sale price
- Current annual tax
- $1,935 · $161/mo
- Projected year-2 tax
- $2,480 · $207/mo
- Expected delta
- +$545/yr (+$45/mo · 28.1%)
ⓘ Screening estimate from a state-policy table — verify with the county assessor before closing.
Climate risk First Street
- Flood 1/10 Low FEMA zone X (unshaded) · 0% chance over 30 yrs
- Wildfire 4/10 Moderate
- Heat 5/10 Major 7 d/yr ≥95°F today · 19 d/yr by 30 yrs out
- Wind 1/10 Low
- Air quality 3/10 Moderate 2 unhealthy d/yr today · 3 by 30 yrs out
Nearby sold comps map
Loading sold comps map…
Walkable amenities ~0.75 mi
Loading nearby amenities…
Taxation est. · year 1
- Rental income
- $31,804
- − Mortgage interest
- −$17,365
- − Property taxes
- −$1,935
- − Insurance
- −$1,550
- − Repairs & maintenance
- −$2,544
- − Management
- −$2,544
- − Depreciation
- −$9,018
- Taxable loss
- −$3,153
- Est. tax savings @ 24.0%
- +$757
- After-tax cash flow
- $2,888/yr
For passive investors: Depreciation is non-cash, so a rental often shows a tax loss while cash-flowing — sheltering income. Rental losses are passive: they offset passive income freely, and up to $25,000/yr can offset ordinary (W-2) income if you actively participate and your MAGI is under $100k (phasing out to $0 by $150k); unused losses carry forward. On sale, claimed depreciation is recaptured at up to 25%, and gains may owe capital-gains tax (a 1031 exchange can defer both). Figures are a year-1 estimate at your 24.0% rate — not tax advice; consult a CPA.
Schools (NCES district)
- District
- Rio Rancho Public Schools
- NCES district ID
- 3500010
- Math proficiency
- 48% ▲ 38.00%
- Reading proficiency
- 73% ▲ 48.00%
- Median HH income
- $59,410
- Composite
- 52.29/100
- National rank
- #1595
- State rank
- #4 of 29 in NM
Livability — Rio Rancho
- Score
- 71/100
- State rank
- #17
- US rank
- #7253
Category grades
Schools grade is shown separately in the Schools card above.
Census & demographics
- Census place
- Rio Rancho, NM
- County
- Sandoval County · 110,336 people
- City population
- 110,336
- Metro
- Albuquerque, NM
- Population (ZIP)
- 51,837
- Household income
- $94,550
- Rent vs Own
- Severe rent burden
- 528.0
Population outlook (Sandoval County) Hauer SSP2
- Today (2025)
- 155,072 people
- By 2030
- 161,714 · +4.3%
- By 2040
- 171,831 · +10.8%
- By 2050
- 178,536 · +15.1%
- By 2075
- 192,517 · +24.1%
- By 2100
- 197,952 · +27.7%
Race, ethnicity, and origin ACS 2023
- Neighborhood character
- Diverse neighborhood (Simpson 0.61)
- Race & ethnicity
- White 44% Hispanic / Latino 44% Two or more races 24% Native American 4% Black 3% Asian 1%
- Hispanic origin (detail)
- Mexican 23% Puerto Rican 1%
- Common ancestry
- Slovak 3% Lithuanian 3% Italian 2%
- Foreign-born
- 5% · Canada
- Languages at home
- 80% English-only · Spanish 16%
Political lean MEDSL · Sandoval
- 2024 margin
- Lean D (+5.8) · D 51.8% · R 46.0% · Other 2.2%
- 2008→2024 swing
- -7.0pp toward R · 2008: 12.8pp · 2024: 5.8pp
- All cycles
- 2024: D+5.8 2020: D+8.4 2016: D+2.7 2012: D+5.1 2008: D+12.8
Not yet ingested
- Civics
- —
Market trends
- HPI YoY
- ▼ -95.68%
- Current HPI
- 215.124
- Rent YoY
- ▲ 6.88%
- Metro
- Albuquerque, NM
- State GDP YoY
- —
- F500 in state
- 0
Price history
+72.3% since first listed9 events — show timeline
- 2026-06-03 Listed $310,000 Southwest MLS
- 2019-11-02 Delisted — Southwest MLS
- 2019-10-29 Sold (Public Records) — Public Records
- 2019-09-17 Pending — Southwest MLS
- 2019-09-12 Relisted — Southwest MLS
- 2019-08-31 Pending — Southwest MLS
- 2019-08-13 Listed $179,900 Southwest MLS
- 2006-04-28 Sold (Public Records) — Public Records
- 2002-05-28 Sold (Public Records) — Public Records
Property tax history
+1.0%/yrLatest (2024): $1,935 · -0.4% YoY. Source: county tax records.
Cash-flow waterfall
monthlySold comps — $/sqft
last 12 mo · ≤1 miLoading sold comps…