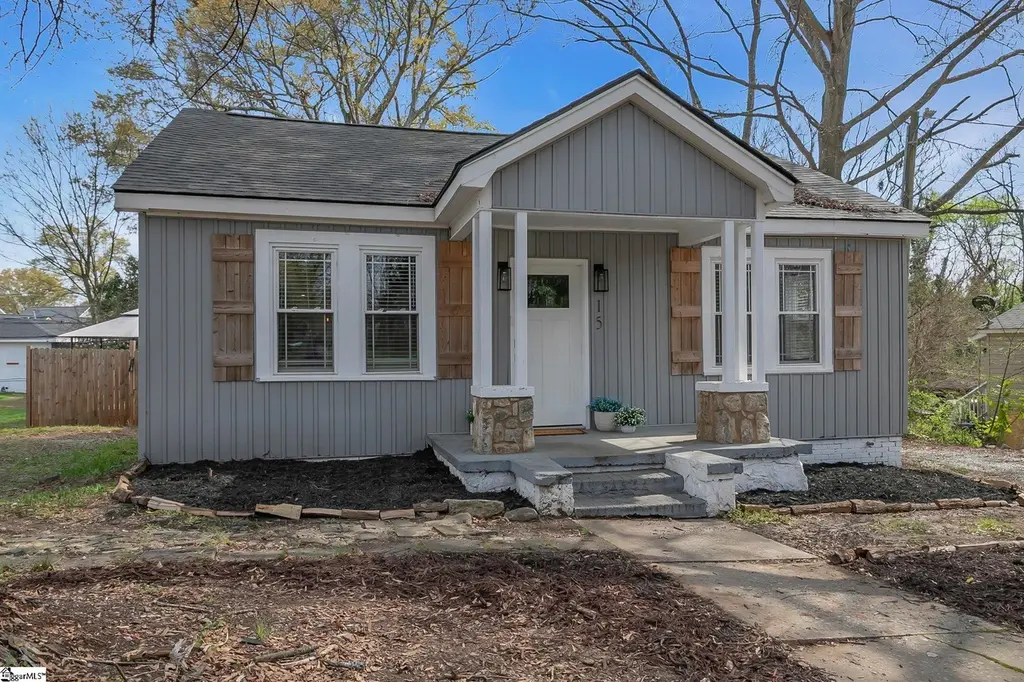
15 Piedmont Ave · Judson, SC
Flood risk 1/10 · Minimal
- FEMA flood zone
- X (unshaded)
- Chance of flooding over 30 yrs
- 0.0%
- Est. flood insurance / yr
- $507 – $1,088
Fire risk 1/10 · Minimal
- Est. fire insurance / yr
- $783 – $1,453
Heat risk 5/10 · Moderate
- Hot days now (above 102°F)
- 7 days/yr
- Hot days in 30 yrs
- 16 days/yr
Wind risk 2/10 · Minimal
- Chance of severe wind over 30 yrs
- 1.0%
Air-quality risk 4/10 · Minor
- Unhealthy air days now
- 4 days/yr
- Unhealthy air days in 30 yrs
- 4 days/yr
Risk factors via First Street. Map © Google.
Why this score? — see what drove the C- grade
The composite is a weighted blend of 9 inputs, each scored 0–100. Each bar is that input's sub-score; the figure is the points it added to the 100-point composite (weight × sub-score).
- ARV discount +15.0/15.0
- Cash flow +14.7/30.0
- DSCR +4.5/10.0
- Schools +4.2/10.0
- Livability +4.0/5.0
- 1% rule +3.1/10.0
- Rent growth +2.9/5.0
- Condition / age +2.5/5.0
- Appreciation +0.0/10.0
$325,000
🖨 Deal sheet (PDF) 📄 Offer letter ✓ Due diligence
Listing remarks
Rare opportunity to own a fully renovated home with an exceptional number of bedrooms at this price point. This spacious property is move in ready and features updated finishes throughout including engineered hardwood floors, a beautifully refreshed kitchen with modern cabinetry, stainless steel appliances, and a functional island that opens to the main living areas. The flexible floor plan provides ample space for a variety of living arrangements, along with well sized bedrooms and updated bathrooms. Outside, enjoy a large deck perfect for entertaining and a fenced yard offering privacy and usability. Conveniently located just minutes from Downtown Greenville, with easy access to Prisma He
Key facts
- Updated finishes
- Fully renovated home
- Flexible floor plan
Tags
Property features AI
Finance
- Other: Lead-based paint and residential property disclosures required
- HOA & community: No HOA fees
Exterior
- Parking: Driveway parking; Gravel/unpaved driveway
- Utilities: Public water; Public sewer; Public garbage pickup; Electric service
- Home design: Single-story home; Built in 1968; Crawl space foundation
- Construction: Vinyl siding exterior; Architectural roof
- Exterior features: Front porch; Deck; Fenced yard; Some trees; Outbuilding for storage
Interior
- Kitchen: 12 x 14 kitchen; Dishwasher; Built-in microwave; Stand-alone smooth-top range
- Bedrooms: Six bedrooms on the main level; Primary bedroom with double sink, full bath and separate shower; Primary bedroom approx. 11 x 14; Second bedroom approx. 14 x 14; Third bedroom approx. 11 x 11; Fourth bedroom approx. 9 x 11; Fifth bedroom approx. 10 x 12
- Flooring: Hardwood floors; Other flooring (see remarks)
- Bathrooms: Two full bathrooms (both on the main level)
- Heating & cooling: Electric forced-air heating; Central electric cooling; Gas water heater
- Interior features: Open floor plan; Blown ceiling insulation; Smooth ceilings; Disappearing attic stairs; Countertops (other)
- Laundry & utility: Laundry on the first floor in closet-style location
Neighborhood map
What this means for you Summary
Snapshot
- This is a 3-bed/2.0-bath single-family listed at $325k.
Deal economics
- At list price, monthly cash flow is $86 ($1k/yr) — positive.
- The deal already cash-flows at list — no discount required.
- To meet the 1% rule (rent ≥ 1% of price), the offer needs to be $263k (19.1% below list).
- Recommended offer: $263k (19.1% below list) — sets the bar for 1% rule.
Location & tenants
- Location reads 80/100 on livability (#10 in SC, #1,636 nationally) — a professional / high-income tenant draw. Strengths: commute A+, cost of living A+, housing A+; Watch: employment F.
- Greenville 01 (suburban): math 44% / reading 54% proficiency, ranked #10 of 80 in SC (top 12%) — families likely to look elsewhere, expect single-tenant / working-renter base with shorter leases.
- Zoned schools: Hollis Academy (math 28% / reading 21%, grade F, #452 of 597 statewide, top 78%, 608 students, 100% FRL) — zoned schools average 100% FRL vs 42% district-wide (58 pts higher); higher-poverty schools than district average — tighter screening recommended.
- Zoned-school proficiency averages 24% at this address vs 49% district-wide (-24 pts) — the specific schools serving this property underperform the Greenville 01 average; the district grade overstates school quality for this exact location.
- Market conditions: Rents rising (+1.7%/yr); 278 active listings in the ZIP; 17 comparable units currently listed for rent nearby; rentals at typical pace (median 16d on market — plan ~3-4 weeks tenant-placement turnaround); 5,595 units permitted in Greenville County in 2024 (566 in 5+ unit buildings).
- At $2,631/mo this rent would consume 61% of the median local household income ($52k/yr) (locally 1754% of renters already pay >50% of income on rent) — very limited rent-growth headroom before tenants either downsize or default.
Forward outlook
- Local home prices are declining (-3.0%/yr); year-one equity from $2k of loan paydown is wiped out by about $10k of value loss. Plan a longer hold.
- Greenville County population projected at +34% by 2050 — long-run rental-demand tailwind backs the buy-and-hold thesis.
Negotiation context
- It's been on market 34 days — a 3% lower offer ($315k) is reasonable based on typical stale-listing flexibility.
- 5 sale attempts since 20y ago with the ask held roughly flat each time — persistent listings suggest the price (not the market) is what's stuck; bring a comps-based counter.
- Current owner paid $156k; list at $325k implies a 108% gain — meaningful room to come down on a strong offer.
Risks & watch-outs
- Climate carrying-cost: extreme-heat days projected 7→16/yr by 2055 (HVAC capex compounding) — expect insurance premiums to compound above CPI over the hold.
Questions for the listing agent
- It's been on market 34 days. Have you received any prior offers? Is the seller open to a 19% concession, seller financing, or rate buy-down credit?
- Built in 1968 — when were the roof, HVAC, electrical panel, plumbing, and water heater last replaced?
- Is there a deadline driving the sale (1031 exchange, divorce, estate, relocation)? That informs how much negotiation room exists.
- Schools are F-rated, which usually means shorter tenancies and higher turnover. Who's the typical renter profile here, and what's been the actual vacancy rate?
- What's the average days-on-market for RENTAL listings here right now (not sales)? A rising rental-DOM trend means longer vacancies and softer asking-rent achievability than the comps imply.
- What's the recent tenant-quality profile in this submarket — average credit score on applications, eviction rate, late-payment / NSF rate, and stable-employment percentage? A property-management company in the area should have these aggregated.
- How much new for-sale + rental construction is in the pipeline within 1–3 miles? Heavy new supply typically softens prices + rents 12–24 months out; constrained supply supports both.
Investment metrics
- 1% rule
- 0.81% ✗
- Cap rate
- 6.61%
- Cash-on-cash
- 1.14%
- DSCR
- 1.05
- GRM
- 10.3
CMA / ARV
- ARV (on-the-fly)
- $459,024
- Comps found
- 1
Show comp detail 1 sale within ~0.75 mi
| Address | Dist | Beds/Ba | Sqft | Sold | Price | $/sf | Match |
|---|---|---|---|---|---|---|---|
| 105B Mary St | 0.50mi | 3/2.5 | 2,055 (-2%) | 6mo | $450,000 | $219 | 66 |
Match score weights: distance 35% · size 25% · config 20% · recency 20%. Top-matched comps best support the ARV.
Projected returns pro-forma
-3.0% appreciation · 1.72% rent growth · sell at horizon
- IRR
- -15.8%
- Equity multiple
- 0.44×
- Total profit
- $-50,635
- Equity at exit
- $48,459
- IRR
- -9.6%
- Equity multiple
- 0.44×
- Total profit
- $-50,873
- Equity at exit
- $28,100
Cash invested: $91,000 (down + closing). Projections, not guarantees.
Landlord ↔ Tenant lean methodology
- Overall (STATE)
- 90 Strongly Landlord-Friendly
- State South Carolina
- 90 Strongly Landlord-Friendly · R+6
- County
- — inherits STATE
- City
- — inherits STATE
ZIP-level market 29611
- Home prices YoY
- -34.6%
- Rents YoY
- 1.7%
- Active inventory
- 278
- Price-to-rent
- 10.3×
Monthly cashflow live
- Estimated rent
- $2,631 high interval (Pro) →
- Mortgage (P&I)
- −$1,704
- Tax from tax record
- −$152 /mo · $1,829/yr
- Insurance
- −$135
- HOA
- −$0
- Vacancy / Maint / Mgmt
- −$552
- Net cashflow
- $86
Break-even live
Sensitivity live
| Price | -10% $270 | -5% $178 | +0% $86 | +5% $-6 | +10% $-98 |
|---|---|---|---|---|---|
| Rent | -10% $-122 | -5% $-18 | +0% $86 | +5% $190 | +10% $294 |
| Rate | -1.0pp $250 | -0.5pp $169 | base $86 | +0.5pp $2 | +1.0pp $-84 |
UW: 25.0% down · 7.5% · 30yr · 1.5% tax · 5.0% vac · 8.0% maint · 8.0% mgmt
Financing live
Cash to close
- Down payment
- $81,250
- Closing costs
- $9,750
- Reserves months
- —
- Total cash needed
- —
Loan-product check · same deal, 3 products live
Conventional
25% down · 7.5% · 30yr
- Down + closing
- —
- Monthly P&I
- —
- Monthly cashflow
- —
- DSCR
- —
- Eligible?
- —
Personal DTI + credit; lowest rate.
DSCR
20% down · 8.5% · 30yr
- Down + closing
- —
- Monthly P&I
- —
- Monthly cashflow
- —
- DSCR
- —
- Eligible?
- —
No personal income docs; deal must DSCR.
Hard money
10% down · 12.0% · 12mo
- Down + closing
- —
- Monthly P&I
- —
- Monthly cashflow
- —
- DSCR
- —
- Eligible?
- —
Short-term bridge; refi at stabilization.
Rent comps 17 comps
| Address | Beds | Baths | Sqft | Rent | $/sqft | DOM | Units | Dist |
|---|---|---|---|---|---|---|---|---|
| 701 Easley Bridge Rd Greenville, SC | 3.0 | 1.0–2.5 | 1324 | $3,465 | $2.62 | 4d | 110 | 0.28mi |
| 35 Burdette St Greenville, SC | 2.0 | 2.0 | 1600 | $1,950 | $1.22 | 25d | 1 | 0.85mi |
| 520 Perry Ave Greenville, SC | 3.0 | 2.0 | 1600 | $1,795 | $1.12 | 16d | 1 | 1.00mi |
| 708 Anderson Rd Greenville, SC | 2.0 | 2.5 | 2120 | $2,750 | $1.30 | 5d | 1 | 1.03mi |
| 207 S Calhoun St Unit B Greenville, SC | 3.0 | 2.5 | 1730 | $2,597 | $1.50 | 16d | 1 | 1.04mi |
| 411 Perry Ave Unit 1 Greenville, SC | 3.0 | 2.5 | 2000 | $3,400 | $1.70 | 25d | 1 | 1.07mi |
| 7 Hamilton Ave Unit 1 Greenville, SC | 3.0 | 3.0 | 1400 | $3,999 | $2.86 | 25d | 1 | 1.08mi |
| 34 3rd St Greenville, SC | 4.0 | 3.0 | 2100 | $2,650 | $1.26 | 16d | 1 | 1.11mi |
| 5 Charles St Greenville, SC | 3.0 | 2.0 | 1492 | $1,800 | $1.21 | 25d | 1 | 1.21mi |
| 113 Taverly Dr Greenville, SC | 3.0 | 2.5 | 1507 | $2,024 | $1.34 | 21d | 1 | 1.24mi |
| 115 Taverly Dr Greenville, SC | 3.0 | 2.5 | 1571 | $2,024 | $1.29 | 21d | 1 | 1.25mi |
| 1 E Main St Greenville, SC | 1.0–3.0 | 1.0–2.0 | 1241 | $2,600 | $2.10 | 5d | 28 | 1.25mi |
| 210 N Leach St Greenville, SC | 3.0 | 2.5 | 1886 | $2,916 | $1.55 | 5d | 1 | 1.33mi |
| 1027 S Main St #206 Greenville, SC | 2.0 | 2.5 | 1600 | $4,950 | $3.09 | 25d | 1 | 1.42mi |
| 106 Grace St Greenville, SC | 3.0 | 2.0 | 1562 | $2,695 | $1.73 | 5d | 1 | 1.44mi |
| 1108 S Main St Greenville, SC | 3.0 | 1.0–2.0 | 1060 | $3,453 | $3.26 | 5d | 25 | 1.45mi |
| 1014 S Welcome Rd Greenville, SC | 3.0 | 2.0 | 1400 | $2,800 | $2.00 | 4d | 1 | 1.47mi |
Listing history 29 events
-
2026-06-22days on market $325,000 Active 34 DOM
-
2026-06-18days on market $325,000 Active 31 DOM
-
2026-06-17days on market $325,000 Active 30 DOM
-
2026-06-16days on market $325,000 Active 29 DOM
-
2026-06-15days on market $325,000 Active 28 DOM
-
2026-06-13days on market $325,000 Active 26 DOM
-
2026-06-13days on market $325,000 Active 25 DOM
-
2026-06-10days on market $325,000 Active 23 DOM
-
2026-06-09days on market $325,000 Active 22 DOM
-
2026-06-08days on market $325,000 Active 21 DOM
-
2026-06-07days on market $325,000 Active 20 DOM
-
2026-06-03days on market $325,000 Active 16 DOM
-
2026-06-03days on market $325,000 Active 15 DOM
-
2026-06-01days on market $325,000 Active 14 DOM
-
2026-05-31days on market $325,000 Active 13 DOM
-
2026-05-18$325,000 Active
-
2026-05-18historical
-
2026-04-30historical Contingency Contract
-
2026-04-21status Active
-
2026-04-14historical Contingency Contract
-
2026-03-25$330,000 Active
-
2025-09-09historical $2,400
-
2025-08-10$2,400
-
2022-06-30soldstatus $156,250
-
2006-07-05historical
-
2006-05-19$28,800
-
1985-07-26soldstatus $30,950
-
1985-02-25soldstatus $16,000
-
1979-12-01soldstatus $21,000
ⓘ Source: listings_history table (triggers on properties + properties_extension) + one-shot
backfill from property_details.listing_events for pre-trigger history.
Tax reassessment forecast SC · Resets to sale price
- Current annual tax
- $1,829 · $152/mo
- Projected year-2 tax
- $1,852 · $154/mo
- Expected delta
- +$24/yr (+$2/mo · 1.3%)
ⓘ Screening estimate from a state-policy table — verify with the county assessor before closing.
Climate risk First Street
- Flood 1/10 Low FEMA zone X (unshaded) · 0% chance over 30 yrs
- Wildfire 1/10 Low
- Heat 5/10 Major 7 d/yr ≥102°F today · 16 d/yr by 30 yrs out
- Wind 2/10 Low 100% chance of damaging wind over 30 yrs
- Air quality 4/10 Moderate 4 unhealthy d/yr today · 4 by 30 yrs out
Nearby sold comps map
Loading sold comps map…
Walkable amenities ~0.75 mi
Loading nearby amenities…
Taxation est. · year 1
- Rental income
- $31,570
- − Mortgage interest
- −$18,205
- − Property taxes
- −$1,829
- − Insurance
- −$1,625
- − Repairs & maintenance
- −$2,526
- − Management
- −$2,526
- − Depreciation
- −$9,455
- Taxable loss
- −$4,594
- Est. tax savings @ 24.0%
- +$1,103
- After-tax cash flow
- $2,137/yr
For passive investors: Depreciation is non-cash, so a rental often shows a tax loss while cash-flowing — sheltering income. Rental losses are passive: they offset passive income freely, and up to $25,000/yr can offset ordinary (W-2) income if you actively participate and your MAGI is under $100k (phasing out to $0 by $150k); unused losses carry forward. On sale, claimed depreciation is recaptured at up to 25%, and gains may owe capital-gains tax (a 1031 exchange can defer both). Figures are a year-1 estimate at your 24.0% rate — not tax advice; consult a CPA.
Schools (NCES district)
- District
- Greenville 01
- NCES district ID
- 4502310
- Math proficiency
- 44% ▼ -10.00%
- Reading proficiency
- 54% ▼ -2.00%
- Median HH income
- $49,596
- Composite
- 41.88/100
- National rank
- #3370
- State rank
- #10 of 80 in SC
Livability — Judson
- Score
- 80/100
- State rank
- #10
- US rank
- #1636
Category grades
Schools grade is shown separately in the Schools card above.
Census & demographics
- Census place
- Judson, SC
- County
- Greenville County · 573,815 people
- Metro
- Greenville-Anderson, SC
- Population (ZIP)
- 32,365
- Household income
- $51,565
- Rent vs Own
- Severe rent burden
- 1754.0
Population outlook (Greenville County) Hauer SSP2
- Today (2025)
- 574,580 people
- By 2030
- 615,615 · +7.1%
- By 2040
- 695,373 · +21.0%
- By 2050
- 769,367 · +33.9%
- By 2075
- 933,296 · +62.4%
- By 2100
- 1,029,196 · +79.1%
Race, ethnicity, and origin ACS 2023
- Neighborhood character
- Highly diverse neighborhood (Simpson 0.70)
- Race & ethnicity
- White 41% Black 29% Hispanic / Latino 22% Two or more races 12%
- Hispanic origin (detail)
- Mexican 12% Puerto Rican 2%
- Common ancestry
- Slovak 1% Italian 1% Serbian 1%
- Foreign-born
- 12% · Canada, Jamaica, China
- Languages at home
- 79% English-only · Spanish 19% Russian/Polish/Slavic 1%
Political lean MEDSL · Greenville
- 2024 margin
- Strong R (+22.2) · D 38.0% · R 60.2% · Other 1.8%
- 2008→2024 swing
- +1.7pp toward D · 2008: -23.9pp · 2024: -22.2pp
- All cycles
- 2024: R+22.2 2020: R+18.2 2016: R+24.7 2012: R+27.8 2008: R+23.9
Not yet ingested
- Civics
- —
Market trends
- HPI YoY
- ▼ -139.58%
- Current HPI
- 264.2891
- Rent YoY
- ▲ 1.72%
- Metro
- Greenville-Anderson, SC
- State GDP YoY
- ▲ 4.51%
- F500 in state
- 2
Industry mix (Fortune 500 HQ in SC)
| Industry | F500 HQs | Revenue |
|---|---|---|
| Packaging | 1 | $7B |
|
||
Price history
+1447.6% since first listed14 events — show timeline
- 2026-05-18 Listing Removed — Greater Greenville MLS
- 2026-05-18 Listed $325,000 Greater Greenville MLS
- 2026-04-30 Contingent — Greater Greenville MLS
- 2026-04-21 Relisted — Greater Greenville MLS
- 2026-04-14 Contingent — Greater Greenville MLS
- 2026-03-25 Listed $330,000 Greater Greenville MLS
- 2025-09-09 Rental Removed $2,400 GGMLS
- 2025-08-10 Listed for Rent $2,400 GGMLS
- 2022-06-30 Sold (Public Records) $156,250 Public Records
- 2006-07-05 Listing Removed — Greater Greenville MLS
- 2006-05-19 Listed $28,800 Greater Greenville MLS
- 1985-07-26 Sold (Public Records) $30,950 Public Records
- 1985-02-25 Sold (Public Records) $16,000 Public Records
- 1979-12-01 Sold (Public Records) $21,000 Public Records
Property tax history
+4.4%/yrLatest (2025): $1,829 · +4.2% YoY. Source: county tax records.
Cash-flow waterfall
monthlySold comps — $/sqft
last 12 mo · ≤1 miLoading sold comps…