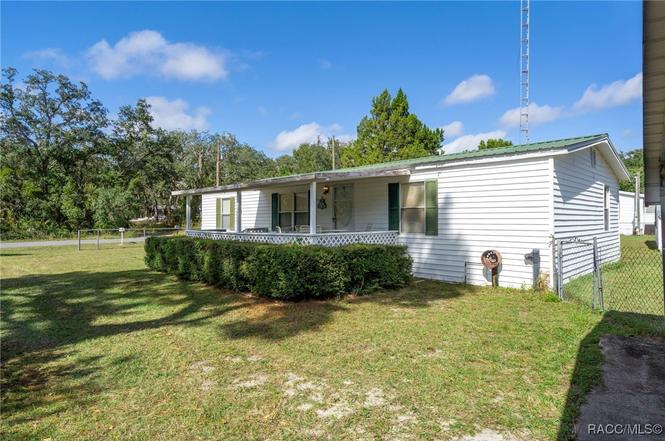
6780 W Linden Dr · Homosassa Springs, FL
Flood risk 8/10 · Major
- FEMA flood zone
- X (unshaded)
- Chance of flooding over 30 yrs
- 0.97%
- Est. flood insurance / yr
- $507 – $1,088
Fire risk 4/10 · Minor
- Est. fire insurance / yr
- $947 – $1,759
Heat risk 9/10 · Severe
- Hot days now (above 108°F)
- 7 days/yr
- Hot days in 30 yrs
- 25 days/yr
Wind risk 9/10 · Severe
- Chance of severe wind over 30 yrs
- 99.0%
Air-quality risk 1/10 · Minimal
- Unhealthy air days now
- 0 days/yr
- Unhealthy air days in 30 yrs
- 0 days/yr
Risk factors via First Street. Map © Google.
Why this score? — see what drove the B grade
The composite is a weighted blend of 9 inputs, each scored 0–100. Each bar is that input's sub-score; the figure is the points it added to the 100-point composite (weight × sub-score).
- Cash flow +30.0/30.0
- ARV discount +12.6/15.0
- DSCR +10.0/10.0
- 1% rule +9.3/10.0
- Schools +4.1/10.0
- Livability +3.6/5.0
- Rent growth +2.5/5.0
- Condition / age +2.5/5.0
- Appreciation +0.0/10.0
$139,000
🖨 Deal sheet (PDF) 📄 Offer letter ✓ Due diligence
Listing remarks MLS
Perfect for the full time or part time resident. Nicely maintained 3/2 doublewide with split bedroom plan, cathedral ceiling, walk-in closets, fenced yard for the children or pets, central heat and air, double carport, and 3 sheds for your yard equipment. Includes vinyl siding, newer metal roof, and roomy sitting porch to enjoy your day. Close to basic shopping and easy access to southern counties. Come see it before you miss out!
Key facts
- 0.23 acre lot
- Parking
- Built 1984
Property features AI
Exterior
- Parking: 1 parking space; Detached carport; Driveway; Paved and unpaved parking areas
- Utilities: Private well water; Septic tank
- Home design: Manufactured home (double wide); Residential property
- Construction: Metal roof
- Exterior features: Chain link partial fencing; Level lot; Paved road access
Interior
- Kitchen: Electric oven; Electric range; Refrigerator
- Flooring: Carpet; Linoleum
- Bathrooms: 2 full bathrooms
- Heating & cooling: Central heating (electric); Central air conditioning
- Interior features: Laminate counters; Walk-in closet(s)
- Laundry & utility: Washer; Dryer
Neighborhood map
What this means for you Summary
Snapshot
- This is a 3-bed/2.0-bath manufactured listed at $139k.
Deal economics
- At list price, monthly cash flow is $611 ($7k/yr) — positive.
- The deal already cash-flows at list — no discount required.
- Meets the 1% rule at list price ($2k rent vs $139k).
- Recommended offer: $122k (12.0% below list) — sets the bar for market timing.
- Cap rate 12.1% vs local median 5.9% in Homosassa Springs — top-decile yield for the area; either an underpriced asset or a hidden risk that comps aren't pricing in. Stress-test before assuming the spread holds.
Location & tenants
- Location reads 71/100 on livability (#391 in FL) — a middle-class / working-renter tenant base. Strengths: cost of living A+, housing A+, health & safety A+; Watch: crime C-, amenities F, commute F.
- Citrus (rural): math 49% / reading 50% proficiency, ranked #44 of 73 in FL (top 60%) — families likely to look elsewhere, expect single-tenant / working-renter base with shorter leases.
- Zoned schools: Homosassa Elementary School (math 62% / reading 47%, grade C, #892 of 2,144 statewide, top 44%, 411 students, 78% FRL); Lecanto Middle School (math 49% / reading 49%, grade C-, #265 of 571 statewide, top 48%, 809 students, 55% FRL); Lecanto High School (math 46% / reading 53%, grade D, #179 of 667 statewide, top 29%, 1,630 students, 46% FRL) — zoned schools at 60% FRL track the district average.
- Market conditions: 311 active listings in the ZIP; 3 comparable units currently listed for rent nearby; rentals at typical pace (median 23d on market — plan ~3-4 weeks tenant-placement turnaround); 2,443 units permitted in Citrus County in 2024 (0 in 5+ unit buildings).
Forward outlook
- Local home prices are declining (-3.0%/yr); year-one equity from $961 of loan paydown is wiped out by about $4k of value loss. Plan a longer hold.
- Citrus County population projected to shrink 10% by 2050 — rents likely to lag national; underwrite the cash flow, not the appreciation.
- At projected returns (-3.0% appreciation + 3.0% rent growth), your $39k cash investment doubles in ~7 years — after that, you're playing with house money.
Negotiation context
- It's been on market 149 days — a 12% lower offer ($122k) is reasonable based on typical stale-listing flexibility.
- 3 sale attempts since 13y ago; this cycle's ask has dropped $20k (13%) from the opening price — seller is motivated, your offer sets the floor, not the list.
- Current owner paid $33k; list at $139k implies a 317% gain — meaningful room to come down on a strong offer.
Risks & watch-outs
- Watch-outs: flood insurance adds $66/mo.
- Climate carrying-cost: severe flood risk; severe wind risk, 99% chance of damaging wind over 30y; extreme-heat days projected 7→25/yr by 2055 (HVAC capex compounding) — expect insurance premiums to compound above CPI over the hold.
Questions for the listing agent
- It's been on market 149 days. Have you received any prior offers? Is the seller open to a 12% concession, seller financing, or rate buy-down credit?
- What's the actual annual flood-insurance premium (NFIP or private), and is the property in a SFHA with mandatory coverage?
- Why hasn't it sold? Are there any deal-killer items the seller is aware of (foundation, flood, title, zoning, code violations)?
- Is there a deadline driving the sale (1031 exchange, divorce, estate, relocation)? That informs how much negotiation room exists.
- Schools are F-rated, which usually means shorter tenancies and higher turnover. Who's the typical renter profile here, and what's been the actual vacancy rate?
- What's the average days-on-market for RENTAL listings here right now (not sales)? A rising rental-DOM trend means longer vacancies and softer asking-rent achievability than the comps imply.
- What's the recent tenant-quality profile in this submarket — average credit score on applications, eviction rate, late-payment / NSF rate, and stable-employment percentage? A property-management company in the area should have these aggregated.
- How much new for-sale + rental construction is in the pipeline within 1–3 miles? Heavy new supply typically softens prices + rents 12–24 months out; constrained supply supports both.
Investment metrics
- 1% rule
- 1.43% ✓
- Cap rate
- 12.14%
- Cash-on-cash
- 20.89%
- DSCR
- 1.93
- GRM
- 5.8
CMA / ARV
- ARV (on-the-fly)
- $156,672
- Comps found
- 8
Show comp detail 8 sales within ~0.75 mi
| Address | Dist | Beds/Ba | Sqft | Sold | Price | $/sf | Match |
|---|---|---|---|---|---|---|---|
| 6780 W Linden Dr | 0.00mi | 3/2.0 | 1,152 (0%) | 0mo | $133,000 | $115 | 100 |
| 7230 S Sonata Ave | 0.52mi | 3/2.0 | 1,152 (0%) | 16mo | $115,000 | $100 | 62 |
| 6542 W Akazian Ln | 0.34mi | 3/2.0 | 1,296 (+12%) | 7mo | $176,500 | $136 | 57 |
| 7080 S Sesame Street Ter | 0.38mi | 2/1.0 (-1) | 1,086 (-6%) | 8mo | $132,500 | $122 | 57 |
| 7132 S Sesame Street Ter | 0.43mi | 2/2.0 (-1) | 1,116 (-3%) | 16mo | $179,000 | $160 | 57 |
| 7370 S Sorrell Ave | 0.70mi | 2/1.5 (-1) | 1,178 (+2%) | 9mo | $160,000 | $136 | 49 |
| 6801 W Appian St | 0.70mi | 3/2.0 | 1,080 (-6%) | 10mo | $157,500 | $146 | 49 |
| 6641 W Appian St | 0.71mi | 3/2.0 | 1,104 (-4%) | 17mo | $160,000 | $145 | 46 |
Match score weights: distance 35% · size 25% · config 20% · recency 20%. Top-matched comps best support the ARV.
Projected returns pro-forma
-3.0% appreciation · 3.0% rent growth · sell at horizon
- IRR
- 10.7%
- Equity multiple
- 1.42×
- Total profit
- $16,421
- Equity at exit
- $20,725
- IRR
- 19.7%
- Equity multiple
- 2.66×
- Total profit
- $64,528
- Equity at exit
- $12,018
Cash invested: $38,920 (down + closing). Projections, not guarantees.
Landlord ↔ Tenant lean methodology
- Overall (STATE)
- 87 Strongly Landlord-Friendly
- State Florida
- 87 Strongly Landlord-Friendly · R+3
- County
- — inherits STATE
- City
- — inherits STATE
ZIP-level market 34448
- Home prices YoY
- -26.1%
- Active inventory
- 311
- Price-to-rent
- 5.8×
Monthly cashflow live
- Estimated rent
- $1,987 medium interval (Pro) →
- Mortgage (P&I)
- −$729
- Tax from tax record
- −$106 /mo · $1,267/yr
- Insurance
- −$58
- Flood insurance flood zone
- −$66 /mo · $798/yr
- HOA
- −$0
- Vacancy / Maint / Mgmt
- −$417
- Net cashflow
- $611
Break-even live
Sensitivity live
| Price | -10% $690 | -5% $650 | +0% $611 | +5% $572 | +10% $532 |
|---|---|---|---|---|---|
| Rent | -10% $454 | -5% $533 | +0% $611 | +5% $690 | +10% $768 |
| Rate | -1.0pp $681 | -0.5pp $646 | base $611 | +0.5pp $575 | +1.0pp $538 |
UW: 25.0% down · 7.5% · 30yr · 1.5% tax · 5.0% vac · 8.0% maint · 8.0% mgmt
Financing live
Cash to close
- Down payment
- $34,750
- Closing costs
- $4,170
- Reserves months
- —
- Total cash needed
- —
Loan-product check · same deal, 3 products live
Conventional
25% down · 7.5% · 30yr
- Down + closing
- —
- Monthly P&I
- —
- Monthly cashflow
- —
- DSCR
- —
- Eligible?
- —
Personal DTI + credit; lowest rate.
DSCR
20% down · 8.5% · 30yr
- Down + closing
- —
- Monthly P&I
- —
- Monthly cashflow
- —
- DSCR
- —
- Eligible?
- —
No personal income docs; deal must DSCR.
Hard money
10% down · 12.0% · 12mo
- Down + closing
- —
- Monthly P&I
- —
- Monthly cashflow
- —
- DSCR
- —
- Eligible?
- —
Short-term bridge; refi at stabilization.
Rent comps 3 comps
| Address | Beds | Baths | Sqft | Rent | $/sqft | DOM | Units | Dist |
|---|---|---|---|---|---|---|---|---|
| 23 Dogwood Dr Homosassa, FL | 2.0 | 2.0 | 1492 | $2,200 | $1.47 | 23d | 1 | 1.38mi |
| 17 Dogwood Dr Homosassa, FL | 2.0 | 2.0 | 1400 | $1,600 | $1.14 | 23d | 1 | 1.40mi |
| 5900 S Oakridge Dr Homosassa, FL | 2.0 | 2.0 | 1050 | $1,575 | $1.50 | 23d | 1 | 1.44mi |
Listing history 9 events
-
2026-05-05status Pending
-
2026-04-16price $139,000
-
2026-03-27price $149,000
-
2026-03-12status Active
-
2026-02-03status Pending
-
2025-10-30$159,000 Active
-
2013-05-15soldstatus $33,300 434-char remark
Show marketing remark (434 chars)
Perfect for the full time or part time resident. Nicely maintained 3/2 doublewide with split bedroom plan, cathedral ceiling, walk-in closets, fenced yard for the children or pets, central heat and air, double carport, and 3 sheds for your yard equipment. Includes vinyl siding, newer metal roof, and roomy sitting porch to enjoy your day. Close to basic shopping and easy access to southern counties. Come see it before you miss out!
-
2013-02-01$37,500 434-char remark
Show marketing remark (434 chars)
Perfect for the full time or part time resident. Nicely maintained 3/2 doublewide with split bedroom plan, cathedral ceiling, walk-in closets, fenced yard for the children or pets, central heat and air, double carport, and 3 sheds for your yard equipment. Includes vinyl siding, newer metal roof, and roomy sitting porch to enjoy your day. Close to basic shopping and easy access to southern counties. Come see it before you miss out!
-
2000-01-01soldstatus $7,000
ⓘ Source: listings_history table (triggers on properties + properties_extension) + one-shot
backfill from property_details.listing_events for pre-trigger history.
Tax reassessment forecast FL · Resets to sale price
- Current annual tax
- $1,267 · $106/mo
- Projected year-2 tax
- $1,267 · $106/mo
- Expected delta
- $0/yr ($0/mo · 0.0%)
ⓘ Screening estimate from a state-policy table — verify with the county assessor before closing.
Climate risk First Street
- Flood 8/10 Severe FEMA zone X (unshaded) · 97% chance over 30 yrs
- Wildfire 4/10 Moderate
- Heat 9/10 Extreme 7 d/yr ≥108°F today · 25 d/yr by 30 yrs out
- Wind 9/10 Extreme 99% chance of damaging wind over 30 yrs
- Air quality 1/10 Low 0 unhealthy d/yr today · 0 by 30 yrs out
Nearby sold comps map
Loading sold comps map…
Walkable amenities ~0.75 mi
Loading nearby amenities…
Taxation est. · year 1
- Rental income
- $23,847
- − Mortgage interest
- −$7,786
- − Property taxes
- −$1,267
- − Insurance
- −$1,492
- − Repairs & maintenance
- −$1,908
- − Management
- −$1,908
- − Depreciation
- −$4,044
- Taxable income
- $5,442
- Est. tax owed @ 24.0%
- −$1,306
- After-tax cash flow
- $6,026/yr
For passive investors: Depreciation is non-cash, so a rental often shows a tax loss while cash-flowing — sheltering income. Rental losses are passive: they offset passive income freely, and up to $25,000/yr can offset ordinary (W-2) income if you actively participate and your MAGI is under $100k (phasing out to $0 by $150k); unused losses carry forward. On sale, claimed depreciation is recaptured at up to 25%, and gains may owe capital-gains tax (a 1031 exchange can defer both). Figures are a year-1 estimate at your 24.0% rate — not tax advice; consult a CPA.
Schools (NCES district)
- District
- Citrus
- NCES district ID
- 1200270
- Math proficiency
- 49% ▼ -10.00%
- Reading proficiency
- 50% ▼ -6.00%
- Median HH income
- $38,618
- Composite
- 41.28/100
- National rank
- #3519
- State rank
- #44 of 73 in FL
Livability — Homosassa Springs
- Score
- 71/100
- State rank
- #391
- US rank
- #6877
Category grades
Schools grade is shown separately in the Schools card above.
Census & demographics
- Census place
- Homosassa Springs, FL
- County
- Citrus County · 111,314 people
- Metro
- Homosassa Springs, FL
- Population (ZIP)
- 10,817
- Household income
- $45,916
- Rent vs Own
- Severe rent burden
- 113.0
Population outlook (Citrus County) Hauer SSP2
- Today (2025)
- 138,622 people
- By 2030
- 136,886 · -1.3%
- By 2040
- 132,009 · -4.8%
- By 2050
- 125,196 · -9.7%
- By 2075
- 108,570 · -21.7%
- By 2100
- 84,454 · -39.1%
Race, ethnicity, and origin ACS 2023
- Neighborhood character
- Predominantly White (94%)
- Race & ethnicity
- White 94% Two or more races 3% Hispanic / Latino 3% Black 1%
- Common ancestry
- Slovak 3% Scotch-Irish 2% Lithuanian 2%
- Foreign-born
- 2% · Canada
- Languages at home
- 96% English-only · Spanish 2% Russian/Polish/Slavic 1%
Political lean MEDSL · Citrus
- 2024 margin
- Solid R (+45.9) · D 26.8% · R 72.6%
- 2008→2024 swing
- -29.8pp toward R · 2008: -16.1pp · 2024: -45.9pp
- All cycles
- 2024: R+45.9 2020: R+41.0 2016: R+39.7 2012: R+21.9 2008: R+16.1
Not yet ingested
- Civics
- —
Market trends
- HPI YoY
- ▼ -110.27%
- Current HPI
- 312.4302
- Rent YoY
- —
- Metro
- Homosassa Springs, FL
- State GDP YoY
- ▲ 3.28%
- F500 in state
- 36
Industry mix (Fortune 500 HQ in FL)
| Industry | F500 HQs | Revenue |
|---|---|---|
| Industrial Technology | 2 | $29B |
|
||
| Insurance | 2 | $17B |
|
||
| Retail | 1 | $60B |
|
||
| Technology Distribution | 1 | $58B |
|
||
| Homebuilding | 1 | $35B |
|
||
| Technology Manufacturing | 1 | $35B |
|
||
Price history
+1885.7% since first listed9 events — show timeline
- 2026-05-05 Pending — RACC
- 2026-04-16 Price Changed $139,000 RACC
- 2026-03-27 Price Changed $149,000 RACC
- 2026-03-12 Relisted — RACC
- 2026-02-03 Pending — RACC
- 2025-10-30 Listed $159,000 RACC
- 2013-05-15 Sold (MLS) $33,300 RACC
- 2013-02-01 Listed $37,500 RACC
- 2000-01-01 Sold (Public Records) $7,000 Public Records
Property tax history
+7.9%/yrLatest (2025): $1,267 · +9.4% YoY. Source: county tax records.
Cash-flow waterfall
monthlySold comps — $/sqft
last 12 mo · ≤1 miLoading sold comps…