 Triplex
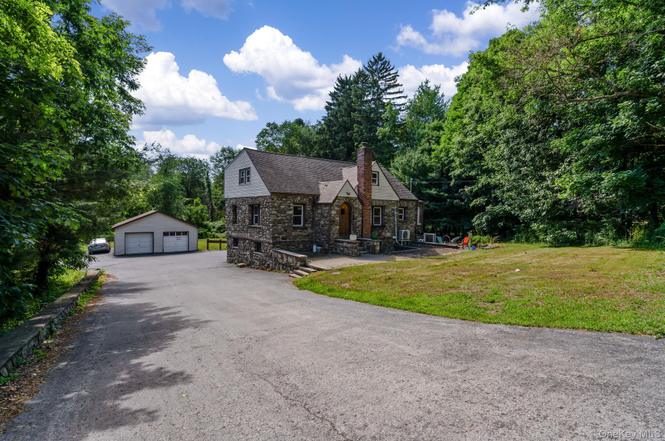
491 State Route 32 · Gardnertown, NY
Flood risk 1/10 · Minimal
- FEMA flood zone
- X (unshaded)
- Chance of flooding over 30 yrs
- 0.0%
- Est. flood insurance / yr
- $473 – $860
Fire risk 3/10 · Minor
- Est. fire insurance / yr
- $691 – $1,283
Heat risk 4/10 · Minor
- Hot days now (above 97°F)
- 7 days/yr
- Hot days in 30 yrs
- 15 days/yr
Wind risk 4/10 · Minor
- Chance of severe wind over 30 yrs
- 14.0%
Air-quality risk 2/10 · Minimal
- Unhealthy air days now
- 1 days/yr
- Unhealthy air days in 30 yrs
- 2 days/yr
Risk factors via First Street. Map © Google.
Why this score? — see what drove the B+ grade
The composite is a weighted blend of 9 inputs, each scored 0–100. Each bar is that input's sub-score; the figure is the points it added to the 100-point composite (weight × sub-score).
- Cash flow +30.0/30.0
- DSCR +10.0/10.0
- Appreciation +10.0/10.0
- 1% rule +8.3/10.0
- ARV discount +7.5/15.0
- Schools +4.9/10.0
- Livability +3.4/5.0
- Rent growth +2.5/5.0
- Condition / age +2.5/5.0
$575,000
🖨 Deal sheet 📄 Offer letter ✓ Due diligence
Multi-family units
County records classify this as Multi-Family (2-4 Unit). Listing-text estimate: 3 units. confirmed
Listing remarks
Investor's Dream! Fully occupied 3-family property situated on a beautiful 2.5-acre lot in the Wallkill School District. This income-producing property offers immediate cash flow with three occupied units and additional rental income potential from the detached garage. Set well back from the road, the property features a sprawling yard, ample green space, and an oversized driveway providing abundant parking for tenants and visitors. The combination of strong rental income, multiple revenue streams, and a picturesque setting makes this a rare opportunity for both seasoned and first-time investors. Conveniently located near major commuter routes, shopping, dining, and recreation while still o
Key facts
- Sprawling yard
- 2.5 acre lot
- Ample green space
Tags
Property features AI
Finance
- Other: - Building area approximately 2761 total square feet
- Financial info: - (No investor-specific financial details provided)
- HOA & community: - (No HOA details provided)
Exterior
- Parking: - Driveway; - 2-car garage
- Security: - (No security details provided)
- Utilities: - Septic tank; - Electricity connected
- Home design: - Triplex property
- Construction: - Frame and stone construction
- Exterior features: - Frame and stone construction; - Not waterfront
Interior
- Kitchen: - (No specific kitchen appliance details provided)
- Bedrooms: - Two 1-bedroom units and one 2-bedroom unit (triplex configuration)
- Flooring: - (No flooring details provided)
- Bathrooms: - Three full bathrooms
- Heating & cooling: - Electric heating; - Ductless cooling; - Other heating type
- Interior features: - Finished basement; - Other interior features
- Laundry & utility: - Common area laundry; - Laundry room; - Laundry in basement
Neighborhood map
What this means for you Summary
Snapshot
- This is a 3 × 4-bed/3.0-bath units multifamily listed at $575k.
Deal economics
- At list price, monthly cash flow is $2k ($26k/yr) — positive. Per door: $734/mo.
- The deal already cash-flows at list — no discount required.
- Meets the 1% rule at list price ($8k rent vs $575k).
- Cap rate 10.9% vs local median 3.4% in Gardnertown — top-decile yield for the area; either an underpriced asset or a hidden risk that comps aren't pricing in. Stress-test before assuming the spread holds.
Location & tenants
- Location reads 68/100 on livability (#522 in NY) — a middle-class / working-renter tenant base. Strengths: employment A+, housing A+, health & safety A; Watch: cost of living D, amenities F, commute F.
- Wallkill Central School District (suburban): math 54% / reading 56% proficiency, ranked #279 of 590 in NY (top 47%) — acceptable for families but not a draw, mixed tenant base, ~2y average lease.
- Zoned schools: Leptondale Elementary School (math 32% / reading 57%, grade F, #1,277 of 2,108 statewide, top 64%, 464 students, 28% FRL); John G Borden Middle School (math 32% / reading 47%, grade F, #418 of 729 statewide, top 59%, 432 students, 37% FRL); Wallkill Senior High School (math 97% / reading 75%, grade A, #347 of 1,100 statewide, top 32%, 1,004 students, 34% FRL).
- Market conditions: 100 active listings in the ZIP; 1,746 units permitted in Orange County in 2024 (1,265 in 5+ unit buildings).
Forward outlook
- In year one you build about $61k of equity ($4k loan paydown + $58k appreciation (10.0% local appreciation)).
- At projected returns (10.0% appreciation + 3.0% rent growth), your $161k cash investment doubles in ~2 years — after that, you're playing with house money.
- By year 2, paydown + projected appreciation supports a ~$99k cash-out refi (75% LTV) — recoverable capital for the next deal without selling this one.
Negotiation context
- Only 1 days on market — expect competitive offers; lowballing is unlikely to land.
- 3 sale attempts since 12y ago with the ask held roughly flat each time — persistent listings suggest the price (not the market) is what's stuck; bring a comps-based counter.
- Current owner paid $425k; 35% above their basis — modest negotiation headroom, anchor on the comps not their cost.
Risks & watch-outs
- Watch-outs: built in 1940 — expect roof / HVAC / electrical / plumbing capex.
Questions for the listing agent
- Can we see the unit-by-unit rent roll, current vacancy, and any below-market leases? What's the average tenancy length?
- What capital expenditures (roof, boiler, parking lot, exteriors) have been made in the last 5 years, and what's planned in the next 2?
- Built in 1940 — when were the roof, HVAC, electrical panel, plumbing, and water heater last replaced?
- Is there a deadline driving the sale (1031 exchange, divorce, estate, relocation)? That informs how much negotiation room exists.
- Schools are D-rated, which usually means shorter tenancies and higher turnover. Who's the typical renter profile here, and what's been the actual vacancy rate?
- What's the average days-on-market for RENTAL listings here right now (not sales)? A rising rental-DOM trend means longer vacancies and softer asking-rent achievability than the comps imply.
- What's the recent tenant-quality profile in this submarket — average credit score on applications, eviction rate, late-payment / NSF rate, and stable-employment percentage? A property-management company in the area should have these aggregated.
- How much new apartment / multifamily construction is in the pipeline within 1–3 miles? Heavy new supply (>2% of stock underway) typically softens rents 12–24 months out; light construction supports rent growth.
Investment metrics
- 1% rule
- 1.33% ✓
- Cap rate
- 10.89%
- Cash-on-cash
- 16.42%
- DSCR
- 1.73
- GRM
- 6.3
CMA / ARV
No comps found within radius.
Projected returns pro-forma
10.0% appreciation · 3.0% rent growth · sell at horizon
- IRR
- 36.4%
- Equity multiple
- 3.82×
- Total profit
- $453,478
- Equity at exit
- $518,006
- IRR
- 31.4%
- Equity multiple
- 8.61×
- Total profit
- $1,225,167
- Equity at exit
- $1,117,099
Cash invested: $161,000 (down + closing). Projections, not guarantees.
Landlord ↔ Tenant lean methodology
- Overall (STATE)
- 15 Strongly Tenant-Friendly
- State New York
- 15 Strongly Tenant-Friendly · D+10
- County
- — inherits STATE
- City
- — inherits STATE
ZIP-level market 12589
- Home prices YoY
- 5.2%
- Active inventory
- 100
- Price-to-rent
- 18.8×
Monthly cashflow live
- Estimated rent
- $7,650 medium interval (Pro) →
- Mortgage (P&I)
- −$3,015
- Tax from tax record
- −$586 /mo · $7,032/yr
- Insurance
- −$240
- HOA
- −$0
- Vacancy / Maint / Mgmt
- −$1,606
- Net cashflow
- $2,203
Break-even live
3-unit breakdown (identical units grouped — click to expand)
| Units | Beds | Baths | Est. rent |
|---|---|---|---|
| 3× units | 4 | 3 | $7,650 |
| #1 | 4 | 3 | $2,550 |
| #2 | 4 | 3 | $2,550 |
| #3 | 4 | 3 | $2,550 |
| Total (3 units) | $7,650 | ||
UW: 25.0% down · 7.5% · 30yr · 1.5% tax · 5.0% vac · 8.0% maint · 8.0% mgmt
Financing live
Cash to close
- Down payment
- $143,750
- Closing costs
- $17,250
- Reserves months
- —
- Total cash needed
- —
Loan-product check · same deal, 3 products live
Conventional
25% down · 7.5% · 30yr
- Down + closing
- —
- Monthly P&I
- —
- Monthly cashflow
- —
- DSCR
- —
- Eligible?
- —
Personal DTI + credit; lowest rate.
DSCR
20% down · 8.5% · 30yr
- Down + closing
- —
- Monthly P&I
- —
- Monthly cashflow
- —
- DSCR
- —
- Eligible?
- —
No personal income docs; deal must DSCR.
Hard money
10% down · 12.0% · 12mo
- Down + closing
- —
- Monthly P&I
- —
- Monthly cashflow
- —
- DSCR
- —
- Eligible?
- —
Short-term bridge; refi at stabilization.
Listing history 2 events
-
2026-06-18remarks 699-char remark
-
2026-06-18$575,000 Active 1 DOM
ⓘ Source: listings_history table (triggers on properties + properties_extension) + one-shot
backfill from property_details.listing_events for pre-trigger history.
Tax reassessment forecast NY · Partial reset (capped growth)
- Current annual tax
- $7,032 · $586/mo
- Projected year-2 tax
- $8,375 · $698/mo
- Expected delta
- +$1,343/yr (+$112/mo · 19.1%)
ⓘ Screening estimate from a state-policy table — verify with the county assessor before closing.
Climate risk First Street
- Flood 1/10 Low FEMA zone X (unshaded) · 0% chance over 30 yrs
- Wildfire 3/10 Moderate
- Heat 4/10 Moderate 7 d/yr ≥97°F today · 15 d/yr by 30 yrs out
- Wind 4/10 Moderate 14% chance of damaging wind over 30 yrs
- Air quality 2/10 Low 1 unhealthy d/yr today · 2 by 30 yrs out
Nearby sold comps map
Loading sold comps map…
Walkable amenities ~0.75 mi
Loading nearby amenities…
Taxation est. · year 1
- Rental income
- $91,800
- − Mortgage interest
- −$32,209
- − Property taxes
- −$7,032
- − Insurance
- −$2,875
- − Repairs & maintenance
- −$7,344
- − Management
- −$7,344
- − Depreciation
- −$16,727
- Taxable income
- $18,269
- Est. tax owed @ 24.0%
- −$4,385
- After-tax cash flow
- $22,046/yr
For passive investors: Depreciation is non-cash, so a rental often shows a tax loss while cash-flowing — sheltering income. Rental losses are passive: they offset passive income freely, and up to $25,000/yr can offset ordinary (W-2) income if you actively participate and your MAGI is under $100k (phasing out to $0 by $150k); unused losses carry forward. On sale, claimed depreciation is recaptured at up to 25%, and gains may owe capital-gains tax (a 1031 exchange can defer both). Figures are a year-1 estimate at your 24.0% rate — not tax advice; consult a CPA.
Schools (NCES district)
- District
- Wallkill Central School District
- NCES district ID
- 3629790
- Math proficiency
- 54% ▼ -7.00%
- Reading proficiency
- 56% ▲ 2.00%
- Median HH income
- $72,323
- Composite
- 49.06/100
- National rank
- #2057
- State rank
- #279 of 590 in NY
Livability — Gardnertown
- Score
- 68/100
- State rank
- #522
- US rank
- #9236
Category grades
Schools grade is shown separately in the Schools card above.
Census & demographics
- City population
- 54,996
- Population (ZIP)
- 19,639
Population outlook (Orange County) Hauer SSP2
- Today (2025)
- 379,830 people
- By 2030
- 378,955 · -0.2%
- By 2040
- 375,444 · -1.2%
- By 2050
- 369,311 · -2.8%
- By 2075
- 354,233 · -6.7%
- By 2100
- 318,150 · -16.2%
Race, ethnicity, and origin ACS 2023
- Neighborhood character
- Diverse neighborhood (Simpson 0.55)
- Race & ethnicity
- White 63% Hispanic / Latino 20% Two or more races 13% Black 9%
- Hispanic origin (detail)
- Mexican 4% Puerto Rican 8% Dominican 1%
- Common ancestry
- Romanian 3% Lithuanian 1% Slovak 1%
- Foreign-born
- 8% · Canada
- Languages at home
- 81% English-only · Spanish 15% Other Indo-European 2%
Political lean MEDSL · Orange
- 2024 margin
- Lean R (+8.4) · D 45.8% · R 54.2%
- 2008→2024 swing
- -12.5pp toward R · 2008: 4.1pp · 2024: -8.4pp
- All cycles
- 2024: R+8.4 2020: R+0.2 2016: R+6.5 2012: D+5.2 2008: D+4.1
Not yet ingested
- Civics
- —
Market trends
- HPI YoY
- ▲ 15.97%
- Current HPI
- 323.1502
- Rent YoY
- —
- Metro
- —
- State GDP YoY
- ▲ 2.60%
- F500 in state
- 92
Industry mix (Fortune 500 HQ in NY)
| Industry | F500 HQs | Revenue |
|---|---|---|
| Financial Services | 10 | $950B |
|
||
| Consumer Goods | 9 | $162B |
|
||
| Insurance | 4 | $225B |
|
||
| Telecommunications | 2 | $144B |
|
||
| Pharmaceuticals | 2 | $112B |
|
||
| Media / Entertainment | 2 | $69B |
|
||
Price history
+64.3% since first listed8 events — show timeline
- 2026-06-18 Listed $575,000 OneKey® MLS as Distributed by MLS Grid
- 2021-09-08 Sold (Public Records) $425,000 Public Records
- 2015-06-26 Delisted — HGMLS
- 2015-06-25 Listing Removed — OneKey® MLS as Distributed by MLS Grid
- 2015-02-09 Price Changed — HGMLS
- 2015-01-16 Price Changed — HGMLS
- 2014-09-25 Listed — HGMLS
- 2014-09-25 Listed $350,000 OneKey® MLS as Distributed by MLS Grid
Property tax history
+1.3%/yrLatest (2025): $7,032 · +8.7% YoY. Source: county tax records.
Cash-flow waterfall
monthlySold comps — $/sqft
last 12 mo · ≤1 miLoading sold comps…