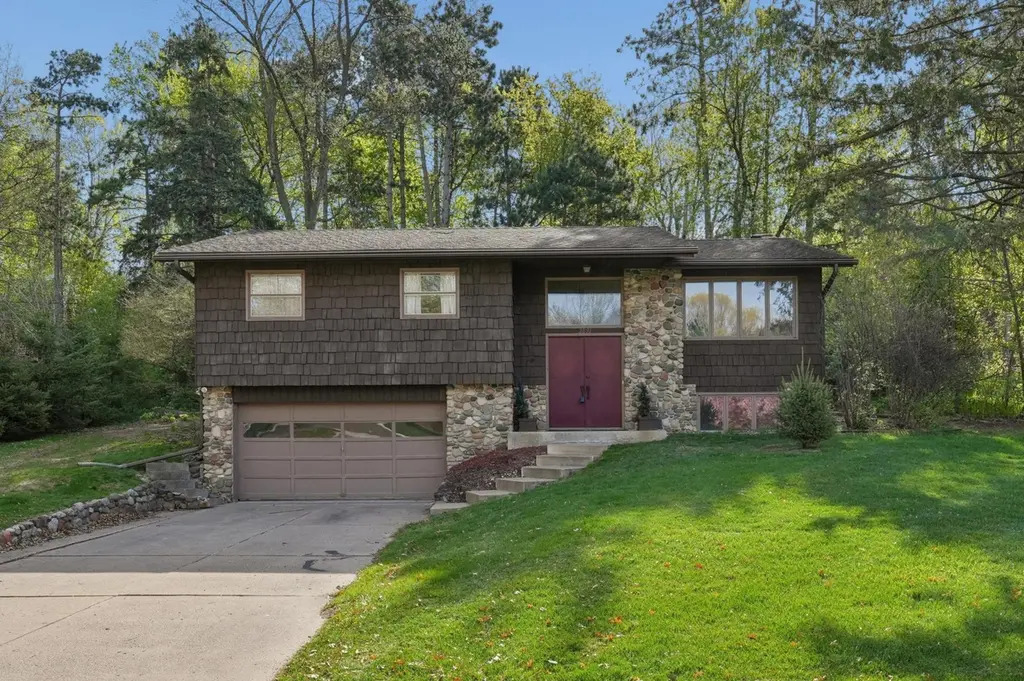
2891 Legion Ave N · Lake Elmo, MN
Flood risk 1/10 · Minimal
- FEMA flood zone
- X (unshaded)
- Chance of flooding over 30 yrs
- 0.0%
- Est. flood insurance / yr
- $473 – $860
Fire risk 1/10 · Minimal
- Est. fire insurance / yr
- $888 – $1,650
Heat risk 2/10 · Minimal
- Hot days now (above 101°F)
- 7 days/yr
- Hot days in 30 yrs
- 14 days/yr
Wind risk 2/10 · Minimal
- Chance of severe wind over 30 yrs
- —
Air-quality risk 3/10 · Minor
- Unhealthy air days now
- 3 days/yr
- Unhealthy air days in 30 yrs
- 3 days/yr
Risk factors via First Street. Map © Google.
Why this score? — see what drove the C- grade
The composite is a weighted blend of 9 inputs, each scored 0–100. Each bar is that input's sub-score; the figure is the points it added to the 100-point composite (weight × sub-score).
- Cash flow +18.3/30.0
- ARV discount +10.4/15.0
- DSCR +5.8/10.0
- Schools +5.0/10.0
- 1% rule +4.7/10.0
- Livability +3.6/5.0
- Rent growth +2.5/5.0
- Condition / age +2.5/5.0
- Appreciation +0.0/10.0
$399,900
🖨 Deal sheet (PDF) 📄 Offer letter ✓ Due diligence
Key facts
- 0.37 acre lot
- 2 garage spots
- Built 1969
Property features AI
Finance
- Other: Property listed as non-fractional ownership
- Financial info: FHA mortgage type noted
Exterior
- Parking: Attached tuck-under garage; 2-car garage (18 x 20)
- Utilities: City water (connected); City sewer (connected); Natural gas; Xcel Energy power
- Home design: Residential property; Split entry (bi-level) layout; Three-season porch
- Construction: Foundation area: 1,122 (finished area noted); Above-grade finished area and total above-grade area listed; Below-grade finished area listed
- Exterior features: Enclosed/Screened rear porch; Stone exterior; Tree coverage - medium
Interior
- Kitchen: Range; Refrigerator; Dishwasher
- Bedrooms: 3 bedrooms (all on the upper level); Additional flex room on lower level
- Flooring: Hardwood floors
- Bathrooms: One full bathroom on the upper level; One 3/4 bathroom in the basement
- Heating & cooling: Boiler heating; Central air conditioning
- Interior features: Finished and partially finished basement; Three-season porch; Informal dining area / living-dining room layout; Vaulted ceilings; Hardwood floors; Wood-burning fireplace in the family room
- Laundry & utility: Washer and dryer; Laundry located in basement (laundry closet)
Neighborhood map
What this means for you Summary
Snapshot
- This is a 3-bed/2.0-bath single-family listed at $400k.
Deal economics
- At list price, monthly cash flow is $369 ($4k/yr) — positive.
- The deal already cash-flows at list — no discount required.
- To meet the 1% rule (rent ≥ 1% of price), the offer needs to be $389k (2.7% below list).
- Recommended offer: $388k (3.0% below list) — sets the bar for market timing.
- Cap rate 7.4% vs local median 2.7% in Lake Elmo — top-decile yield for the area; either an underpriced asset or a hidden risk that comps aren't pricing in. Stress-test before assuming the spread holds.
Location & tenants
- Location reads 72/100 on livability (#271 in MN) — a middle-class / working-renter tenant base. Strengths: crime A+, commute A+, employment A+; Watch: amenities F, cost of living F, health & safety F.
- Stillwater Area Public School District (suburban): math 53% / reading 56% proficiency, ranked #54 of 301 in MN (top 18%) — acceptable for families but not a draw, mixed tenant base, ~2y average lease; only 12% free/reduced lunch — higher-income household profile.
- Market conditions: 135 active listings in the ZIP; 3 comparable units currently listed for rent nearby; rentals lingering (median 44d on market — plan ~5-8 weeks vacancy on turnover, expect pricing pressure); 67% of comp listings sitting > 30 days — soft ceiling on asking rent; 1,405 units permitted in Washington County in 2024 (121 in 5+ unit buildings).
Forward outlook
- Local home prices are declining (-3.0%/yr); year-one equity from $3k of loan paydown is wiped out by about $12k of value loss. Plan a longer hold.
- Washington County population projected at +16% by 2050 — long-run rental-demand tailwind backs the buy-and-hold thesis.
Negotiation context
- It's been on market 49 days — a 3% lower offer ($388k) is reasonable based on typical stale-listing flexibility.
- Current owner paid $103k; list at $400k implies a 288% gain — meaningful room to come down on a strong offer.
Questions for the listing agent
- It's been on market 49 days. Have you received any prior offers? Is the seller open to a 3% concession, seller financing, or rate buy-down credit?
- Built in 1969 — when were the roof, HVAC, electrical panel, plumbing, and water heater last replaced?
- Is there a deadline driving the sale (1031 exchange, divorce, estate, relocation)? That informs how much negotiation room exists.
- What's the average days-on-market for RENTAL listings here right now (not sales)? A rising rental-DOM trend means longer vacancies and softer asking-rent achievability than the comps imply.
- What's the recent tenant-quality profile in this submarket — average credit score on applications, eviction rate, late-payment / NSF rate, and stable-employment percentage? A property-management company in the area should have these aggregated.
- How much new for-sale + rental construction is in the pipeline within 1–3 miles? Heavy new supply typically softens prices + rents 12–24 months out; constrained supply supports both.
Investment metrics
- 1% rule
- 0.97% ✗
- Cap rate
- 7.40%
- Cash-on-cash
- 3.96%
- DSCR
- 1.18
- GRM
- 8.6
CMA / ARV
- ARV (median comp)
- $427,067
- List price
- $399,900
- Delta
- -6.36%
- Verdict
- FAIR
- Comps
- 2 within 1.0 mi
Show comp detail 1 sale within ~0.75 mi
| Address | Dist | Beds/Ba | Sqft | Sold | Price | $/sf | Match |
|---|---|---|---|---|---|---|---|
| 11120 32nd St N | 0.53mi | 3/3.0 | 1,688 (-6%) | 21mo | $300,000 | $178 | 44 |
Match score weights: distance 35% · size 25% · config 20% · recency 20%. Top-matched comps best support the ARV.
Projected returns pro-forma
-3.0% appreciation · 3.0% rent growth · sell at horizon
- IRR
- -10.1%
- Equity multiple
- 0.63×
- Total profit
- $-41,258
- Equity at exit
- $59,626
- IRR
- -0.7%
- Equity multiple
- 0.95×
- Total profit
- $-5,546
- Equity at exit
- $34,576
Cash invested: $111,972 (down + closing). Projections, not guarantees.
Landlord ↔ Tenant lean methodology
- Overall (STATE)
- 46 Balanced
- State Minnesota
- 46 Balanced · D+2
- County
- — inherits STATE
- City
- — inherits STATE
ZIP-level market 55042
- Active inventory
- 135
- Price-to-rent
- 8.6×
Monthly cashflow live
- Estimated rent
- $3,893 medium interval (Pro) →
- Mortgage (P&I)
- −$2,097
- Tax from tax record
- −$442 /mo · $5,308/yr
- Insurance
- −$167
- HOA
- −$0
- Vacancy / Maint / Mgmt
- −$818
- Net cashflow
- $369
Break-even live
Sensitivity live
| Price | -10% $596 | -5% $482 | +0% $369 | +5% $256 | +10% $143 |
|---|---|---|---|---|---|
| Rent | -10% $62 | -5% $216 | +0% $369 | +5% $523 | +10% $677 |
| Rate | -1.0pp $571 | -0.5pp $471 | base $369 | +0.5pp $266 | +1.0pp $160 |
UW: 25.0% down · 7.5% · 30yr · 1.5% tax · 5.0% vac · 8.0% maint · 8.0% mgmt
Financing live
Cash to close
- Down payment
- $99,975
- Closing costs
- $11,997
- Reserves months
- —
- Total cash needed
- —
Loan-product check · same deal, 3 products live
Conventional
25% down · 7.5% · 30yr
- Down + closing
- —
- Monthly P&I
- —
- Monthly cashflow
- —
- DSCR
- —
- Eligible?
- —
Personal DTI + credit; lowest rate.
DSCR
20% down · 8.5% · 30yr
- Down + closing
- —
- Monthly P&I
- —
- Monthly cashflow
- —
- DSCR
- —
- Eligible?
- —
No personal income docs; deal must DSCR.
Hard money
10% down · 12.0% · 12mo
- Down + closing
- —
- Monthly P&I
- —
- Monthly cashflow
- —
- DSCR
- —
- Eligible?
- —
Short-term bridge; refi at stabilization.
Rent comps 3 comps
| Address | Beds | Baths | Sqft | Rent | $/sqft | DOM | Units | Dist |
|---|---|---|---|---|---|---|---|---|
| 3472 Knightsbridge Trl N Lake Elmo, MN | 4.0 | 2.5 | 2022 | $4,000 | $1.98 | 44d | 1 | 0.96mi |
| 10974 37th St N Lake Elmo, MN | 4.0 | 3.0 | 2299 | $4,000 | $1.74 | 44d | 1 | 1.01mi |
| 11300 Upper 39th Street Cir N Lake Elmo, MN | 2.0 | 2.5 | 2220 | $3,645 | $1.64 | 0d | 12 | 1.10mi |
Listing history 20 events
-
2026-06-18days on market $399,900 Active 49 DOM
-
2026-06-17days on market $399,900 Active 48 DOM
-
2026-06-16days on market $399,900 Active 47 DOM
-
2026-06-15days on market $399,900 Active 46 DOM
-
2026-06-13days on market $399,900 Active 44 DOM
-
2026-06-13days on market $399,900 Active 43 DOM
-
2026-06-09days on market $399,900 Active 40 DOM
-
2026-06-08days on market $399,900 Active 39 DOM
-
2026-06-07days on market $399,900 Active 38 DOM
-
2026-06-04days on market $399,900 Active 35 DOM
-
2026-06-03days on market $399,900 Active 34 DOM
-
2026-06-02days on market $399,900 Active 33 DOM
-
2026-06-01days on market $399,900 Active 32 DOM
-
2026-05-31days on market $399,900 Active 31 DOM
-
2026-05-05price $399,900 857-char remark
-
2026-05-01$429,900 Active 857-char remark
-
2026-04-25historical $429,900 857-char remark
-
1993-05-03soldstatus $103,000
-
1993-02-23soldstatus $103,000
-
1989-12-06soldstatus $95,000
ⓘ Source: listings_history table (triggers on properties + properties_extension) + one-shot
backfill from property_details.listing_events for pre-trigger history.
Tax reassessment forecast MN · Partial reset (capped growth)
- Current annual tax
- $5,308 · $442/mo
- Projected year-2 tax
- $5,308 · $442/mo
- Expected delta
- $0/yr ($0/mo · 0.0%)
ⓘ Screening estimate from a state-policy table — verify with the county assessor before closing.
Climate risk First Street
- Flood 1/10 Low FEMA zone X (unshaded) · 0% chance over 30 yrs
- Wildfire 1/10 Low
- Heat 2/10 Low 7 d/yr ≥101°F today · 14 d/yr by 30 yrs out
- Wind 2/10 Low
- Air quality 3/10 Moderate 3 unhealthy d/yr today · 3 by 30 yrs out
Nearby sold comps map
Loading sold comps map…
Walkable amenities ~0.75 mi
Loading nearby amenities…
Taxation est. · year 1
- Rental income
- $46,714
- − Mortgage interest
- −$22,401
- − Property taxes
- −$5,308
- − Insurance
- −$2,000
- − Repairs & maintenance
- −$3,737
- − Management
- −$3,737
- − Depreciation
- −$11,633
- Taxable loss
- −$2,102
- Est. tax savings @ 24.0%
- +$504
- After-tax cash flow
- $4,936/yr
For passive investors: Depreciation is non-cash, so a rental often shows a tax loss while cash-flowing — sheltering income. Rental losses are passive: they offset passive income freely, and up to $25,000/yr can offset ordinary (W-2) income if you actively participate and your MAGI is under $100k (phasing out to $0 by $150k); unused losses carry forward. On sale, claimed depreciation is recaptured at up to 25%, and gains may owe capital-gains tax (a 1031 exchange can defer both). Figures are a year-1 estimate at your 24.0% rate — not tax advice; consult a CPA.
Schools (NCES district)
- District
- Stillwater Area Public School District
- NCES district ID
- 2738190
- Math proficiency
- 53% ▼ -11.00%
- Reading proficiency
- 56% ▼ -12.00%
- Median HH income
- $84,438
- Composite
- 49.8/100
- National rank
- #1954
- State rank
- #54 of 301 in MN
Livability — Lake Elmo
- Score
- 72/100
- State rank
- #271
- US rank
- #5860
Category grades
Schools grade is shown separately in the Schools card above.
Census & demographics
- Census place
- Lake Elmo, MN
- City population
- 13,156
- Population (ZIP)
- 13,156
Population outlook (Washington County) Hauer SSP2
- Today (2025)
- 278,554 people
- By 2030
- 290,465 · +4.3%
- By 2040
- 310,014 · +11.3%
- By 2050
- 324,118 · +16.4%
- By 2075
- 362,697 · +30.2%
- By 2100
- 381,491 · +37.0%
Race, ethnicity, and origin ACS 2023
- Neighborhood character
- Predominantly White (86%)
- Race & ethnicity
- White 86% Two or more races 4% Hispanic / Latino 4% Asian 4% Black 1%
- Common ancestry
- Portuguese 7% Lithuanian 5% Romanian 3%
- Foreign-born
- 5% · Canada, China
- Languages at home
- 93% English-only · Spanish 2% Other Asian/Pacific 2% German/W. Germanic 1%
Political lean MEDSL · Washington
- 2024 margin
- Lean D (+8.9) · D 53.5% · R 44.6% · Other 1.9%
- 2008→2024 swing
- +4.6pp toward D · 2008: 4.3pp · 2024: 8.9pp
- All cycles
- 2024: D+8.9 2020: D+9.2 2016: D+1.9 2012: D+0.8 2008: D+4.3
Not yet ingested
- Civics
- —
Market trends
- HPI YoY
- ▼ -155.91%
- Current HPI
- 224.0264
- Rent YoY
- —
- Metro
- —
- State GDP YoY
- ▲ 2.41%
- F500 in state
- 34
Industry mix (Fortune 500 HQ in MN)
| Industry | F500 HQs | Revenue |
|---|---|---|
| Healthcare | 2 | $407B |
|
||
| Retail | 2 | $150B |
|
||
| Consumer Goods | 2 | $32B |
|
||
| Industrial Machinery | 2 | $6B |
|
||
| Agriculture | 1 | $40B |
|
||
| Healthcare / Medical Devices | 1 | $32B |
|
||
Price history
+320.9% since first listed6 events — show timeline
- 2026-05-05 Price Changed $399,900 NORTHSTARMLS as Distributed by MLS Grid
- 2026-05-01 Listed $429,900 NORTHSTARMLS as Distributed by MLS Grid
- 2026-04-25 Coming Soon $429,900 NORTHSTARMLS as Distributed by MLS Grid
- 1993-05-03 Sold (Public Records) $103,000 Public Records
- 1993-02-23 Sold (Public Records) $103,000 Public Records
- 1989-12-06 Sold (Public Records) $95,000 Public Records
Property tax history
+9.0%/yrLatest (2025): $5,308 · -11.0% YoY. Source: county tax records.
Cash-flow waterfall
monthlySold comps — $/sqft
last 12 mo · ≤1 miLoading sold comps…