 Triplex
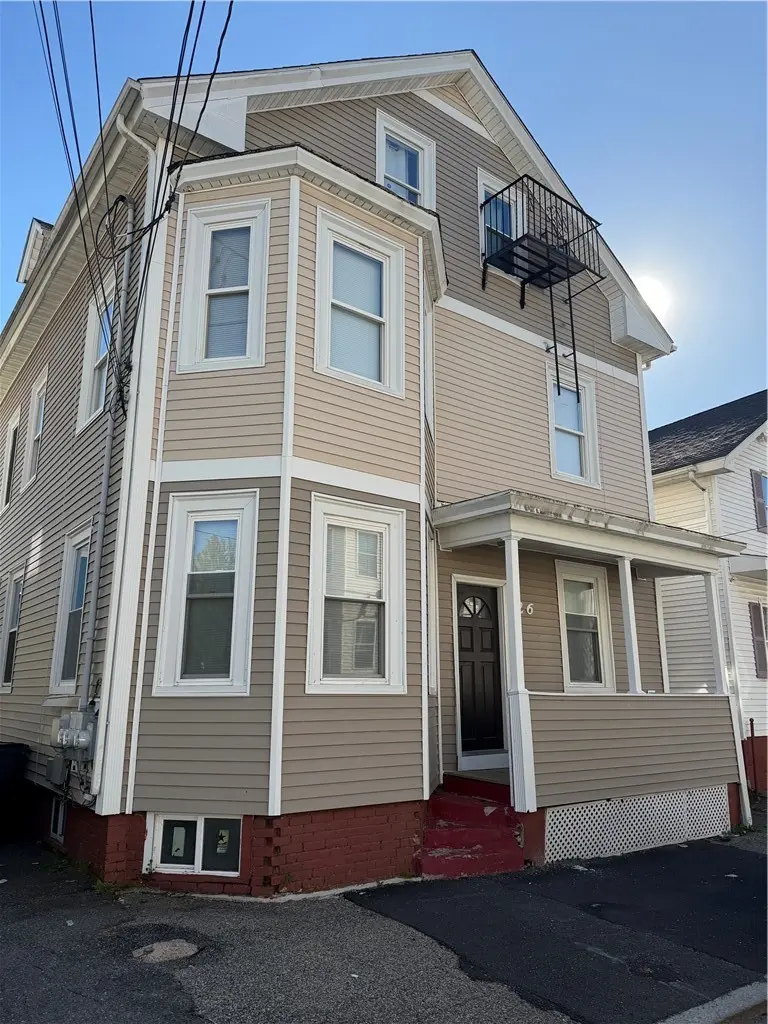
26 Greeley St · Providence, RI
Flood risk 1/10 · Minimal
- FEMA flood zone
- X (unshaded)
- Chance of flooding over 30 yrs
- 0.0%
- Est. flood insurance / yr
- $473 – $860
Fire risk 1/10 · Minimal
- Est. fire insurance / yr
- $835 – $1,551
Heat risk 6/10 · Moderate
- Hot days now (above 97°F)
- 7 days/yr
- Hot days in 30 yrs
- 15 days/yr
Wind risk 6/10 · Moderate
- Chance of severe wind over 30 yrs
- 70.0%
Air-quality risk 2/10 · Minimal
- Unhealthy air days now
- 1 days/yr
- Unhealthy air days in 30 yrs
- 2 days/yr
Risk factors via First Street. Map © Google.
Why this score? — see what drove the C- grade
The composite is a weighted blend of 9 inputs, each scored 0–100. Each bar is that input's sub-score; the figure is the points it added to the 100-point composite (weight × sub-score).
- Cash flow +20.1/30.0
- ARV discount +9.7/15.0
- DSCR +6.4/10.0
- 1% rule +4.3/10.0
- Rent growth +4.2/5.0
- Livability +4.2/5.0
- Condition / age +2.5/5.0
- Schools +1.0/10.0
- Appreciation +0.0/10.0
$652,000
🖨 Deal sheet 📄 Offer letter ✓ Due diligence
Multi-family units
County records classify this as Multi-Family (2-4 Unit). Listing-text estimate: 3 units. confirmed
Listing remarks MLS
DYNAMIC THREE-FAMILY FANTASTIC OPPOURTUNITY!
Key facts
- Multi family home
- Income producing
- Strong occupancy
Tags
Property features AI
Finance
- Other: Total units: 3; Number of buildings: 1; Lot is fenced and about 0.0735 acres
- Financial info: Operating expenses: $5,400 (multi-unit); Unit rents: One 1-bedroom at $1,400; one 3-bedroom at $1,900; one 3-bedroom at $2,100
Exterior
- Parking: No garage; Space for 4 vehicles (total)
- Utilities: Public water (connected); Public sewer (connected); Electrical service: 100 amps
- Home design: 3-story building; Single building containing all units; Above-grade finished area approximately 3,599
- Construction: Drywall and vinyl siding construction
- Exterior features: Paved driveway; Fenced yard
Interior
- Bedrooms: One-bedroom units and three-bedroom units across the building (total 3 units)
- Flooring: Ceramic tile; Hardwood; Laminate
- Bathrooms: Three full bathrooms building-wide; Each unit includes a full bathroom
- Heating & cooling: Baseboard heating; Forced air heating; Gas heating
- Interior features: Bathtub; Tub/shower
- Laundry & utility: Gas water heater; Tankless water heater; Water heater
Neighborhood map
What this means for you Summary
Snapshot
- This is a 3 × 2-bed/1.0-bath units multifamily listed at $652k.
Deal economics
- At list price, monthly cash flow is $814 ($10k/yr) — positive. Per door: $271/mo.
- The deal already cash-flows at list — no discount required.
- To meet the 1% rule (rent ≥ 1% of price), the offer needs to be $608k (6.8% below list).
- Recommended offer: $608k (6.8% below list) — sets the bar for 1% rule.
- Cap rate 7.8% vs local median 4.2% in Providence — top-decile yield for the area; either an underpriced asset or a hidden risk that comps aren't pricing in. Stress-test before assuming the spread holds.
Location & tenants
- Location reads 84/100 on livability (#2 in RI, #794 nationally) — a professional / high-income tenant draw. Strengths: amenities A+, commute A+, housing A+; Watch: employment C-, schools F.
- Providence (urban): math 8% / reading 16% proficiency, ranked #34 of 39 in RI (top 87%) — low school quality limits family demand, transient renter base, plan for 1-2y turnover; 79% free/reduced lunch — lower-income household profile, screen leases tightly.
- Market conditions: Rents rising fast (+6.9%/yr); 151 active listings in the ZIP; 776 units permitted in Providence County in 2024 (229 in 5+ unit buildings).
- At $6,077/mo this rent would consume 109% of the median local household income ($67k/yr) (locally 1176% of renters already pay >50% of income on rent) — very limited rent-growth headroom before tenants either downsize or default.
Forward outlook
- Local home prices are declining (-3.0%/yr); year-one equity from $5k of loan paydown is wiped out by about $20k of value loss. Plan a longer hold.
- Providence County population projected at +5% by 2050 — modest demand growth; plan on rents tracking national, not racing it.
- At projected returns (-3.0% appreciation + 6.9% rent growth), your $183k cash investment doubles in ~10 years — after that, you're playing with house money.
Negotiation context
- Only 8 days on market — expect competitive offers; lowballing is unlikely to land.
- 13 sale attempts since 30y ago with the ask held roughly flat each time — persistent listings suggest the price (not the market) is what's stuck; bring a comps-based counter.
- Current owner paid $290k; list at $652k implies a 125% gain — meaningful room to come down on a strong offer.
Risks & watch-outs
- Watch-outs: built in 1900 — expect roof / HVAC / electrical / plumbing capex.
- Climate carrying-cost: major wind risk, 70% chance of damaging wind over 30y; extreme-heat days projected 7→15/yr by 2055 (HVAC capex compounding) — expect insurance premiums to compound above CPI over the hold.
Questions for the listing agent
- Can we see the unit-by-unit rent roll, current vacancy, and any below-market leases? What's the average tenancy length?
- What capital expenditures (roof, boiler, parking lot, exteriors) have been made in the last 5 years, and what's planned in the next 2?
- Built in 1900 — when were the roof, HVAC, electrical panel, plumbing, and water heater last replaced?
- Is there a deadline driving the sale (1031 exchange, divorce, estate, relocation)? That informs how much negotiation room exists.
- Schools are F-rated, which usually means shorter tenancies and higher turnover. Who's the typical renter profile here, and what's been the actual vacancy rate?
- What's the average days-on-market for RENTAL listings here right now (not sales)? A rising rental-DOM trend means longer vacancies and softer asking-rent achievability than the comps imply.
- What's the recent tenant-quality profile in this submarket — average credit score on applications, eviction rate, late-payment / NSF rate, and stable-employment percentage? A property-management company in the area should have these aggregated.
- How much new apartment / multifamily construction is in the pipeline within 1–3 miles? Heavy new supply (>2% of stock underway) typically softens rents 12–24 months out; light construction supports rent growth.
Investment metrics
- 1% rule
- 0.93% ✗
- Cap rate
- 7.79%
- Cash-on-cash
- 5.35%
- DSCR
- 1.24
- GRM
- 8.9
CMA / ARV
- ARV (median comp)
- $685,140
- List price
- $652,000
- Delta
- -4.84%
- Verdict
- FAIR
- Comps
- 11 within 1.0 mi
Projected returns pro-forma
-3.0% appreciation · 6.88% rent growth · sell at horizon
- IRR
- -4.1%
- Equity multiple
- 0.84×
- Total profit
- $-29,365
- Equity at exit
- $97,215
- IRR
- 9.2%
- Equity multiple
- 1.82×
- Total profit
- $149,861
- Equity at exit
- $56,373
Cash invested: $182,560 (down + closing). Projections, not guarantees.
Landlord ↔ Tenant lean methodology
- Overall (STATE)
- 31 Tenant-Leaning
- State Rhode Island
- 31 Tenant-Leaning · D+8
- County
- — inherits STATE
- City
- — inherits STATE
ZIP-level market 02904
- Rents YoY
- 6.9%
- Active inventory
- 151
- Price-to-rent
- 26.8×
Monthly cashflow live
- Estimated rent
- $6,077 high interval (Pro) →
- Mortgage (P&I)
- −$3,419
- Tax from tax record
- −$296 /mo · $3,548/yr
- Insurance
- −$272
- HOA
- −$0
- Vacancy / Maint / Mgmt
- −$1,276
- Net cashflow
- $814
Break-even live
3-unit breakdown (identical units grouped — click to expand)
| Units | Beds | Baths | Est. rent |
|---|---|---|---|
| 3× units | 2 | 1 | $6,078 |
| #1 | 2 | 1 | $2,026 |
| #2 | 2 | 1 | $2,026 |
| #3 | 2 | 1 | $2,026 |
| Total (3 units) | $6,077 | ||
UW: 25.0% down · 7.5% · 30yr · 1.5% tax · 5.0% vac · 8.0% maint · 8.0% mgmt
Financing live
Cash to close
- Down payment
- $163,000
- Closing costs
- $19,560
- Reserves months
- —
- Total cash needed
- —
Loan-product check · same deal, 3 products live
Conventional
25% down · 7.5% · 30yr
- Down + closing
- —
- Monthly P&I
- —
- Monthly cashflow
- —
- DSCR
- —
- Eligible?
- —
Personal DTI + credit; lowest rate.
DSCR
20% down · 8.5% · 30yr
- Down + closing
- —
- Monthly P&I
- —
- Monthly cashflow
- —
- DSCR
- —
- Eligible?
- —
No personal income docs; deal must DSCR.
Hard money
10% down · 12.0% · 12mo
- Down + closing
- —
- Monthly P&I
- —
- Monthly cashflow
- —
- DSCR
- —
- Eligible?
- —
Short-term bridge; refi at stabilization.
Listing history 38 events
-
2026-05-11$652,000 Active 775-char remark
-
2022-02-22price $1,600
-
2021-03-11soldstatus $290,000 Closed 44-char remark
Show marketing remark (44 chars)
DYNAMIC THREE-FAMILY FANTASTIC OPPOURTUNITY!
-
2021-03-01soldstatus $290,000
-
2020-09-15status Pending 44-char remark
Show marketing remark (44 chars)
DYNAMIC THREE-FAMILY FANTASTIC OPPOURTUNITY!
-
2020-09-15price $289,900 44-char remark
Show marketing remark (44 chars)
DYNAMIC THREE-FAMILY FANTASTIC OPPOURTUNITY!
-
2020-09-06$259,900 Active 44-char remark
Show marketing remark (44 chars)
DYNAMIC THREE-FAMILY FANTASTIC OPPOURTUNITY!
-
2016-02-10soldstatus $180,000 Sold
Show marketing remark (239 chars)
Absolutely perfect 3 family property in a great area of Providence. Don't miss out on this one, it certainly won't last. Huge rooms, plenty of parking and this house doesn't need anything. Turnkey property with great rental income. TURNKEY
-
2015-12-29status Pending
Show marketing remark (239 chars)
Absolutely perfect 3 family property in a great area of Providence. Don't miss out on this one, it certainly won't last. Huge rooms, plenty of parking and this house doesn't need anything. Turnkey property with great rental income. TURNKEY
-
2015-11-07historical Active - Under Contract
Show marketing remark (239 chars)
Absolutely perfect 3 family property in a great area of Providence. Don't miss out on this one, it certainly won't last. Huge rooms, plenty of parking and this house doesn't need anything. Turnkey property with great rental income. TURNKEY
-
2015-11-03price $198,000
Show marketing remark (239 chars)
Absolutely perfect 3 family property in a great area of Providence. Don't miss out on this one, it certainly won't last. Huge rooms, plenty of parking and this house doesn't need anything. Turnkey property with great rental income. TURNKEY
-
2015-10-09$199,000 Active - New
Show marketing remark (239 chars)
Absolutely perfect 3 family property in a great area of Providence. Don't miss out on this one, it certainly won't last. Huge rooms, plenty of parking and this house doesn't need anything. Turnkey property with great rental income. TURNKEY
-
2015-09-18status Active - Extended
-
2015-09-18historical
-
2015-04-08status Pending
-
2015-03-19$179,900 Active - New
-
2014-08-27historical
-
2014-08-07$39,900 Active - New
-
2014-06-11historical
-
2014-04-21status Pending
-
2014-04-14$40,000 Active - New
-
2013-12-19price $22,000
-
2013-12-19price $109,900
-
2012-08-17historical
-
2012-08-17historical
-
2011-02-10$67,000
-
2010-12-07historical
-
2010-07-17$129,900
-
2010-06-15historical
-
2009-12-17$149,000
-
2005-11-14historical
-
2005-11-14$275,000
-
1997-12-02soldstatus $63,000
-
1997-12-01soldstatus $63,000
-
1997-10-18historical
-
1997-07-08$69,900
-
1997-06-10historical
-
1996-12-11$74,900
ⓘ Source: listings_history table (triggers on properties + properties_extension) + one-shot
backfill from property_details.listing_events for pre-trigger history.
Tax reassessment forecast RI · Partial reset (capped growth)
- Current annual tax
- $3,548 · $296/mo
- Projected year-2 tax
- $7,088 · $591/mo
- Expected delta
- +$3,540/yr (+$295/mo · 99.8%)
ⓘ Screening estimate from a state-policy table — verify with the county assessor before closing.
Climate risk First Street
- Flood 1/10 Low FEMA zone X (unshaded) · 0% chance over 30 yrs
- Wildfire 1/10 Low
- Heat 6/10 Major 7 d/yr ≥97°F today · 15 d/yr by 30 yrs out
- Wind 6/10 Major 70% chance of damaging wind over 30 yrs
- Air quality 2/10 Low 1 unhealthy d/yr today · 2 by 30 yrs out
Nearby sold comps map
Loading sold comps map…
Walkable amenities ~0.75 mi
Loading nearby amenities…
Taxation est. · year 1
- Rental income
- $72,924
- − Mortgage interest
- −$36,522
- − Property taxes
- −$3,548
- − Insurance
- −$3,260
- − Repairs & maintenance
- −$5,834
- − Management
- −$5,834
- − Depreciation
- −$18,967
- Taxable loss
- −$1,041
- Est. tax savings @ 24.0%
- +$250
- After-tax cash flow
- $10,022/yr
For passive investors: Depreciation is non-cash, so a rental often shows a tax loss while cash-flowing — sheltering income. Rental losses are passive: they offset passive income freely, and up to $25,000/yr can offset ordinary (W-2) income if you actively participate and your MAGI is under $100k (phasing out to $0 by $150k); unused losses carry forward. On sale, claimed depreciation is recaptured at up to 25%, and gains may owe capital-gains tax (a 1031 exchange can defer both). Figures are a year-1 estimate at your 24.0% rate — not tax advice; consult a CPA.
Schools (NCES district)
- District
- Providence
- NCES district ID
- 4400900
- Math proficiency
- 8% ▼ -4.00%
- Reading proficiency
- 16% ▼ -2.00%
- Median HH income
- $38,197
- Composite
- 10.12/100
- National rank
- #9803
- State rank
- #34 of 39 in RI
Livability — Providence
- Score
- 84/100
- State rank
- #2
- US rank
- #794
Category grades
Schools grade is shown separately in the Schools card above.
Census & demographics
- Census place
- Providence, RI
- County
- Providence County · 548,917 people
- City population
- 212,734
- Metro
- Providence-Warwick, RI-MA
- Population (ZIP)
- 32,531
- Household income
- $67,003
- Rent vs Own
- Severe rent burden
- 1176.0
Population outlook (Providence County) Hauer SSP2
- Today (2025)
- 653,469 people
- By 2030
- 660,819 · +1.1%
- By 2040
- 672,747 · +3.0%
- By 2050
- 683,741 · +4.6%
- By 2075
- 720,435 · +10.2%
- By 2100
- 741,582 · +13.5%
Race, ethnicity, and origin ACS 2023
- Neighborhood character
- Diverse neighborhood (Simpson 0.66)
- Race & ethnicity
- White 51% Hispanic / Latino 27% Two or more races 16% Black 8% Asian 5%
- Hispanic origin (detail)
- Mexican 2% Puerto Rican 6% Dominican 7%
- Common ancestry
- Lithuanian 7% Russian 6% Romanian 2%
- Foreign-born
- 18% · Canada, Jamaica, China
- Languages at home
- 64% English-only · Spanish 20% Other Indo-European 5% Other Asian/Pacific 3%
Political lean MEDSL · Providence
- 2024 margin
- D (+14.4) · D 56.1% · R 41.7% · Other 2.2%
- 2008→2024 swing
- -20.0pp toward R · 2008: 34.4pp · 2024: 14.4pp
- All cycles
- 2024: D+14.4 2020: D+22.9 2016: D+21.2 2012: D+34.9 2008: D+34.4
Not yet ingested
- Civics
- —
Market trends
- HPI YoY
- ▼ -379.06%
- Current HPI
- 363.1386
- Rent YoY
- ▲ 6.88%
- Metro
- Providence-Warwick, RI-MA
- State GDP YoY
- ▲ 2.25%
- F500 in state
- 10
Industry mix (Fortune 500 HQ in RI)
| Industry | F500 HQs | Revenue |
|---|---|---|
| Healthcare | 1 | $373B |
|
||
| Food Distribution | 1 | $31B |
|
||
| Aerospace / Defense | 1 | $14B |
|
||
| Financial Services | 1 | $8B |
|
||
| Consumer Goods | 1 | $4B |
|
||
Price history
+770.5% since first listed39 events — show timeline
- 2026-05-19 Pending — RIS
- 2026-05-11 Listed $652,000 RIS
- 2022-02-22 Price Changed $1,600 RENT.
- 2021-03-11 Sold (MLS) $290,000 RIS
- 2021-03-01 Sold (Public Records) $290,000 Public Records
- 2020-09-15 Pending — RIS
- 2020-09-15 Price Changed $289,900 RIS
- 2020-09-06 Listed $259,900 RIS
- 2016-02-10 Sold (MLS) $180,000 RIS
- 2015-12-29 Pending — RIS
- 2015-11-07 Contingent — RIS
- 2015-11-03 Price Changed $198,000 RIS
- 2015-10-09 Listed $199,000 RIS
- 2015-09-18 Relisted — RIS
- 2015-09-18 Listing Removed — RIS
- 2015-04-08 Pending — RIS
- 2015-03-19 Listed $179,900 RIS
- 2014-08-27 Listing Removed — RIS
- 2014-08-07 Listed $39,900 RIS
- 2014-06-11 Listing Removed — RIS
- 2014-04-21 Pending — RIS
- 2014-04-14 Listed $40,000 RIS
- 2013-12-19 Price Changed $22,000 RIS
- 2013-12-19 Price Changed $109,900 RIS
- 2012-08-17 Listing Removed — RIS
- 2012-08-17 Listing Removed — RIS
- 2011-02-10 Listed $67,000 RIS
- 2010-12-07 Listing Removed — RIS
- 2010-07-17 Listed $129,900 RIS
- 2010-06-15 Listing Removed — RIS
- 2009-12-17 Listed $149,000 RIS
- 2005-11-14 Listed $275,000 RIS
- 2005-11-14 Listing Removed — RIS
- 1997-12-02 Sold (Public Records) $63,000 Public Records
- 1997-12-01 Sold (MLS) $63,000 RIS
- 1997-10-18 Listing Removed — RIS
- 1997-07-08 Listed $69,900 RIS
- 1997-06-10 Listing Removed — RIS
- 1996-12-11 Listed $74,900 RIS
Property tax history
-2.2%/yrLatest (2025): $3,548 · -35.1% YoY. Source: county tax records.
Cash-flow waterfall
monthlySold comps — $/sqft
last 12 mo · ≤1 miLoading sold comps…