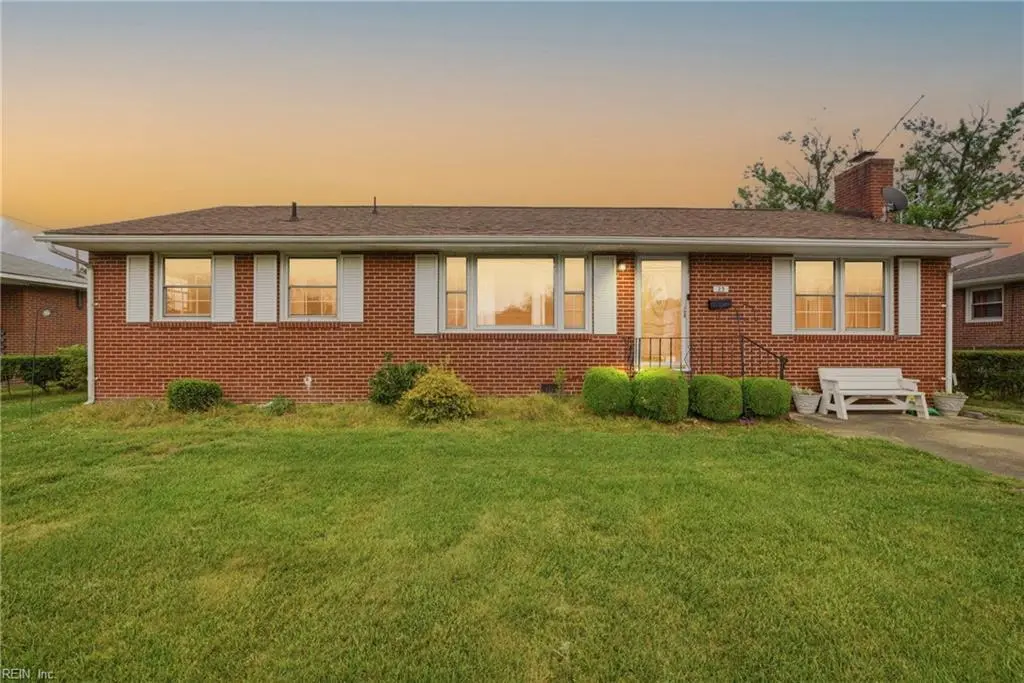
23 Prince George Dr · Hampton, VA
Flood risk 3/10 · Minor
- FEMA flood zone
- X (unshaded)
- Chance of flooding over 30 yrs
- 0.12%
- Est. flood insurance / yr
- $473 – $860
Fire risk 1/10 · Minimal
- Est. fire insurance / yr
- $666 – $1,236
Heat risk 9/10 · Severe
- Hot days now (above 105°F)
- 7 days/yr
- Hot days in 30 yrs
- 16 days/yr
Wind risk 8/10 · Major
- Chance of severe wind over 30 yrs
- 80.0%
Air-quality risk 2/10 · Minimal
- Unhealthy air days now
- 1 days/yr
- Unhealthy air days in 30 yrs
- 1 days/yr
Risk factors via First Street. Map © Google.
Why this score? — see what drove the D+ grade
The composite is a weighted blend of 9 inputs, each scored 0–100. Each bar is that input's sub-score; the figure is the points it added to the 100-point composite (weight × sub-score).
- ARV discount +15.0/15.0
- Cash flow +11.5/30.0
- Schools +5.5/10.0
- Rent growth +3.9/5.0
- Livability +3.8/5.0
- DSCR +3.4/10.0
- 1% rule +3.0/10.0
- Condition / age +2.5/5.0
- Appreciation +0.0/10.0
$255,000
🖨 Deal sheet 📄 Offer letter ✓ Due diligence
Listing remarks
Welcome home to 23 Prince George Drive in beautiful Hampton! This charming and well-maintained home offers 2 spacious bedrooms and 2 full bathrooms, providing the perfect blend of comfort, functionality, and style. Each bedroom is generously sized with large closets and offering plenty of storage. The two full baths add convenience for both everyday living and hosting guests. A screened in back porch overlooks a spacious backyard and large detached shed with power provides a wonderful workshop space! Whether you're a first-time homebuyer, downsizing, or looking for a smart investment opportunity, this home offers incredible value and versatility. Centrally located near shopping, dining, loc
Key facts
- 8,712 sq ft lot
- 2 parking spots
- Built 1970
Property features AI
Finance
- HOA & community: No HOA
Exterior
- Parking: Off-street parking; Driveway spaces; Street parking (total 2 spaces)
- Utilities: City/County water; City/County sewer; Other type water heater
- Home design: Detached single-family home; Ranch-style; Single-story (1 living level); Crawl foundation
- Construction: Asphalt shingle roof
- Exterior features: Brick siding; Back yard fenced; Screened porch; Detached workshop
Interior
- Kitchen: Gas range; Microwave; Refrigerator; Dishwasher
- Bedrooms: First-floor master bedroom; Master bedroom with ensuite; Additional bedroom(s)
- Flooring: Wood flooring; Laminate flooring; Ceramic flooring
- Bathrooms: 2 full bathrooms
- Heating & cooling: Heat pump; Geothermal cooling
- Interior features: Gas fireplace; Cable hookup; Ceiling fans; Attic; Screened porch; Workshop (detached)
- Laundry & utility: Washer and dryer (hookups present); Utility room
Neighborhood map
What this means for you Summary
Snapshot
- This is a 4-bed/2.5-bath single-family listed at $255k.
Deal economics
- At list price, monthly cash flow is $-85 ($-1k/yr) — negative.
- To cash-flow at today's rent, offer at most $240k (5.9% below list).
- To meet the 1% rule (rent ≥ 1% of price), the offer needs to be $205k (19.8% below list).
- Recommended offer: $205k (19.8% below list) — sets the bar for 1% rule.
- Cap rate 5.9% vs local median 4.5% in Hampton — top-decile yield for the area; either an underpriced asset or a hidden risk that comps aren't pricing in. Stress-test before assuming the spread holds.
Location & tenants
- Location reads 75/100 on livability (#133 in VA, #4,302 nationally) — a middle-class / working-renter tenant base. Strengths: housing A+, health & safety A+, cost of living A; Watch: crime C-, amenities D+, commute F.
- Hampton City Public School District (urban): math 60% / reading 70% proficiency, ranked #40 of 131 in VA (top 30%) — acceptable for families but not a draw, mixed tenant base, ~2y average lease.
- Zoned schools: A.W.E. Bassette Elementary (math 32% / reading 47%, grade F, #900 of 1,108 statewide, top 83%, 494 students, 87% FRL); Hampton High (math 60% / reading 75%, grade B, #183 of 319 statewide, top 58%, 1,359 students, 86% FRL) — zoned schools average 86% FRL vs 49% district-wide (37 pts higher); higher-poverty schools than district average — tighter screening recommended.
- Market conditions: Rents rising fast (+5.4%/yr); 232 active listings in the ZIP; 16 comparable units currently listed for rent nearby; rentals at typical pace (median 17d on market — plan ~3-4 weeks tenant-placement turnaround); 68 units permitted in Hampton city in 2024 (0 in 5+ unit buildings).
- This rent runs 34% of the median local income ($71k/yr) — at the standard rent-burdened threshold; future hikes will face affordability resistance.
Forward outlook
- Local home prices are declining (-3.0%/yr); year-one equity from $2k of loan paydown is wiped out by about $8k of value loss. Plan a longer hold.
- Hampton County population projected at -13% by 2050 — secular population decline; favor cash flow + early exit over multi-decade hold.
Negotiation context
- It's been on market 17 days — a 2% lower offer ($251k) is reasonable based on typical stale-listing flexibility.
- Current owner paid $80k; list at $255k implies a 219% gain — meaningful room to come down on a strong offer.
Risks & watch-outs
- Climate carrying-cost: severe wind risk, 80% chance of damaging wind over 30y; extreme-heat days projected 7→16/yr by 2055 (HVAC capex compounding) — expect insurance premiums to compound above CPI over the hold.
Questions for the listing agent
- What do current leases actually rent for vs. the listed asking? Can we see a recent rent roll and the last 12 months of T-12 income?
- Built in 1970 — when were the roof, HVAC, electrical panel, plumbing, and water heater last replaced?
- Is there a deadline driving the sale (1031 exchange, divorce, estate, relocation)? That informs how much negotiation room exists.
- Schools are B-rated — typically a magnet for longer-tenancy family renters. What's the average tenant stay here, and is there a school-zone premium baked into asking?
- The area grade is low — what's the realistic commute time and amenity access for the typical tenant pool here? Any planned neighborhood developments (good or bad) we should know about?
- What's the average days-on-market for RENTAL listings here right now (not sales)? A rising rental-DOM trend means longer vacancies and softer asking-rent achievability than the comps imply.
- What's the recent tenant-quality profile in this submarket — average credit score on applications, eviction rate, late-payment / NSF rate, and stable-employment percentage? A property-management company in the area should have these aggregated.
- How much new for-sale + rental construction is in the pipeline within 1–3 miles? Heavy new supply typically softens prices + rents 12–24 months out; constrained supply supports both.
Investment metrics
- 1% rule
- 0.80% ✗
- Cap rate
- 5.89%
- Cash-on-cash
- -1.42%
- DSCR
- 0.94
- GRM
- 10.4
CMA / ARV
- ARV (on-the-fly)
- $323,952
- Comps found
- 12
Show comp detail 12 sales within ~0.75 mi
| Address | Dist | Beds/Ba | Sqft | Sold | Price | $/sf | Match |
|---|---|---|---|---|---|---|---|
| 19 Prince James Dr | 0.06mi | 3/2.5 (-1) | 1,805 (+14%) | 8mo | $345,000 | $191 | 63 |
| 221 Prince George Dr | 0.36mi | 4/1.5 | 1,438 (-9%) | 4mo | $228,000 | $159 | 60 |
| 211 Hankins Dr | 0.51mi | 4/2.5 | 1,608 (+1%) | 17mo | $325,000 | $202 | 60 |
| 4 Dundee Rd | 0.30mi | 3/2.0 (-1) | 1,398 (-12%) | 2mo | $328,900 | $235 | 58 |
| 28 Allison Sutton Dr | 0.51mi | 3/2.0 (-1) | 1,519 (-4%) | 6mo | $310,000 | $204 | 57 |
| 43 Azalea Dr | 0.35mi | 3/2.0 (-1) | 1,718 (+8%) | 10mo | $237,500 | $138 | 55 |
| 8 Roundtree Cir | 0.67mi | 4/2.0 | 1,502 (-5%) | 4mo | $306,000 | $204 | 55 |
| 107 Ward Dr | 0.28mi | 3/2.0 (-1) | 1,754 (+10%) | 10mo | $345,000 | $197 | 54 |
| 48 Azalea Dr | 0.31mi | 4/2.0 | 1,401 (-12%) | 13mo | $299,900 | $214 | 53 |
| 14 Mallard Run | 0.72mi | 3/2.0 (-1) | 1,519 (-4%) | 2mo | $365,000 | $240 | 51 |
| 1707 Neptune Dr | 0.46mi | 3/2.5 (-1) | 1,818 (+14%) | 4mo | $376,000 | $207 | 46 |
| 3 Hankins Dr | 0.39mi | 3/2.0 (-1) | 1,748 (+10%) | 22mo | $343,100 | $196 | 39 |
Match score weights: distance 35% · size 25% · config 20% · recency 20%. Top-matched comps best support the ARV.
Projected returns pro-forma
-3.0% appreciation · 5.44% rent growth · sell at horizon
- IRR
- -16.1%
- Equity multiple
- 0.42×
- Total profit
- $-41,578
- Equity at exit
- $38,021
- IRR
- -4.0%
- Equity multiple
- 0.71×
- Total profit
- $-20,983
- Equity at exit
- $22,048
Cash invested: $71,400 (down + closing). Projections, not guarantees.
Landlord ↔ Tenant lean methodology
- Overall (STATE)
- 55 Moderately Landlord-Leaning
- State Virginia
- 55 Moderately Landlord-Leaning · D+2
- County
- — inherits STATE
- City
- — inherits STATE
ZIP-level market 23669
- Rents YoY
- 5.4%
- Active inventory
- 232
- Price-to-rent
- 10.4×
Monthly cashflow live
- Estimated rent
- $2,046 high interval (Pro) →
- Mortgage (P&I)
- −$1,337
- Tax from tax record
- −$258 /mo · $3,092/yr
- Insurance
- −$106
- HOA
- −$0
- Vacancy / Maint / Mgmt
- −$430
- Net cashflow
- $-85
Break-even live
UW: 25.0% down · 7.5% · 30yr · 1.5% tax · 5.0% vac · 8.0% maint · 8.0% mgmt
Financing live
Cash to close
- Down payment
- $63,750
- Closing costs
- $7,650
- Reserves months
- —
- Total cash needed
- —
Loan-product check · same deal, 3 products live
Conventional
25% down · 7.5% · 30yr
- Down + closing
- —
- Monthly P&I
- —
- Monthly cashflow
- —
- DSCR
- —
- Eligible?
- —
Personal DTI + credit; lowest rate.
DSCR
20% down · 8.5% · 30yr
- Down + closing
- —
- Monthly P&I
- —
- Monthly cashflow
- —
- DSCR
- —
- Eligible?
- —
No personal income docs; deal must DSCR.
Hard money
10% down · 12.0% · 12mo
- Down + closing
- —
- Monthly P&I
- —
- Monthly cashflow
- —
- DSCR
- —
- Eligible?
- —
Short-term bridge; refi at stabilization.
Rent comps 16 comps
| Address | Beds | Baths | Sqft | Rent | $/sqft | DOM | Units | Dist |
|---|---|---|---|---|---|---|---|---|
| 101 Prince James Dr Hampton, VA | 3.0 | 1.0 | 1766 | $1,645 | $0.93 | 14d | 1 | 0.10mi |
| 316 Fountain Way Hampton, VA | 3.0 | 2.5 | 1850 | $2,600 | $1.41 | 17d | 1 | 0.82mi |
| 702 Rutherford St Hampton, VA | 3.0 | 2.0 | 1445 | $1,795 | $1.24 | 23d | 1 | 0.86mi |
| 7 Briar Dr Hampton, VA | 3.0 | 1.5 | 1626 | $1,850 | $1.14 | 14d | 1 | 0.86mi |
| 708 Westwood Ave Hampton, VA | 3.0 | 2.5 | 1300 | $2,300 | $1.77 | 14d | 1 | 1.01mi |
| 640 Rolfe St Hampton, VA | 3.0 | 2.0 | 1100 | $2,000 | $1.82 | 43d | 1 | 1.05mi |
| 426 Seminole Rd Hampton, VA | 4.0 | 2.5 | 2200 | $2,450 | $1.11 | 14d | 1 | 1.14mi |
| 1587 Briarfield Rd Hampton, VA | 2.0–3.0 | 1.5–2.0 | 985 | $1,495 | $1.52 | 2d | 9 | 1.17mi |
| 707 Pennsylvania Ave Hampton, VA | 4.0 | 2.5 | 2134 | $2,800 | $1.31 | 23d | 1 | 1.18mi |
| 534 Brightwood Ave Hampton, VA | 3.0 | 3.0 | 1528 | $2,095 | $1.37 | 43d | 1 | 1.24mi |
| 613 Delaware Ave Hampton, VA | 3.0 | 2.0 | 1082 | $1,900 | $1.76 | 3d | 1 | 1.26mi |
| 7 W Lewis Rd Hampton, VA | 3.0 | 2.0 | 1208 | $2,425 | $2.01 | 21d | 1 | 1.27mi |
| 901 W Queen St Hampton, VA | 2.0–3.0 | 1.5–2.5 | 1096 | $1,600 | $1.46 | 43d | 1 | 1.30mi |
| 626 Chapel St Hampton, VA | 4.0 | 2.0 | 1470 | $1,900 | $1.29 | 12d | 1 | 1.31mi |
| 2 Abbott Dr Hampton, VA | 1.0–3.0 | 1.0–3.5 | 1187 | $2,891 | $2.43 | 1d | 18 | 1.35mi |
| 607 Lee St Hampton, VA | 3.0 | 1.5 | 1404 | $2,150 | $1.53 | 43d | 1 | 1.41mi |
Listing history 4 events
-
2026-05-11historical Active Under Contract
-
2026-05-08$255,000 Active
-
1997-03-01soldstatus $79,900
-
1968-08-01soldstatus $15,476
ⓘ Source: listings_history table (triggers on properties + properties_extension) + one-shot
backfill from property_details.listing_events for pre-trigger history.
Tax reassessment forecast VA · Resets to sale price
- Current annual tax
- $3,092 · $258/mo
- Projected year-2 tax
- $3,092 · $258/mo
- Expected delta
- $0/yr ($0/mo · 0.0%)
ⓘ Screening estimate from a state-policy table — verify with the county assessor before closing.
Climate risk First Street
- Flood 3/10 Moderate FEMA zone X (unshaded) · 12% chance over 30 yrs
- Wildfire 1/10 Low
- Heat 9/10 Extreme 7 d/yr ≥105°F today · 16 d/yr by 30 yrs out
- Wind 8/10 Severe 80% chance of damaging wind over 30 yrs
- Air quality 2/10 Low 1 unhealthy d/yr today · 1 by 30 yrs out
Nearby sold comps map
Loading sold comps map…
Walkable amenities ~0.75 mi
Loading nearby amenities…
Taxation est. · year 1
- Rental income
- $24,553
- − Mortgage interest
- −$14,284
- − Property taxes
- −$3,092
- − Insurance
- −$1,275
- − Repairs & maintenance
- −$1,964
- − Management
- −$1,964
- − Depreciation
- −$7,418
- Taxable loss
- −$5,444
- Est. tax savings @ 24.0%
- +$1,307
- After-tax cash flow
- $290/yr
For passive investors: Depreciation is non-cash, so a rental often shows a tax loss while cash-flowing — sheltering income. Rental losses are passive: they offset passive income freely, and up to $25,000/yr can offset ordinary (W-2) income if you actively participate and your MAGI is under $100k (phasing out to $0 by $150k); unused losses carry forward. On sale, claimed depreciation is recaptured at up to 25%, and gains may owe capital-gains tax (a 1031 exchange can defer both). Figures are a year-1 estimate at your 24.0% rate — not tax advice; consult a CPA.
Schools (NCES district)
- District
- Hampton City Public School District
- NCES district ID
- 5101800
- Math proficiency
- 60% ▼ -21.00%
- Reading proficiency
- 70% ▼ -4.00%
- Median HH income
- $50,089
- Composite
- 55.19/100
- National rank
- #1272
- State rank
- #40 of 131 in VA
Livability — Hampton
- Score
- 75/100
- State rank
- #133
- US rank
- #4302
Category grades
Schools grade is shown separately in the Schools card above.
Census & demographics
- Census place
- Hampton, VA
- County
- Hampton City · 132,421 people
- City population
- 132,421
- Metro
- Virginia Beach-Norfolk-Newport News, VA-NC
- Population (ZIP)
- 39,884
- Household income
- $71,222
- Rent vs Own
- Severe rent burden
- 2130.0
Population outlook (Hampton County) Hauer SSP2
- Today (2025)
- 134,055 people
- By 2030
- 131,753 · -1.7%
- By 2040
- 125,017 · -6.7%
- By 2050
- 116,825 · -12.9%
- By 2075
- 97,033 · -27.6%
- By 2100
- 76,188 · -43.2%
Race, ethnicity, and origin ACS 2023
- Neighborhood character
- Diverse neighborhood (Simpson 0.63)
- Race & ethnicity
- Black 46% White 39% Two or more races 9% Hispanic / Latino 6% Asian 2%
- Hispanic origin (detail)
- Mexican 1% Puerto Rican 2%
- Common ancestry
- Slovak 2% Italian 1% Romanian 1%
- Foreign-born
- 4% · Canada
- Languages at home
- 95% English-only · Spanish 3% Other Asian/Pacific 1%
Political lean MEDSL · Hampton
- 2024 margin
- Solid D (+39.9) · D 69.2% · R 29.4% · Other 1.4%
- 2008→2024 swing
- +1.0pp no change · 2008: 38.9pp · 2024: 39.9pp
- All cycles
- 2024: D+39.9 2020: D+42.2 2016: D+37.8 2012: D+45.4 2008: D+38.9
Not yet ingested
- Civics
- —
Market trends
- HPI YoY
- ▼ -150.40%
- Current HPI
- 276.4636
- Rent YoY
- ▲ 5.44%
- Metro
- Virginia Beach-Norfolk-Newport News, VA-NC
- State GDP YoY
- ▲ 2.40%
- F500 in state
- 50
Industry mix (Fortune 500 HQ in VA)
| Industry | F500 HQs | Revenue |
|---|---|---|
| Aerospace / Defense | 4 | $236B |
|
||
| Technology / Defense | 3 | $32B |
|
||
| Financial Services | 2 | $176B |
|
||
| Utilities | 2 | $27B |
|
||
| Insurance | 2 | $25B |
|
||
| Technology | 2 | $15B |
|
||
Price history
+1547.7% since first listed4 events — show timeline
- 2026-05-11 Contingent — REINMLS
- 2026-05-08 Listed $255,000 REINMLS
- 1997-03-01 Sold (Public Records) $79,900 Public Records
- 1968-08-01 Sold (Public Records) $15,476 Public Records
Property tax history
+9.9%/yrLatest (2025): $3,092 · +12.3% YoY. Source: county tax records.
Cash-flow waterfall
monthlySold comps — $/sqft
last 12 mo · ≤1 miLoading sold comps…