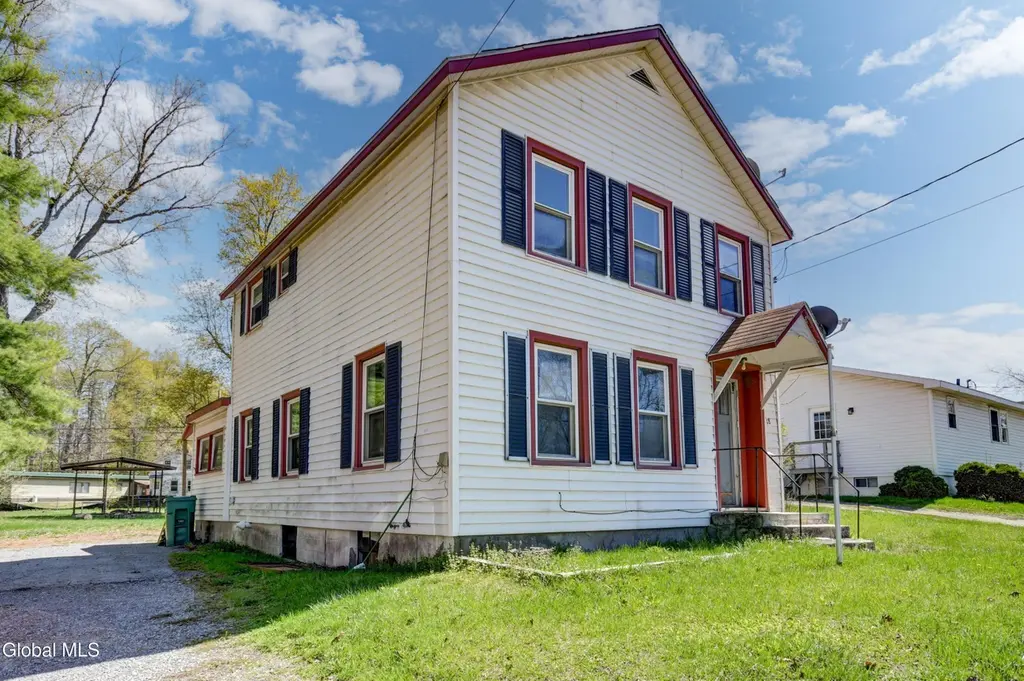
18 W Main St · Nelliston, NY
Flood risk 1/10 · Minimal
- FEMA flood zone
- X (unshaded)
- Chance of flooding over 30 yrs
- 0.0%
- Est. flood insurance / yr
- $473 – $860
Fire risk 1/10 · Minimal
- Est. fire insurance / yr
- $691 – $1,283
Heat risk 3/10 · Minor
- Hot days now (above 96°F)
- 7 days/yr
- Hot days in 30 yrs
- 16 days/yr
Wind risk 2/10 · Minimal
- Chance of severe wind over 30 yrs
- 2.0%
Air-quality risk 1/10 · Minimal
- Unhealthy air days now
- 0 days/yr
- Unhealthy air days in 30 yrs
- 0 days/yr
Risk factors via First Street. Map © Google.
Why this score? — see what drove the B+ grade
The composite is a weighted blend of 9 inputs, each scored 0–100. Each bar is that input's sub-score; the figure is the points it added to the 100-point composite (weight × sub-score).
- Cash flow +26.4/30.0
- ARV discount +15.0/15.0
- DSCR +9.0/10.0
- Appreciation +8.9/10.0
- 1% rule +7.0/10.0
- Schools +4.2/10.0
- Livability +2.8/5.0
- Rent growth +2.5/5.0
- Condition / age +2.2/5.0
$99,000
🖨 Deal sheet (PDF) 📄 Offer letter ✓ Due diligence
Listing remarks
Affordable opportunity in Nelliston! This three-bedroom, one-bath home is priced to sell and offers great potential for the right buyer. Featuring a first-floor washer and dryer hookup for added convenience, this home also includes exterior siding and a generously deep backyard--perfect for outdoor enjoyment, gardening, or entertaining. While the property could use a little sprucing up, it offers solid value and a great foundation to make it your own. Whether you're looking for a starter home, investment property, or a place to customize, this is a smart buy with plenty of upside. Don't miss your chance to own at an affordable price point in a convenient location.
Key facts
- Exterior siding
- Deep backyard
- 0.39 acre lot
Tags
Property features AI
Exterior
- Parking: 3 total parking spaces
- Utilities: Public water; Public sewer; Circuit breaker electrical
- Home design: Single family residence; One or more stories (multi-level with main and second levels)
- Construction: Vinyl siding
- Exterior features: Asphalt roof; Cable service available
Interior
- Kitchen: Oven; Range
- Bedrooms: Three bedrooms on the second level
- Flooring: Laminate
- Bathrooms: One full bathroom (on the second level)
- Heating & cooling: Forced air heating; Natural gas heating
- Interior features: 7 total rooms; Full basement
- Laundry & utility: Main level laundry
Neighborhood map
What this means for you Summary
Snapshot
- This is a 3-bed/1.0-bath single-family listed at $99k. Condition is rated fair.
Deal economics
- At list price, monthly cash flow is $258 ($3k/yr) — positive.
- The deal already cash-flows at list — no discount required.
- Meets the 1% rule at list price ($1k rent vs $99k).
Location & tenants
- Location reads 55/100 on livability (#1,129 in NY) — a working-class tenant base; expect higher turnover. Strengths: cost of living A+; Watch: health & safety C-, schools F, crime F.
- Fort Plain Central School District (rural): math 43% / reading 57% proficiency, ranked #401 of 590 in NY (top 68%) — acceptable for families but not a draw, mixed tenant base, ~2y average lease.
- Market conditions: 3 active listings in the ZIP; 210 units permitted in Montgomery County in 2024 (168 in 5+ unit buildings).
Forward outlook
- In year one you build about $8k of equity ($684 loan paydown + $8k appreciation (7.9% local appreciation)).
- Montgomery County population projected at -11% by 2050 — secular population decline; favor cash flow + early exit over multi-decade hold.
- At projected returns (7.9% appreciation + 3.0% rent growth), your $28k cash investment doubles in ~3 years — after that, you're playing with house money.
- By year 5, paydown + projected appreciation supports a ~$38k cash-out refi (75% LTV) — recoverable capital for the next deal without selling this one.
Negotiation context
- Only 3 days on market — expect competitive offers; lowballing is unlikely to land.
Risks & watch-outs
- Watch-outs: built in 1890 — expect roof / HVAC / electrical / plumbing capex.
Questions for the listing agent
- Have any recent inspections been done? Can we get a copy of the seller's disclosures and any deferred-maintenance estimates?
- Built in 1890 — when were the roof, HVAC, electrical panel, plumbing, and water heater last replaced?
- Is there a deadline driving the sale (1031 exchange, divorce, estate, relocation)? That informs how much negotiation room exists.
- Schools are F-rated, which usually means shorter tenancies and higher turnover. Who's the typical renter profile here, and what's been the actual vacancy rate?
- Crime grade is F in this area — have there been break-ins, vandalism, or insurance claims at this property in the last 3 years? What carrier currently insures it and at what premium?
- What's the average days-on-market for RENTAL listings here right now (not sales)? A rising rental-DOM trend means longer vacancies and softer asking-rent achievability than the comps imply.
- What's the recent tenant-quality profile in this submarket — average credit score on applications, eviction rate, late-payment / NSF rate, and stable-employment percentage? A property-management company in the area should have these aggregated.
- How much new for-sale + rental construction is in the pipeline within 1–3 miles? Heavy new supply typically softens prices + rents 12–24 months out; constrained supply supports both.
Investment metrics
- 1% rule
- 1.20% ✓
- Cap rate
- 9.42%
- Cash-on-cash
- 11.17%
- DSCR
- 1.50
- GRM
- 6.9
CMA / ARV
- ARV (on-the-fly)
- $119,016
- Comps found
- 4
Show comp detail 4 sales within ~0.75 mi
| Address | Dist | Beds/Ba | Sqft | Sold | Price | $/sf | Match |
|---|---|---|---|---|---|---|---|
| 24 Prospect St | 0.12mi | 2/1.0 (-1) | 1,442 (+5%) | 22mo | $125,000 | $87 | 62 |
| 30 Prospect St | 0.15mi | 3/2.0 | 1,516 (+11%) | 12mo | $100,000 | $66 | 61 |
| 5 Berthoud St | 0.13mi | 4/2.0 (+1) | 1,518 (+11%) | 16mo | $205,000 | $135 | 53 |
| 54 Hancock St | 0.73mi | 2/1.0 (-1) | 1,323 (-3%) | 10mo | $115,000 | $87 | 47 |
Match score weights: distance 35% · size 25% · config 20% · recency 20%. Top-matched comps best support the ARV.
Projected returns pro-forma
7.86% appreciation · 3.0% rent growth · sell at horizon
- IRR
- 28.4%
- Equity multiple
- 3.03×
- Total profit
- $56,322
- Equity at exit
- $74,248
- IRR
- 25.5%
- Equity multiple
- 6.46×
- Total profit
- $151,216
- Equity at exit
- $146,471
Cash invested: $27,720 (down + closing). Projections, not guarantees.
Landlord ↔ Tenant lean methodology
- Overall (STATE)
- 15 Strongly Tenant-Friendly
- State New York
- 15 Strongly Tenant-Friendly · D+10
- County
- — inherits STATE
- City
- — inherits STATE
ZIP-level market 13410
- Home prices YoY
- 1.8%
- Active inventory
- 3
- Price-to-rent
- 6.9×
Monthly cashflow live
- Estimated rent
- $1,193 medium interval (Pro) →
- Mortgage (P&I)
- −$519
- Tax est. 1.5%
- −$124 /mo · $1,485/yr
- Insurance
- −$41
- HOA
- −$0
- Vacancy / Maint / Mgmt
- −$250
- Net cashflow
- $258
Break-even live
Sensitivity live
| Price | -10% $326 | -5% $292 | +0% $258 | +5% $224 | +10% $190 |
|---|---|---|---|---|---|
| Rent | -10% $164 | -5% $211 | +0% $258 | +5% $305 | +10% $352 |
| Rate | -1.0pp $308 | -0.5pp $283 | base $258 | +0.5pp $232 | +1.0pp $206 |
UW: 25.0% down · 7.5% · 30yr · 1.5% tax · 5.0% vac · 8.0% maint · 8.0% mgmt
Financing live
Cash to close
- Down payment
- $24,750
- Closing costs
- $2,970
- Reserves months
- —
- Total cash needed
- —
Loan-product check · same deal, 3 products live
Conventional
25% down · 7.5% · 30yr
- Down + closing
- —
- Monthly P&I
- —
- Monthly cashflow
- —
- DSCR
- —
- Eligible?
- —
Personal DTI + credit; lowest rate.
DSCR
20% down · 8.5% · 30yr
- Down + closing
- —
- Monthly P&I
- —
- Monthly cashflow
- —
- DSCR
- —
- Eligible?
- —
No personal income docs; deal must DSCR.
Hard money
10% down · 12.0% · 12mo
- Down + closing
- —
- Monthly P&I
- —
- Monthly cashflow
- —
- DSCR
- —
- Eligible?
- —
Short-term bridge; refi at stabilization.
Listing history 2 events
-
2026-04-30status Pending
-
2026-04-26$99,000 Active
ⓘ Source: listings_history table (triggers on properties + properties_extension) + one-shot
backfill from property_details.listing_events for pre-trigger history.
Climate risk First Street
- Flood 1/10 Low FEMA zone X (unshaded) · 0% chance over 30 yrs
- Wildfire 1/10 Low
- Heat 3/10 Moderate 7 d/yr ≥96°F today · 16 d/yr by 30 yrs out
- Wind 2/10 Low 2% chance of damaging wind over 30 yrs
- Air quality 1/10 Low 0 unhealthy d/yr today · 0 by 30 yrs out
Nearby sold comps map
Loading sold comps map…
Walkable amenities ~0.75 mi
Loading nearby amenities…
Taxation est. · year 1
- Rental income
- $14,310
- − Mortgage interest
- −$5,546
- − Property taxes
- −$1,485
- − Insurance
- −$495
- − Repairs & maintenance
- −$1,145
- − Management
- −$1,145
- − Depreciation
- −$2,880
- Taxable income
- $1,615
- Est. tax owed @ 24.0%
- −$388
- After-tax cash flow
- $2,708/yr
For passive investors: Depreciation is non-cash, so a rental often shows a tax loss while cash-flowing — sheltering income. Rental losses are passive: they offset passive income freely, and up to $25,000/yr can offset ordinary (W-2) income if you actively participate and your MAGI is under $100k (phasing out to $0 by $150k); unused losses carry forward. On sale, claimed depreciation is recaptured at up to 25%, and gains may owe capital-gains tax (a 1031 exchange can defer both). Figures are a year-1 estimate at your 24.0% rate — not tax advice; consult a CPA.
Condition & rehab AI · 14 photos
This three-bedroom home presents a moderate renovation opportunity with potential for significant value increase through updates to the exterior, interior, and appliances.
Repairs flagged
- Major Paint — The paint appears faded and needs to be refreshed.
- Major Appliances — The appliances in the kitchen appear outdated and need to be replaced.
- Major Bathroom Fixtures — The bathroom appears unfinished and in need of updates.
Value-add opportunities
- Resale Painting the exterior and interior — Fresh paint can significantly improve the curb appeal and overall look of the home.
- Resale Upgrading the appliances — Modern appliances can attract more buyers and increase the home's value.
- Resale Completing the bathroom — A fully functional and updated bathroom is a key selling point for potential buyers.
Renovation cost estimate screening
| Repair item | Severity | Est. cost |
|---|---|---|
| Paint · The paint appears faded and needs to be refreshed. | Major | $15,000–50,000 |
| Appliances · The appliances in the kitchen appear outdated and need to be replaced. | Major | $15,000–50,000 |
| Bathroom Fixtures · The bathroom appears unfinished and in need of updates. | Major | $15,000–50,000 |
| Total estimated repair cost · 3 items | $45,000–150,000 |
Value-add ROI direction
- Resale Painting the exterior and interior — Fresh paint can significantly improve the curb appeal and overall look of the home. ↑
- Resale Upgrading the appliances — Modern appliances can attract more buyers and increase the home's value. ↑
- Resale Completing the bathroom — A fully functional and updated bathroom is a key selling point for potential buyers. ↑
ⓘ Cost ranges are severity-bucket heuristics (US national rule-of-thumb). Get contractor quotes + a written scope before underwriting a rehab budget.
Schools (NCES district)
- District
- Fort Plain Central School District
- NCES district ID
- 3611370
- Math proficiency
- 43% ▲ 4.00%
- Reading proficiency
- 57% ▲ 18.00%
- Median HH income
- $41,754
- Composite
- 41.94/100
- National rank
- #3352
- State rank
- #401 of 590 in NY
Livability — Nelliston
- Score
- 55/100
- State rank
- #1129
- US rank
- #23294
Category grades
Schools grade is shown separately in the Schools card above.
Census & demographics
- Census place
- Nelliston, NY
- City population
- 575
- Population (ZIP)
- 575
Population outlook (Montgomery County) Hauer SSP2
- Today (2025)
- 48,683 people
- By 2030
- 47,785 · -1.8%
- By 2040
- 45,492 · -6.6%
- By 2050
- 43,161 · -11.3%
- By 2075
- 38,134 · -21.7%
- By 2100
- 32,337 · -33.6%
Race, ethnicity, and origin ACS 2023
- Neighborhood character
- Predominantly White (84%)
- Race & ethnicity
- White 84% Two or more races 13% Hispanic / Latino 3%
- Common ancestry
- Iranian 11% Romanian 4% Italian 3%
- Foreign-born
- 1%
- Languages at home
- 98% English-only · French/Haitian/Cajun 1% Russian/Polish/Slavic 1%
Political lean MEDSL · Montgomery
- 2024 margin
- Strong R (+28.7) · D 35.6% · R 64.4%
- 2008→2024 swing
- -20.6pp toward R · 2008: -8.1pp · 2024: -28.7pp
- All cycles
- 2024: R+28.7 2020: R+22.6 2016: R+26.5 2012: R+4.4 2008: R+8.1
Not yet ingested
- Civics
- —
Market trends
- HPI YoY
- ▲ 7.86%
- Current HPI
- 437.5677
- Rent YoY
- —
- Metro
- —
- State GDP YoY
- ▲ 2.60%
- F500 in state
- 92
Industry mix (Fortune 500 HQ in NY)
| Industry | F500 HQs | Revenue |
|---|---|---|
| Financial Services | 10 | $950B |
|
||
| Consumer Goods | 9 | $162B |
|
||
| Insurance | 4 | $225B |
|
||
| Telecommunications | 2 | $144B |
|
||
| Pharmaceuticals | 2 | $112B |
|
||
| Media / Entertainment | 2 | $69B |
|
||
Price history
2 events — show timeline
- 2026-04-30 Pending — Global MLS
- 2026-04-26 Listed $99,000 Global MLS
Cash-flow waterfall
monthlySold comps — $/sqft
last 12 mo · ≤1 miLoading sold comps…