 10-Plex
85 N Main St · Walton, KY
Flood risk No data
- FEMA flood zone
- —
- Chance of flooding over 30 yrs
- —
- Est. flood insurance / yr
- —
Fire risk No data
- Est. fire insurance / yr
- —
Heat risk No data
- Hot days now (above threshold)
- —
- Hot days in 30 yrs
- —
Wind risk No data
- Chance of severe wind over 30 yrs
- —
Air-quality risk No data
- Unhealthy air days now
- —
- Unhealthy air days in 30 yrs
- —
Risk factors via First Street. Map © Google.
Why this score? — see what drove the B- grade
The composite is a weighted blend of 9 inputs, each scored 0–100. Each bar is that input's sub-score; the figure is the points it added to the 100-point composite (weight × sub-score).
- Cash flow +30.0/30.0
- 1% rule +10.0/10.0
- DSCR +10.0/10.0
- ARV discount +7.5/15.0
- Schools +3.8/10.0
- Livability +3.7/5.0
- Rent growth +2.5/5.0
- Condition / age +2.5/5.0
- Appreciation +0.0/10.0
$374,900
🖨 Deal sheet (PDF) 📄 Offer letter ✓ Due diligence
Multi-family units
County records classify this as Multi-Family (5+ Unit). Listing-text estimate: 10 units. confirmed
5+ unit building — per-unit beds/baths from public records are typically unavailable; the breakdown below (if shown) is an estimate from the listing text.
Listing remarks
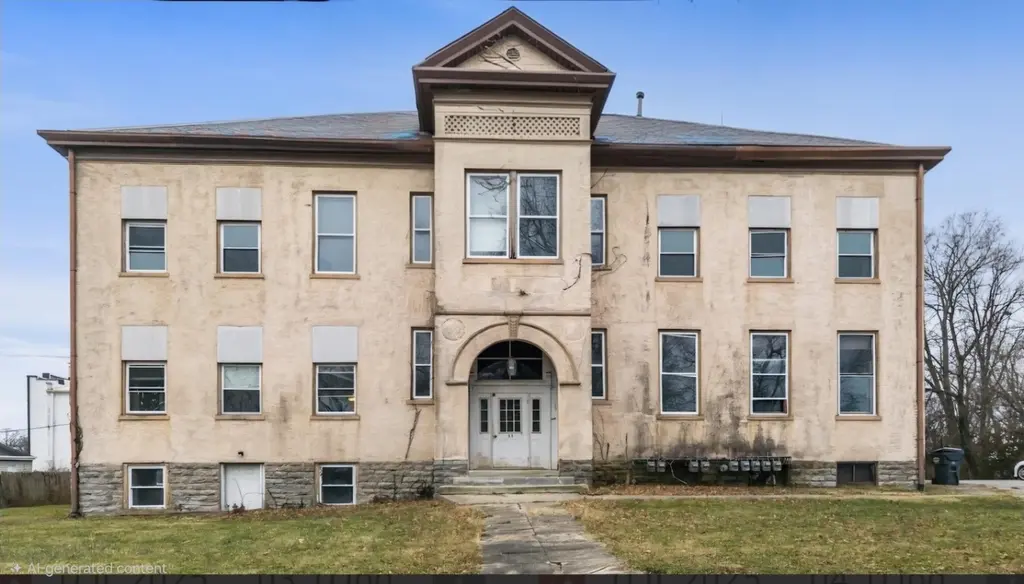
Discover an exceptional investment opportunity in the heart of Walton, Kentucky! This 10-unit multifamily property, featuring a mix of 7 two-bedroom and 3 one-bedroom apartments, is perfectly positioned on N Main Street. Structurally sound with plenty of parking! Residents will enjoy easy access to local amenities, schools, and the highway. This building has a rich history in the city of Walton, as it was formerly the Walton School, serving the Walton Independent School District! New meters, valves, and shut off were replaced in 2024. The gas line has also been replaced to the street. This property presents a significant value-add opportunity. Currently, the building has been fully gutted,
Key facts
- Gas line replaced
- Multifamily property
- Plenty of parking
Tags
Property features AI
Finance
- Financial info: 10 total units
Exterior
- Parking: Parking lot
- Utilities: Public water; Public sewer; Natural gas available
- Home design: Multi-family property; Apartment subtype; Two levels
- Construction: Brick construction; Block and stone foundation; Built as existing structure
- Exterior features: Shingle roof; Irregular lot shape (per record)
Interior
- Heating & cooling: Central air conditioning; Heating present
- Interior features: Full basement
Neighborhood map
What this means for you Summary
Snapshot
- This is a 7×2bd/1ba + 3×1bd/1ba units multifamily listed at $375k.
Deal economics
- At list price, monthly cash flow is $6k ($72k/yr) — positive. Per door: $599/mo.
- The deal already cash-flows at list — no discount required.
- Meets the 1% rule at list price ($11k rent vs $375k).
- Recommended offer: $369k (1.5% below list) — sets the bar for market timing.
- Cap rate 25.5% vs local median 2.8% in Walton — top-decile yield for the area; either an underpriced asset or a hidden risk that comps aren't pricing in. Stress-test before assuming the spread holds.
Location & tenants
- Location reads 73/100 on livability (#115 in KY, #4,981 nationally) — a middle-class / working-renter tenant base. Strengths: crime A+, cost of living A+, housing A+; Watch: amenities F, commute F, health & safety F.
- Walton-Verona Independent (rural): math 37% / reading 48% proficiency, ranked #23 of 165 in KY (top 14%) — families likely to look elsewhere, expect single-tenant / working-renter base with shorter leases.
- Zoned schools: Walton-Verona Elementary School (math 52% / reading 48%, grade D+, #98 of 676 statewide, top 15%, 734 students, 38% FRL); Walton-Verona Middle School (math 31% / reading 49%, grade F, #59 of 217 statewide, top 29%, 547 students, 34% FRL); Walton-Verona High School (math 37% / reading 42%, grade F, #40 of 254 statewide, top 19%, 549 students, 30% FRL) — zoned schools at 34% FRL track the district average.
- Market conditions: 183 active listings in the ZIP; 1,430 units permitted in Boone County in 2024 (928 in 5+ unit buildings).
Forward outlook
- Local home prices are declining (-3.0%/yr); year-one equity from $3k of loan paydown is wiped out by about $11k of value loss. Plan a longer hold.
- Boone County population projected at +24% by 2050 — long-run rental-demand tailwind backs the buy-and-hold thesis.
- At projected returns (-3.0% appreciation + 3.0% rent growth), your $105k cash investment doubles in ~2 years — after that, you're playing with house money.
Negotiation context
- It's been on market 20 days — a 2% lower offer ($369k) is reasonable based on typical stale-listing flexibility.
- 2 sale attempts; this cycle's ask has dropped $125k (25%) from the opening price — seller is motivated, your offer sets the floor, not the list.
- Current owner paid $250k; 50% above their basis — modest negotiation headroom, anchor on the comps not their cost.
Questions for the listing agent
- Can we see the unit-by-unit rent roll, current vacancy, and any below-market leases? What's the average tenancy length?
- What capital expenditures (roof, boiler, parking lot, exteriors) have been made in the last 5 years, and what's planned in the next 2?
- Built in 1970 — when were the roof, HVAC, electrical panel, plumbing, and water heater last replaced?
- Is there a deadline driving the sale (1031 exchange, divorce, estate, relocation)? That informs how much negotiation room exists.
- Schools are B-rated — typically a magnet for longer-tenancy family renters. What's the average tenant stay here, and is there a school-zone premium baked into asking?
- What's the average days-on-market for RENTAL listings here right now (not sales)? A rising rental-DOM trend means longer vacancies and softer asking-rent achievability than the comps imply.
- What's the recent tenant-quality profile in this submarket — average credit score on applications, eviction rate, late-payment / NSF rate, and stable-employment percentage? A property-management company in the area should have these aggregated.
- How much new apartment / multifamily construction is in the pipeline within 1–3 miles? Heavy new supply (>2% of stock underway) typically softens rents 12–24 months out; light construction supports rent growth.
Investment metrics
- 1% rule
- 2.87% ✓
- Cap rate
- 25.46%
- Cash-on-cash
- 68.44%
- DSCR
- 4.05
- GRM
- 2.9
CMA / ARV
No comps found within radius.
Projected returns pro-forma
-3.0% appreciation · 3.0% rent growth · sell at horizon
- IRR
- 67.9%
- Equity multiple
- 4.05×
- Total profit
- $320,682
- Equity at exit
- $55,899
- IRR
- 72.0%
- Equity multiple
- 8.34×
- Total profit
- $770,717
- Equity at exit
- $32,415
Cash invested: $104,972 (down + closing). Projections, not guarantees.
Landlord ↔ Tenant lean methodology
- Overall (STATE)
- 83 Strongly Landlord-Friendly
- State Kentucky
- 83 Strongly Landlord-Friendly · R+16
- County
- — inherits STATE
- City
- — inherits STATE
ZIP-level market 41094
- Home prices YoY
- -28.1%
- Active inventory
- 183
- Price-to-rent
- 29.0×
Monthly cashflow live
- Estimated rent
- $10,760 medium interval (Pro) →
- Mortgage (P&I)
- −$1,966
- Tax from tax record
- −$391 /mo · $4,694/yr
- Insurance
- −$156
- HOA
- −$0
- Vacancy / Maint / Mgmt
- −$2,260
- Net cashflow
- $5,987
Break-even live
Sensitivity live
| Price | -10% $6,199 | -5% $6,093 | +0% $5,987 | +5% $5,881 | +10% $5,775 |
|---|---|---|---|---|---|
| Rent | -10% $5,137 | -5% $5,562 | +0% $5,987 | +5% $6,412 | +10% $6,837 |
| Rate | -1.0pp $6,176 | -0.5pp $6,082 | base $5,987 | +0.5pp $5,890 | +1.0pp $5,791 |
10-unit breakdown (identical units grouped — click to expand)
| Units | Beds | Baths | Est. rent |
|---|---|---|---|
| 7× units | 2 | 1 | $7,532 |
| #1 | 2 | 1 | $1,076 |
| #2 | 2 | 1 | $1,076 |
| #3 | 2 | 1 | $1,076 |
| #4 | 2 | 1 | $1,076 |
| #5 | 2 | 1 | $1,076 |
| #6 | 2 | 1 | $1,076 |
| #7 | 2 | 1 | $1,076 |
| 3× units | 1 | 1 | $3,228 |
| #8 | 1 | 1 | $1,076 |
| #9 | 1 | 1 | $1,076 |
| #10 | 1 | 1 | $1,076 |
| Total (10 units) | $10,760 | ||
UW: 25.0% down · 7.5% · 30yr · 1.5% tax · 5.0% vac · 8.0% maint · 8.0% mgmt
Financing live
Cash to close
- Down payment
- $93,725
- Closing costs
- $11,247
- Reserves months
- —
- Total cash needed
- —
Loan-product check · same deal, 3 products live
Conventional
25% down · 7.5% · 30yr
- Down + closing
- —
- Monthly P&I
- —
- Monthly cashflow
- —
- DSCR
- —
- Eligible?
- —
Personal DTI + credit; lowest rate.
DSCR
20% down · 8.5% · 30yr
- Down + closing
- —
- Monthly P&I
- —
- Monthly cashflow
- —
- DSCR
- —
- Eligible?
- —
No personal income docs; deal must DSCR.
Hard money
10% down · 12.0% · 12mo
- Down + closing
- —
- Monthly P&I
- —
- Monthly cashflow
- —
- DSCR
- —
- Eligible?
- —
Short-term bridge; refi at stabilization.
Listing history 25 events
-
2026-06-22days on market $374,900 Active 20 DOM
-
2026-06-21days on market $374,900 Active 19 DOM
-
2026-06-21days on market $374,900 Active 18 DOM
-
2026-06-18days on market $374,900 Active 16 DOM
-
2026-06-17days on market $374,900 Active 15 DOM
-
2026-06-16days on market $374,900 Active 14 DOM
-
2026-06-15days on market $374,900 Active 13 DOM
-
2026-06-13days on market $374,900 Active 11 DOM
-
2026-06-12days on market $374,900 Active 10 DOM
-
2026-06-09days on market $374,900 Active 7 DOM
-
2026-06-08days on market $374,900 Active 6 DOM
-
2026-06-07days on market $374,900 Active 5 DOM
-
2026-06-07days on market $374,900 Active 4 DOM
-
2026-06-02days on market $374,900 Active 1 DOM
-
2026-06-01days on market $374,900 Active 117 DOM
-
2026-05-31days on market $374,900 Active 116 DOM
-
2026-05-31days on market $374,900 Active 115 DOM
-
2026-05-18price $374,900
-
2026-05-13status Active
-
2026-04-14status Pending
-
2026-04-07price $399,000
-
2026-02-13price $449,000
-
2026-01-06$499,900 Active
-
2024-08-02soldstatus $250,000
-
1996-08-20soldstatus $181,500
ⓘ Source: listings_history table (triggers on properties + properties_extension) + one-shot
backfill from property_details.listing_events for pre-trigger history.
Tax reassessment forecast KY · Resets to sale price
- Current annual tax
- $4,694 · $391/mo
- Projected year-2 tax
- $4,694 · $391/mo
- Expected delta
- $0/yr ($0/mo · 0.0%)
ⓘ Screening estimate from a state-policy table — verify with the county assessor before closing.
Nearby sold comps map
Loading sold comps map…
Walkable amenities ~0.75 mi
Loading nearby amenities…
Taxation est. · year 1
- Rental income
- $129,120
- − Mortgage interest
- −$21,000
- − Property taxes
- −$4,694
- − Insurance
- −$1,874
- − Repairs & maintenance
- −$10,330
- − Management
- −$10,330
- − Depreciation
- −$10,906
- Taxable income
- $69,986
- Est. tax owed @ 24.0%
- −$16,797
- After-tax cash flow
- $55,048/yr
For passive investors: Depreciation is non-cash, so a rental often shows a tax loss while cash-flowing — sheltering income. Rental losses are passive: they offset passive income freely, and up to $25,000/yr can offset ordinary (W-2) income if you actively participate and your MAGI is under $100k (phasing out to $0 by $150k); unused losses carry forward. On sale, claimed depreciation is recaptured at up to 25%, and gains may owe capital-gains tax (a 1031 exchange can defer both). Figures are a year-1 estimate at your 24.0% rate — not tax advice; consult a CPA.
Schools (NCES district)
- District
- Walton-Verona Independent
- NCES district ID
- 2105700
- Math proficiency
- 37% ▼ -13.00%
- Reading proficiency
- 48% ▼ -16.00%
- Median HH income
- $62,603
- Composite
- 37.73/100
- National rank
- #4354
- State rank
- #23 of 165 in KY
Livability — Walton
- Score
- 73/100
- State rank
- #115
- US rank
- #4981
Category grades
Schools grade is shown separately in the Schools card above.
Census & demographics
- Census place
- Walton, KY
- Population (ZIP)
- 14,798
Population outlook (Boone County) Hauer SSP2
- Today (2025)
- 144,066 people
- By 2030
- 152,005 · +5.5%
- By 2040
- 166,776 · +15.8%
- By 2050
- 178,974 · +24.2%
- By 2075
- 204,515 · +42.0%
- By 2100
- 215,306 · +49.4%
Race, ethnicity, and origin ACS 2023
- Neighborhood character
- Predominantly White (89%)
- Race & ethnicity
- White 89% Two or more races 5% Hispanic / Latino 4% Pacific Islander 1%
- Common ancestry
- Slovak 1% Iranian 1% Lithuanian 1%
- Foreign-born
- 3% · Canada
- Languages at home
- 94% English-only · Spanish 3% Other Asian/Pacific 1% Russian/Polish/Slavic 1%
Political lean MEDSL · Boone
- 2024 margin
- Solid R (+37.2) · D 30.6% · R 67.8% · Other 1.7%
- 2008→2024 swing
- -2.7pp toward R · 2008: -34.5pp · 2024: -37.2pp
- All cycles
- 2024: R+37.2 2020: R+35.7 2016: R+41.8 2012: R+38.7 2008: R+34.5
Not yet ingested
- Civics
- —
Market trends
- HPI YoY
- ▼ -88.84%
- Current HPI
- 227.3544
- Rent YoY
- —
- Metro
- —
- State GDP YoY
- ▲ 1.81%
- F500 in state
- 4
Industry mix (Fortune 500 HQ in KY)
| Industry | F500 HQs | Revenue |
|---|---|---|
| Healthcare | 1 | $118B |
|
||
| Food / Beverage | 1 | $7B |
|
||
Price history
+106.6% since first listed8 events — show timeline
- 2026-05-18 Price Changed $374,900 NKMLS
- 2026-05-13 Relisted — NKMLS
- 2026-04-14 Pending — NKMLS
- 2026-04-07 Price Changed $399,000 NKMLS
- 2026-02-13 Price Changed $449,000 NKMLS
- 2026-01-06 Listed $499,900 NKMLS
- 2024-08-02 Sold (Public Records) $250,000 Public Records
- 1996-08-20 Sold (Public Records) $181,500 Public Records
Property tax history
+0.6%/yrLatest (2025): $4,694 · +8.0% YoY. Source: county tax records.
Cash-flow waterfall
monthlySold comps — $/sqft
last 12 mo · ≤1 miLoading sold comps…