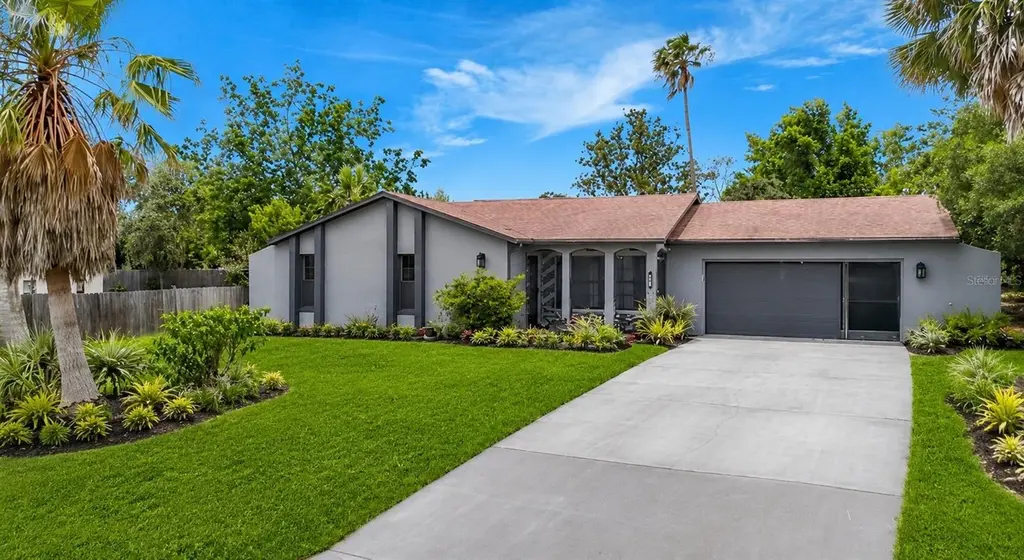
6391 Curtiss Ln · Spring Hill, FL
Flood risk 1/10 · Minimal
- FEMA flood zone
- X (unshaded)
- Chance of flooding over 30 yrs
- 0.0%
- Est. flood insurance / yr
- $507 – $1,088
Fire risk 5/10 · Moderate
- Est. fire insurance / yr
- $947 – $1,759
Heat risk 10/10 · Severe
- Hot days now (above 109°F)
- 7 days/yr
- Hot days in 30 yrs
- 26 days/yr
Wind risk 9/10 · Severe
- Chance of severe wind over 30 yrs
- 99.0%
Air-quality risk 2/10 · Minimal
- Unhealthy air days now
- 2 days/yr
- Unhealthy air days in 30 yrs
- 2 days/yr
Risk factors via First Street. Map © Google.
Why this score? — see what drove the D+ grade
The composite is a weighted blend of 9 inputs, each scored 0–100. Each bar is that input's sub-score; the figure is the points it added to the 100-point composite (weight × sub-score).
- Cash flow +15.4/30.0
- ARV discount +13.7/15.0
- DSCR +4.7/10.0
- Schools +4.2/10.0
- 1% rule +3.3/10.0
- Livability +3.2/5.0
- Condition / age +2.5/5.0
- Rent growth +2.3/5.0
- Appreciation +0.0/10.0
$259,000
🖨 Deal sheet (PDF) 📄 Offer letter ✓ Due diligence
Listing remarks MLS
ACTIVE WITH CONTRACT SHORT SALE-2/2/2 POOL HOME. Re-roof 2008. Pool refinished in 2012. This is a perfect home to enjoy the Florida Life style... Clean, well appointed home that has been well maintained. Great updated kitchen, designer baths, security system and Oversized screened lanai/pool enclosure. MOVE IN CONDITION-THIS ONE HAS IT ALL!
Key facts
- Large breakfast bar
- Spacious homesite
- Updated kitchen
Tags
Property features AI
Finance
- Other: Homestead exempt; Lot approximately 0.28 acres (1/4 to less than 1/2 acre)
- HOA & community: No association; Pets allowed
Exterior
- Parking: Attached garage; 2 garage spaces
- Utilities: Public water; Public sewer; Cable available; Electricity connected
- Home design: Single family residence; One story; Faces east; Residential property
- Construction: Block and stucco construction; Other construction materials; Other roof; Slab foundation; Built on one level
- Exterior features: Private in-ground pool; Storage; Other exterior features; Road surface: Other
Interior
- Kitchen: Dishwasher; Microwave; Refrigerator
- Bedrooms: 3 bedrooms
- Flooring: Other flooring
- Bathrooms: 2 full bathrooms
- Heating & cooling: Central heating; Central air conditioning
- Interior features: Ceiling fans
- Laundry & utility: Laundry area in garage
Neighborhood map
What this means for you Summary
Snapshot
- This is a 3-bed/2.0-bath single-family listed at $259k.
Deal economics
- At list price, monthly cash flow is $98 ($1k/yr) — positive.
- The deal already cash-flows at list — no discount required.
- To meet the 1% rule (rent ≥ 1% of price), the offer needs to be $214k (17.4% below list).
- Recommended offer: $214k (17.4% below list) — sets the bar for 1% rule.
- Cap rate 6.7% vs local median 4.4% in Spring Hill — top-decile yield for the area; either an underpriced asset or a hidden risk that comps aren't pricing in. Stress-test before assuming the spread holds.
Location & tenants
- Location reads 63/100 on livability (#738 in FL) — a middle-class / working-renter tenant base. Strengths: cost of living A+, housing A+; Watch: health & safety C-, employment D+, amenities F.
- Hernando (suburban): math 50% / reading 50% proficiency, ranked #38 of 73 in FL (top 52%) — acceptable for families but not a draw, mixed tenant base, ~2y average lease.
- Zoned schools: Pine Grove Elementary School (math 60% / reading 45%, grade C-, #976 of 2,144 statewide, top 46%, 991 students, 60% FRL); West Hernando Middle School (math 36% / reading 37%, grade F, #405 of 571 statewide, top 72%, 695 students, 58% FRL); Central High School (math 34% / reading 44%, grade F, #312 of 667 statewide, top 48%, 1,426 students, 53% FRL) — zoned schools at 57% FRL track the district average.
- Market conditions: Rents soft (-0.7%/yr); 389 active listings in the ZIP; 11 comparable units currently listed for rent nearby; rentals at typical pace (median 26d on market — plan ~3-4 weeks tenant-placement turnaround); 2,505 units permitted in Hernando County in 2024 (318 in 5+ unit buildings).
- This rent runs 40% of the median local income ($64k/yr) — at the standard rent-burdened threshold; future hikes will face affordability resistance.
Forward outlook
- Local home prices are declining (-3.0%/yr); year-one equity from $2k of loan paydown is wiped out by about $8k of value loss. Plan a longer hold.
- Hernando County population projected at +11% by 2050 — modest demand growth; plan on rents tracking national, not racing it.
Negotiation context
- It's been on market 19 days — a 2% lower offer ($255k) is reasonable based on typical stale-listing flexibility.
- 5 sale attempts since 21y ago with the ask held roughly flat each time — persistent listings suggest the price (not the market) is what's stuck; bring a comps-based counter.
- Current owner paid $82k; list at $259k implies a 215% gain — meaningful room to come down on a strong offer.
Risks & watch-outs
- Climate carrying-cost: severe wind risk, 99% chance of damaging wind over 30y; moderate wildfire risk; extreme-heat days projected 7→26/yr by 2055 (HVAC capex compounding) — expect insurance premiums to compound above CPI over the hold.
Questions for the listing agent
- Is there a deadline driving the sale (1031 exchange, divorce, estate, relocation)? That informs how much negotiation room exists.
- The area grade is low — what's the realistic commute time and amenity access for the typical tenant pool here? Any planned neighborhood developments (good or bad) we should know about?
- What's the average days-on-market for RENTAL listings here right now (not sales)? A rising rental-DOM trend means longer vacancies and softer asking-rent achievability than the comps imply.
- What's the recent tenant-quality profile in this submarket — average credit score on applications, eviction rate, late-payment / NSF rate, and stable-employment percentage? A property-management company in the area should have these aggregated.
- How much new for-sale + rental construction is in the pipeline within 1–3 miles? Heavy new supply typically softens prices + rents 12–24 months out; constrained supply supports both.
Investment metrics
- 1% rule
- 0.83% ✗
- Cap rate
- 6.75%
- Cash-on-cash
- 1.62%
- DSCR
- 1.07
- GRM
- 10.1
CMA / ARV
- ARV (on-the-fly)
- $300,124
- Comps found
- 12
Show comp detail 12 sales within ~0.75 mi
| Address | Dist | Beds/Ba | Sqft | Sold | Price | $/sf | Match |
|---|---|---|---|---|---|---|---|
| 7048 Oberon Ave | 0.29mi | 3/2.0 | 1,378 (-4%) | 5mo | $277,000 | $201 | 76 |
| 12420 Lombardy St | 0.14mi | 3/2.0 | 1,276 (-11%) | 2mo | $274,000 | $215 | 74 |
| 12424 Penton St | 0.32mi | 3/2.0 | 1,539 (+7%) | 4mo | $259,000 | $168 | 69 |
| 12474 Seybold Dr | 0.24mi | 3/2.0 | 1,580 (+10%) | 4mo | $330,000 | $209 | 69 |
| 12439 Hanley Dr | 0.17mi | 3/2.0 | 1,624 (+13%) | 3mo | $318,000 | $196 | 68 |
| 13055 Santee St | 0.58mi | 3/2.0 | 1,495 (+4%) | 3mo | $330,000 | $221 | 64 |
| 13045 Santee St | 0.57mi | 3/2.0 | 1,524 (+6%) | 2mo | $325,000 | $213 | 62 |
| 13143 Lawrence St | 0.63mi | 2/2.0 (-1) | 1,355 (-6%) | 0mo | $235,000 | $173 | 56 |
| 13040 Hanley Dr | 0.31mi | 4/2.0 (+1) | 1,646 (+15%) | 2mo | $349,900 | $213 | 55 |
| 6202 Covewood Dr | 0.53mi | 3/2.0 | 1,287 (-10%) | 4mo | $258,000 | $200 | 55 |
| 12271 Katherwood St | 0.53mi | 3/2.0 | 1,611 (+12%) | 2mo | $309,000 | $192 | 53 |
| 6310 Gainsboro Ave | 0.56mi | 2/2.0 (-1) | 1,320 (-8%) | 8mo | $287,500 | $218 | 49 |
Match score weights: distance 35% · size 25% · config 20% · recency 20%. Top-matched comps best support the ARV.
Projected returns pro-forma
-3.0% appreciation · 0.0% rent growth · sell at horizon
- IRR
- -16.8%
- Equity multiple
- 0.42×
- Total profit
- $-42,106
- Equity at exit
- $38,618
- IRR
- -14.6%
- Equity multiple
- 0.27×
- Total profit
- $-53,238
- Equity at exit
- $22,394
Cash invested: $72,520 (down + closing). Projections, not guarantees.
Landlord ↔ Tenant lean methodology
- Overall (STATE)
- 87 Strongly Landlord-Friendly
- State Florida
- 87 Strongly Landlord-Friendly · R+3
- County
- — inherits STATE
- City
- — inherits STATE
ZIP-level market 34608
- Home prices YoY
- -24.7%
- Rents YoY
- -0.7%
- Active inventory
- 389
- Price-to-rent
- 10.1×
Monthly cashflow live
- Estimated rent
- $2,138 high interval (Pro) →
- Mortgage (P&I)
- −$1,358
- Tax from tax record
- −$125 /mo · $1,506/yr
- Insurance
- −$108
- HOA
- −$0
- Vacancy / Maint / Mgmt
- −$449
- Net cashflow
- $98
Break-even live
Sensitivity live
| Price | -10% $244 | -5% $171 | +0% $98 | +5% $24 | +10% $-49 |
|---|---|---|---|---|---|
| Rent | -10% $-71 | -5% $13 | +0% $98 | +5% $182 | +10% $267 |
| Rate | -1.0pp $228 | -0.5pp $164 | base $98 | +0.5pp $31 | +1.0pp $-38 |
UW: 25.0% down · 7.5% · 30yr · 1.5% tax · 5.0% vac · 8.0% maint · 8.0% mgmt
Financing live
Cash to close
- Down payment
- $64,750
- Closing costs
- $7,770
- Reserves months
- —
- Total cash needed
- —
Loan-product check · same deal, 3 products live
Conventional
25% down · 7.5% · 30yr
- Down + closing
- —
- Monthly P&I
- —
- Monthly cashflow
- —
- DSCR
- —
- Eligible?
- —
Personal DTI + credit; lowest rate.
DSCR
20% down · 8.5% · 30yr
- Down + closing
- —
- Monthly P&I
- —
- Monthly cashflow
- —
- DSCR
- —
- Eligible?
- —
No personal income docs; deal must DSCR.
Hard money
10% down · 12.0% · 12mo
- Down + closing
- —
- Monthly P&I
- —
- Monthly cashflow
- —
- DSCR
- —
- Eligible?
- —
Short-term bridge; refi at stabilization.
Rent comps 11 comps
| Address | Beds | Baths | Sqft | Rent | $/sqft | DOM | Units | Dist |
|---|---|---|---|---|---|---|---|---|
| 6289 Mariner Blvd Spring Hill, FL | 3.0 | 2.0 | 1212 | $1,850 | $1.53 | 19d | 1 | 0.27mi |
| 13109 Lola Dr Spring Hill, FL | 2.0 | 2.0 | 1483 | $4,900 | $3.30 | 26d | 1 | 0.37mi |
| 13186 Thrush St Spring Hill, FL | 3.0 | 2.0 | 1114 | $1,950 | $1.75 | 26d | 1 | 0.46mi |
| 6372 Gainsboro Ave Spring Hill, FL | 3.0 | 2.0 | 1535 | $1,889 | $1.23 | 0d | 1 | 0.52mi |
| 13097 Scottville St Unit 1234463P Spring Hill, FL | 3.0 | 2.0 | 1463 | $3,918 | $2.68 | 1d | 1 | 0.80mi |
| 12454 Seagate St Spring Hill, FL | 3.0 | 2.0 | 1114 | $1,690 | $1.52 | 0d | 1 | 0.80mi |
| 5363 Pierpoint Ave Spring Hill, FL | 3.0 | 2.0 | 1722 | $2,200 | $1.28 | 26d | 1 | 1.18mi |
| 5327 Baldock Ave Spring Hill, FL | 3.0 | 2.0 | 1711 | $1,995 | $1.17 | 19d | 1 | 1.20mi |
| 12095 Elgin Blvd Spring Hill, FL | 3.0 | 2.0 | 1284 | $1,849 | $1.44 | 26d | 1 | 1.23mi |
| 7405 Western Circle Dr Brooksville, FL | 2.0 | 2.0 | 1442 | $1,500 | $1.04 | 26d | 1 | 1.32mi |
| 5294 Fairhaven Ave Spring Hill, FL | 2.0 | 2.0 | 1105 | $1,600 | $1.45 | 26d | 1 | 1.39mi |
Listing history 15 events
-
2026-06-21days on market $259,000 Active 19 DOM
-
2026-06-18price $259,000 Active 16 DOM
-
2026-06-18days on market $270,000 Active 16 DOM
-
2026-06-17days on market $270,000 Active 15 DOM
-
2026-06-16days on market $270,000 Active 14 DOM
-
2026-06-15price $270,000 Active 13 DOM
-
2026-06-15days on market $269,500 Active 13 DOM
-
2026-06-13days on market $269,500 Active 11 DOM
-
2026-06-13pricedays on market $269,500 Active 10 DOM
-
2026-06-09days on market $269,000 Active 7 DOM
-
2026-06-08days on market $269,000 Active 6 DOM
-
2026-06-07days on market $269,000 Active 5 DOM
-
2026-06-04days on market $269,000 Active 2 DOM
-
2026-06-02remarks 699-char remark
-
2026-06-02$269,000 Active 1 DOM
ⓘ Source: listings_history table (triggers on properties + properties_extension) + one-shot
backfill from property_details.listing_events for pre-trigger history.
Tax reassessment forecast FL · Resets to sale price
- Current annual tax
- $1,506 · $125/mo
- Projected year-2 tax
- $2,150 · $179/mo
- Expected delta
- +$644/yr (+$54/mo · 42.8%)
ⓘ Screening estimate from a state-policy table — verify with the county assessor before closing.
Climate risk First Street
- Flood 1/10 Low FEMA zone X (unshaded) · 0% chance over 30 yrs
- Wildfire 5/10 Major
- Heat 10/10 Extreme 7 d/yr ≥109°F today · 26 d/yr by 30 yrs out
- Wind 9/10 Extreme 99% chance of damaging wind over 30 yrs
- Air quality 2/10 Low 2 unhealthy d/yr today · 2 by 30 yrs out
Nearby sold comps map
Loading sold comps map…
Walkable amenities ~0.75 mi
Loading nearby amenities…
Taxation est. · year 1
- Rental income
- $25,660
- − Mortgage interest
- −$14,508
- − Property taxes
- −$1,506
- − Insurance
- −$1,295
- − Repairs & maintenance
- −$2,053
- − Management
- −$2,053
- − Depreciation
- −$7,535
- Taxable loss
- −$3,289
- Est. tax savings @ 24.0%
- +$789
- After-tax cash flow
- $1,961/yr
For passive investors: Depreciation is non-cash, so a rental often shows a tax loss while cash-flowing — sheltering income. Rental losses are passive: they offset passive income freely, and up to $25,000/yr can offset ordinary (W-2) income if you actively participate and your MAGI is under $100k (phasing out to $0 by $150k); unused losses carry forward. On sale, claimed depreciation is recaptured at up to 25%, and gains may owe capital-gains tax (a 1031 exchange can defer both). Figures are a year-1 estimate at your 24.0% rate — not tax advice; consult a CPA.
Schools (NCES district)
- District
- Hernando
- NCES district ID
- 1200810
- Math proficiency
- 50% ▼ -8.00%
- Reading proficiency
- 50% ▼ -4.00%
- Median HH income
- $41,985
- Composite
- 42.03/100
- National rank
- #3329
- State rank
- #38 of 73 in FL
Livability — Spring Hill
- Score
- 63/100
- State rank
- #738
- US rank
- #15937
Category grades
Schools grade is shown separately in the Schools card above.
Census & demographics
- Census place
- Spring Hill, FL
- County
- Hernando County · 169,677 people
- City population
- 83,915
- Metro
- Tampa-St. Petersburg-Clearwater, FL
- Population (ZIP)
- 36,658
- Household income
- $64,345
- Rent vs Own
- Severe rent burden
- 647.0
Population outlook (Hernando County) Hauer SSP2
- Today (2025)
- 189,218 people
- By 2030
- 194,367 · +2.7%
- By 2040
- 203,398 · +7.5%
- By 2050
- 209,589 · +10.8%
- By 2075
- 218,452 · +15.4%
- By 2100
- 205,923 · +8.8%
Race, ethnicity, and origin ACS 2023
- Neighborhood character
- Predominantly White (71%)
- Race & ethnicity
- White 71% Hispanic / Latino 18% Two or more races 11% Black 4% Asian 2%
- Hispanic origin (detail)
- Puerto Rican 9% Cuban 3%
- Common ancestry
- Slovak 4% Romanian 3% Lithuanian 3%
- Foreign-born
- 9% · Canada, Jamaica, China
- Languages at home
- 87% English-only · Spanish 9% Other Indo-European 2% French/Haitian/Cajun 1%
Political lean MEDSL · Hernando
- 2024 margin
- Solid R (+37.0) · D 31.1% · R 68.2%
- 2008→2024 swing
- -33.5pp toward R · 2008: -3.6pp · 2024: -37.0pp
- All cycles
- 2024: R+37.0 2020: R+30.2 2016: R+29.0 2012: R+8.5 2008: R+3.6
Not yet ingested
- Civics
- —
Market trends
- HPI YoY
- ▼ -99.94%
- Current HPI
- 305.1933
- Rent YoY
- ▼ -0.68%
- Metro
- Tampa-St. Petersburg-Clearwater, FL
- State GDP YoY
- ▲ 3.28%
- F500 in state
- 36
Industry mix (Fortune 500 HQ in FL)
| Industry | F500 HQs | Revenue |
|---|---|---|
| Industrial Technology | 2 | $29B |
|
||
| Insurance | 2 | $17B |
|
||
| Retail | 1 | $60B |
|
||
| Technology Distribution | 1 | $58B |
|
||
| Homebuilding | 1 | $35B |
|
||
| Technology Manufacturing | 1 | $35B |
|
||
Price history
+242.7% since first listed13 events — show timeline
- 2026-06-02 Listed $269,000 Stellar MLS as Distributed by MLS Grid
- 2019-11-11 Listing Removed — HCAR
- 2014-09-04 Sold (Public Records) $82,100 Public Records
- 2014-08-29 Sold (MLS) $82,100 St. Augustine and St. Johns County Board of REALTORS®
- 2014-08-29 Sold (MLS) $82,100 HCAR
- 2013-06-17 Listed $82,000 St. Augustine and St. Johns County Board of REALTORS®
- 2013-06-17 Listed $82,000 HCAR
- 2009-10-01 Listed $153,900 HCAR
- 2005-07-11 Sold (Public Records) $159,911 Public Records
- 2005-06-10 Sold (MLS) $159,900 HCAR
- 2005-03-28 Listed $159,900 HCAR
- 1998-11-05 Sold (Public Records) $72,500 Public Records
- 1989-06-01 Sold (Public Records) $78,500 Public Records
Property tax history
+5.9%/yrLatest (2025): $1,506 · +1.3% YoY. Source: county tax records.
Cash-flow waterfall
monthlySold comps — $/sqft
last 12 mo · ≤1 miLoading sold comps…