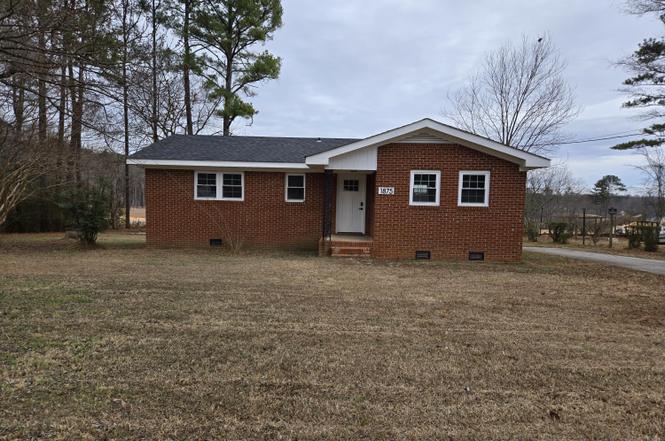
1875 Cedar Creek Rd · Franklinton, NC
Flood risk 1/10 · Minimal
- FEMA flood zone
- X (unshaded)
- Chance of flooding over 30 yrs
- 0.0%
- Est. flood insurance / yr
- $507 – $1,088
Fire risk 4/10 · Minor
- Est. fire insurance / yr
- $906 – $1,684
Heat risk 6/10 · Moderate
- Hot days now (above 105°F)
- 7 days/yr
- Hot days in 30 yrs
- 16 days/yr
Wind risk 6/10 · Moderate
- Chance of severe wind over 30 yrs
- 45.0%
Air-quality risk 2/10 · Minimal
- Unhealthy air days now
- 1 days/yr
- Unhealthy air days in 30 yrs
- 1 days/yr
Risk factors via First Street. Map © Google.
Why this score? — see what drove the D+ grade
The composite is a weighted blend of 9 inputs, each scored 0–100. Each bar is that input's sub-score; the figure is the points it added to the 100-point composite (weight × sub-score).
- ARV discount +10.5/15.0
- Cash flow +9.9/30.0
- Appreciation +9.2/10.0
- Livability +3.1/5.0
- Schools +3.0/10.0
- DSCR +2.8/10.0
- Rent growth +2.5/5.0
- Condition / age +2.5/5.0
- 1% rule +2.0/10.0
$253,000
🖨 Deal sheet (PDF) 📄 Offer letter ✓ Due diligence
Listing remarks
Cute as a button all-brick ranch set on a spacious half-acre lot, surrounded by upcoming beautiful new construction homes. The expansive yard offers endless possibilities—perfect for gardening, outdoor play, grilling, or relaxing on the deck. Step inside to find a thoughtfully updated interior featuring crisp white cabinetry, stainless steel appliances, and durable vinyl flooring throughout. Other updates include roof, windows, hot water heater, doors and lighting! Enjoy a fantastic location with easy access to area schools and a quick commute to downtown Youngsville and Franklinton. This charming home offers the perfect blend of comfort, style, and convenience—ready for you to
Key facts
- Updated interior
- Half acre lot
- 0.46 acre lot
Tags
Property features AI
Finance
- HOA & community: No homeowners association
Exterior
- Parking: Driveway
- Utilities: Well water; Septic tank
- Home design: Site-built single-level home; One story
- Construction: Brick construction; Shingle roof
- Exterior features: Deck
Interior
- Kitchen: Dishwasher; Electric range; Microwave; Refrigerator
- Bedrooms: 3 bedrooms (all on the main level)
- Flooring: Vinyl
- Bathrooms: 1 full bathroom
- Heating & cooling: Propane heating; Central air conditioning; Ceiling fan(s) for cooling
- Interior features: Ceiling fans; Entrance foyer
- Laundry & utility: Laundry closet
Neighborhood map
What this means for you Summary
Snapshot
- This is a 3-bed/1.0-bath single-family listed at $253k.
Deal economics
- At list price, monthly cash flow is $-159 ($-2k/yr) — negative.
- To cash-flow at today's rent, offer at most $225k (11.1% below list).
- To meet the 1% rule (rent ≥ 1% of price), the offer needs to be $178k (29.5% below list).
- Recommended offer: $178k (29.5% below list) — sets the bar for 1% rule.
- Cap rate 5.5% vs local median 3.1% in Franklinton — top-decile yield for the area; either an underpriced asset or a hidden risk that comps aren't pricing in. Stress-test before assuming the spread holds.
Location & tenants
- Location reads 61/100 on livability (#491 in NC) — a middle-class / working-renter tenant base. Strengths: cost of living A+, housing A+; Watch: crime D, amenities F, commute F.
- Franklin County Schools (rural): math 34% / reading 37% proficiency, ranked #128 of 178 in NC (top 72%) — families likely to look elsewhere, expect single-tenant / working-renter base with shorter leases.
- Zoned schools: Franklinton Elementary (math 29% / reading 25%, grade F, #1,033 of 1,410 statewide, top 76%, 522 students, 81% FRL); Cedar Creek Middle (math 32% / reading 37%, grade F, #292 of 475 statewide, top 62%, 515 students, 54% FRL); Franklinton High (math 57% / reading 60%, grade C, #235 of 535 statewide, top 45%, 1,182 students, 48% FRL).
- Market conditions: 251 active listings in the ZIP; 948 units permitted in Franklin County in 2024 (0 in 5+ unit buildings).
Forward outlook
- In year one you build about $23k of equity ($2k loan paydown + $21k appreciation (8.4% local appreciation)).
- Franklin County population projected at +13% by 2050 — modest demand growth; plan on rents tracking national, not racing it.
- By year 2, paydown + projected appreciation supports a ~$37k cash-out refi (75% LTV) — recoverable capital for the next deal without selling this one.
Negotiation context
- It's been on market 181 days — a 12% lower offer ($223k) is reasonable based on typical stale-listing flexibility.
- 5 sale attempts since 2y ago; this cycle's ask has dropped $17k (6%) from the opening price — seller is motivated, your offer sets the floor, not the list.
- Current owner paid $168k; list at $253k implies a 51% gain — meaningful room to come down on a strong offer.
Risks & watch-outs
- Climate carrying-cost: major wind risk, 45% chance of damaging wind over 30y; extreme-heat days projected 7→16/yr by 2055 (HVAC capex compounding) — expect insurance premiums to compound above CPI over the hold.
Questions for the listing agent
- What do current leases actually rent for vs. the listed asking? Can we see a recent rent roll and the last 12 months of T-12 income?
- It's been on market 181 days. Have you received any prior offers? Is the seller open to a 30% concession, seller financing, or rate buy-down credit?
- Built in 1970 — when were the roof, HVAC, electrical panel, plumbing, and water heater last replaced?
- Why hasn't it sold? Are there any deal-killer items the seller is aware of (foundation, flood, title, zoning, code violations)?
- Is there a deadline driving the sale (1031 exchange, divorce, estate, relocation)? That informs how much negotiation room exists.
- Schools are F-rated, which usually means shorter tenancies and higher turnover. Who's the typical renter profile here, and what's been the actual vacancy rate?
- Crime grade is D in this area — have there been break-ins, vandalism, or insurance claims at this property in the last 3 years? What carrier currently insures it and at what premium?
- The area grade is low — what's the realistic commute time and amenity access for the typical tenant pool here? Any planned neighborhood developments (good or bad) we should know about?
- What's the average days-on-market for RENTAL listings here right now (not sales)? A rising rental-DOM trend means longer vacancies and softer asking-rent achievability than the comps imply.
- What's the recent tenant-quality profile in this submarket — average credit score on applications, eviction rate, late-payment / NSF rate, and stable-employment percentage? A property-management company in the area should have these aggregated.
- How much new for-sale + rental construction is in the pipeline within 1–3 miles? Heavy new supply typically softens prices + rents 12–24 months out; constrained supply supports both.
Investment metrics
- 1% rule
- 0.70% ✗
- Cap rate
- 5.54%
- Cash-on-cash
- -2.69%
- DSCR
- 0.88
- GRM
- 11.8
CMA / ARV
- ARV (on-the-fly)
- $271,000
- Comps found
- 4
Show comp detail 4 sales within ~0.75 mi
| Address | Dist | Beds/Ba | Sqft | Sold | Price | $/sf | Match |
|---|---|---|---|---|---|---|---|
| 60 Honey Bee Ln | 0.18mi | 2/2.0 (-1) | 1,173 (+8%) | 6mo | $290,000 | $247 | 64 |
| 75 Springwood Ln | 0.17mi | 2/2.0 (-1) | 1,154 (+6%) | 11mo | $289,000 | $250 | 63 |
| 30 Bethany Ln | 0.55mi | 3/2.0 | 1,146 (+6%) | 6mo | $277,000 | $242 | 56 |
| 370 Haddonfield Ct | 0.35mi | 2/2.0 (-1) | 1,152 (+6%) | 18mo | $299,485 | $260 | 49 |
Match score weights: distance 35% · size 25% · config 20% · recency 20%. Top-matched comps best support the ARV.
Projected returns pro-forma
8.42% appreciation · 3.0% rent growth · sell at horizon
- IRR
- 18.9%
- Equity multiple
- 2.42×
- Total profit
- $100,871
- Equity at exit
- $199,507
- IRR
- 17.6%
- Equity multiple
- 5.24×
- Total profit
- $300,466
- Equity at exit
- $403,189
Cash invested: $70,840 (down + closing). Projections, not guarantees.
Landlord ↔ Tenant lean methodology
- Overall (STATE)
- 85 Strongly Landlord-Friendly
- State North Carolina
- 85 Strongly Landlord-Friendly · R+3
- County
- — inherits STATE
- City
- — inherits STATE
ZIP-level market 27525
- Home prices YoY
- 3.0%
- Active inventory
- 251
- Price-to-rent
- 11.8×
Monthly cashflow live
- Estimated rent
- $1,783 medium interval (Pro) →
- Mortgage (P&I)
- −$1,327
- Tax from tax record
- −$135 /mo · $1,624/yr
- Insurance
- −$105
- HOA
- −$0
- Vacancy / Maint / Mgmt
- −$374
- Net cashflow
- $-159
Break-even live
Sensitivity live
| Price | -10% $-16 | -5% $-87 | +0% $-159 | +5% $-231 | +10% $-302 |
|---|---|---|---|---|---|
| Rent | -10% $-300 | -5% $-229 | +0% $-159 | +5% $-89 | +10% $-18 |
| Rate | -1.0pp $-32 | -0.5pp $-95 | base $-159 | +0.5pp $-225 | +1.0pp $-291 |
UW: 25.0% down · 7.5% · 30yr · 1.5% tax · 5.0% vac · 8.0% maint · 8.0% mgmt
Financing live
Cash to close
- Down payment
- $63,250
- Closing costs
- $7,590
- Reserves months
- —
- Total cash needed
- —
Loan-product check · same deal, 3 products live
Conventional
25% down · 7.5% · 30yr
- Down + closing
- —
- Monthly P&I
- —
- Monthly cashflow
- —
- DSCR
- —
- Eligible?
- —
Personal DTI + credit; lowest rate.
DSCR
20% down · 8.5% · 30yr
- Down + closing
- —
- Monthly P&I
- —
- Monthly cashflow
- —
- DSCR
- —
- Eligible?
- —
No personal income docs; deal must DSCR.
Hard money
10% down · 12.0% · 12mo
- Down + closing
- —
- Monthly P&I
- —
- Monthly cashflow
- —
- DSCR
- —
- Eligible?
- —
Short-term bridge; refi at stabilization.
Listing history 15 events
-
2026-06-18days on market $253,000 Active 181 DOM
-
2026-06-17days on market $253,000 Active 180 DOM
-
2026-06-16days on market $253,000 Active 179 DOM
-
2026-06-15days on market $253,000 Active 178 DOM
-
2026-06-13days on market $253,000 Active 176 DOM
-
2026-06-12days on market $253,000 Active 175 DOM
-
2026-06-09days on market $253,000 Active 172 DOM
-
2026-06-08days on market $253,000 Active 171 DOM
-
2026-06-07days on market $253,000 Active 170 DOM
-
2026-06-07days on market $253,000 Active 169 DOM
-
2026-06-04days on market $253,000 Active 166 DOM
-
2026-06-02days on market $253,000 Active 165 DOM
-
2026-06-01days on market $253,000 Active 164 DOM
-
2026-05-31remarks 687-char remark
-
2026-05-31$253,000 Active 163 DOM
ⓘ Source: listings_history table (triggers on properties + properties_extension) + one-shot
backfill from property_details.listing_events for pre-trigger history.
Tax reassessment forecast NC · Resets to sale price
- Current annual tax
- $1,624 · $135/mo
- Projected year-2 tax
- $2,075 · $173/mo
- Expected delta
- +$451/yr (+$38/mo · 27.8%)
ⓘ Screening estimate from a state-policy table — verify with the county assessor before closing.
Climate risk First Street
- Flood 1/10 Low FEMA zone X (unshaded) · 0% chance over 30 yrs
- Wildfire 4/10 Moderate
- Heat 6/10 Major 7 d/yr ≥105°F today · 16 d/yr by 30 yrs out
- Wind 6/10 Major 45% chance of damaging wind over 30 yrs
- Air quality 2/10 Low 1 unhealthy d/yr today · 1 by 30 yrs out
Nearby sold comps map
Loading sold comps map…
Walkable amenities ~0.75 mi
Loading nearby amenities…
Taxation est. · year 1
- Rental income
- $21,395
- − Mortgage interest
- −$14,172
- − Property taxes
- −$1,624
- − Insurance
- −$1,265
- − Repairs & maintenance
- −$1,712
- − Management
- −$1,712
- − Depreciation
- −$7,360
- Taxable loss
- −$6,449
- Est. tax savings @ 24.0%
- +$1,548
- After-tax cash flow
- $-360/yr
For passive investors: Depreciation is non-cash, so a rental often shows a tax loss while cash-flowing — sheltering income. Rental losses are passive: they offset passive income freely, and up to $25,000/yr can offset ordinary (W-2) income if you actively participate and your MAGI is under $100k (phasing out to $0 by $150k); unused losses carry forward. On sale, claimed depreciation is recaptured at up to 25%, and gains may owe capital-gains tax (a 1031 exchange can defer both). Figures are a year-1 estimate at your 24.0% rate — not tax advice; consult a CPA.
Schools (NCES district)
- District
- Franklin County Schools
- NCES district ID
- 3701530
- Math proficiency
- 34% ▬ 0.00%
- Reading proficiency
- 37% ▼ -4.00%
- Median HH income
- $44,630
- Composite
- 30.25/100
- National rank
- #6286
- State rank
- #128 of 178 in NC
Livability — Franklinton
- Score
- 61/100
- State rank
- #491
- US rank
- #18002
Category grades
Schools grade is shown separately in the Schools card above.
Census & demographics
- County
- Franklin County · 64,885 people
- City population
- 17,110
- Metro
- Raleigh-Cary, NC
- Population (ZIP)
- 17,110
- Household income
- $73,036
- Rent vs Own
- Severe rent burden
- 446.0
Population outlook (Franklin County) Hauer SSP2
- Today (2025)
- 69,848 people
- By 2030
- 72,480 · +3.8%
- By 2040
- 76,682 · +9.8%
- By 2050
- 78,993 · +13.1%
- By 2075
- 82,888 · +18.7%
- By 2100
- 80,784 · +15.7%
Race, ethnicity, and origin ACS 2023
- Neighborhood character
- Predominantly White (66%)
- Race & ethnicity
- White 66% Black 24% Hispanic / Latino 6% Two or more races 5%
- Hispanic origin (detail)
- Mexican 3% Cuban 2%
- Common ancestry
- Slovak 3% Serbian 2% Italian 2%
- Foreign-born
- 3% · Canada
- Languages at home
- 94% English-only · Spanish 3% German/W. Germanic 1%
Political lean MEDSL · Franklin
- 2024 margin
- R (+13.6) · D 42.7% · R 56.3%
- 2008→2024 swing
- -12.9pp toward R · 2008: -0.7pp · 2024: -13.6pp
- All cycles
- 2024: R+13.6 2020: R+13.4 2016: R+11.7 2012: R+4.2 2008: R+0.7
Not yet ingested
- Civics
- —
Market trends
- HPI YoY
- ▲ 8.42%
- Current HPI
- 294.1531
- Rent YoY
- —
- Metro
- Raleigh-Cary, NC
- State GDP YoY
- ▲ 3.28%
- F500 in state
- 26
Industry mix (Fortune 500 HQ in NC)
| Industry | F500 HQs | Revenue |
|---|---|---|
| Financial Services | 2 | $213B |
|
||
| Retail | 2 | $95B |
|
||
| Industrial Conglomerate | 1 | $38B |
|
||
| Metals / Steel | 1 | $35B |
|
||
| Utilities | 1 | $30B |
|
||
| Industrial Machinery | 1 | $19B |
|
||
Price history
+50.6% since first listed16 events — show timeline
- 2026-04-16 Price Changed $253,000 TMLS
- 2026-02-25 Price Changed $260,000 TMLS
- 2026-02-24 Price Changed $260 TMLS
- 2025-12-19 Listed $270,000 TMLS
- 2025-04-09 Pending — TMLS
- 2025-04-09 Listing Removed — TMLS
- 2025-04-03 Price Changed $265,000 TMLS
- 2025-01-16 Relisted — TMLS
- 2025-01-08 Pending — TMLS
- 2025-01-06 Relisted — TMLS
- 2024-10-02 Pending — TMLS
- 2024-07-02 Price Changed $275,000 TMLS
- 2024-05-24 Relisted — TMLS
- 2024-05-10 Pending — TMLS
- 2024-05-02 Listed $285,000 TMLS
- 2023-11-20 Sold (Public Records) $168,000 Public Records
Property tax history
+6.6%/yrLatest (2025): $1,624 · +1.8% YoY. Source: county tax records.
Cash-flow waterfall
monthlySold comps — $/sqft
last 12 mo · ≤1 miLoading sold comps…