 Duplex
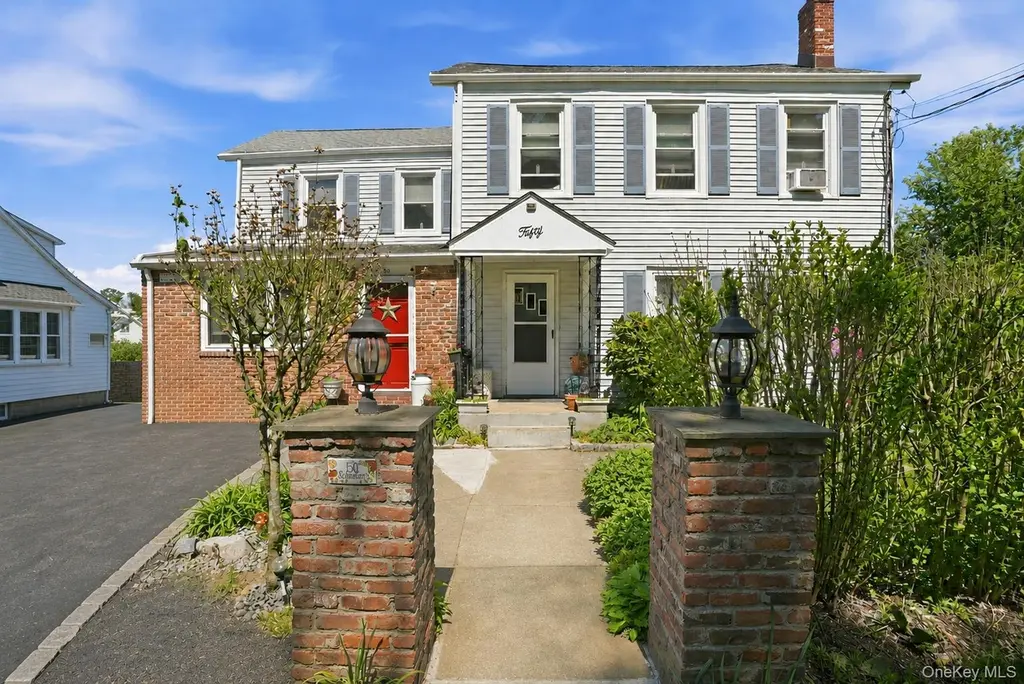
50 Sunset Rd · Montrose, NY
Flood risk 1/10 · Minimal
- FEMA flood zone
- X (unshaded)
- Chance of flooding over 30 yrs
- 0.0%
- Est. flood insurance / yr
- $507 – $1,088
Fire risk 2/10 · Minimal
- Est. fire insurance / yr
- $691 – $1,283
Heat risk 5/10 · Moderate
- Hot days now (above 101°F)
- 7 days/yr
- Hot days in 30 yrs
- 15 days/yr
Wind risk 4/10 · Minor
- Chance of severe wind over 30 yrs
- 21.0%
Air-quality risk 3/10 · Minor
- Unhealthy air days now
- 3 days/yr
- Unhealthy air days in 30 yrs
- 4 days/yr
Risk factors via First Street. Map © Google.
Why this score? — see what drove the C+ grade
The composite is a weighted blend of 9 inputs, each scored 0–100. Each bar is that input's sub-score; the figure is the points it added to the 100-point composite (weight × sub-score).
- Cash flow +22.4/30.0
- ARV discount +15.0/15.0
- DSCR +7.2/10.0
- Schools +6.0/10.0
- 1% rule +4.8/10.0
- Livability +4.2/5.0
- Rent growth +2.5/5.0
- Condition / age +2.5/5.0
- Appreciation +0.3/10.0
$984,500
🖨 Deal sheet 📄 Offer letter ✓ Due diligence
Multi-family units
County records classify this as Multi-Family (2-4 Unit). Listing-text estimate: 2 units. confirmed
Listing remarks
Welcome to 50 Sunset Road in Montrose, a rare opportunity to own a legal two-family home in one of northern Westchester’s most commuter-friendly Hudson River communities. Whether you’re an investor seeking a strong income-producing property or an owner-occupant looking to offset expenses with rental income, this versatile and lovingly maintained home offers exceptional flexibility and value. Owned by the same family for more than 50 years, the property has been thoughtfully cared for and features a first floor spacious 3-bedroom 3 full bath home, and 2nd floor spacious 2 bedroom with den/office/guest quarters and full bath apartment — each with generously sized rooms and c
Key facts
- Huge eat-in kitchen
- First floor spacious
- 0.47 acre lot
Tags
Property features AI
Exterior
- Parking: Driveway parking; Off-street parking; Total parking spaces: 7
- Utilities: Electric service by Con-Edison; Septic tank; Electricity connected; Public trash collection; Water connected
- Home design: Duplex property
- Construction: Frame construction
- Exterior features: Back yard fencing; Patio; Not waterfront
Interior
- Kitchen: Eat-in kitchen(s)
- Bedrooms: Contains one 2-bedroom unit; Contains one 3-bedroom unit
- Flooring: Ceramic tile; Hardwood
- Bathrooms: Four full bathrooms
- Heating & cooling: Baseboard heating; Wall/window air conditioning units
- Interior features: First-floor bedroom; First-floor full bathroom; Eat-in kitchen; Formal dining room; Primary bathroom; Walk-in closet(s); Washer/dryer hookup; Patio
- Laundry & utility: Laundry located in basement; Laundry located in bathroom; Washer/dryer hookup
Neighborhood map
What this means for you Summary
Snapshot
- This is a 2 × 2-bed/2.0-bath units multifamily listed at $984k.
Deal economics
- At list price, monthly cash flow is $2k ($20k/yr) — positive. Per door: $821/mo.
- The deal already cash-flows at list — no discount required.
- To meet the 1% rule (rent ≥ 1% of price), the offer needs to be $962k (2.3% below list).
- Recommended offer: $962k (2.3% below list) — sets the bar for 1% rule.
Location & tenants
- Location reads 83/100 on livability (#68 in NY, #1,024 nationally) — a professional / high-income tenant draw. Strengths: crime A+, commute A+, employment A+; Watch: amenities F, cost of living F.
- Hendrick Hudson Central School District (suburban): math 62% / reading 72% proficiency, ranked #143 of 590 in NY (top 24%) — acceptable for families but not a draw, mixed tenant base, ~2y average lease; only 16% free/reduced lunch — higher-income household profile.
- Zoned schools: Blue Mountain Middle School (math 47% / reading 70%, grade B, #178 of 729 statewide, top 25%, 489 students, 31% FRL); Hendrick Hudson High School (math 87% / reading 84%, grade A, #358 of 1,100 statewide, top 33%, 727 students, 31% FRL).
- Market conditions: 18 active listings in the ZIP; 954 units permitted in Westchester County in 2024 (649 in 5+ unit buildings).
Forward outlook
- Local home prices are declining (-3.0%/yr); year-one equity from $7k of loan paydown is wiped out by about $30k of value loss. Plan a longer hold.
- Westchester County population projected at +10% by 2050 — modest demand growth; plan on rents tracking national, not racing it.
Negotiation context
- It's been on market 24 days — a 2% lower offer ($970k) is reasonable based on typical stale-listing flexibility.
Risks & watch-outs
- Watch-outs: built in 1955 — expect roof / HVAC / electrical / plumbing capex.
- Climate carrying-cost: extreme-heat days projected 7→15/yr by 2055 (HVAC capex compounding) — expect insurance premiums to compound above CPI over the hold.
Questions for the listing agent
- Can we see the unit-by-unit rent roll, current vacancy, and any below-market leases? What's the average tenancy length?
- What capital expenditures (roof, boiler, parking lot, exteriors) have been made in the last 5 years, and what's planned in the next 2?
- Built in 1955 — when were the roof, HVAC, electrical panel, plumbing, and water heater last replaced?
- Is there a deadline driving the sale (1031 exchange, divorce, estate, relocation)? That informs how much negotiation room exists.
- Schools are A-rated — typically a magnet for longer-tenancy family renters. What's the average tenant stay here, and is there a school-zone premium baked into asking?
- What's the average days-on-market for RENTAL listings here right now (not sales)? A rising rental-DOM trend means longer vacancies and softer asking-rent achievability than the comps imply.
- What's the recent tenant-quality profile in this submarket — average credit score on applications, eviction rate, late-payment / NSF rate, and stable-employment percentage? A property-management company in the area should have these aggregated.
- How much new apartment / multifamily construction is in the pipeline within 1–3 miles? Heavy new supply (>2% of stock underway) typically softens rents 12–24 months out; light construction supports rent growth.
Investment metrics
- 1% rule
- 0.98% ✗
- Cap rate
- 8.29%
- Cash-on-cash
- 7.15%
- DSCR
- 1.32
- GRM
- 8.5
CMA / ARV
- ARV (median comp)
- $1,206,166
- List price
- $984,500
- Delta
- -18.38%
- Verdict
- UNDERPRICED
- Comps
- 9 within 1.0 mi
Show comp detail 2 sales within ~0.75 mi
| Address | Dist | Beds/Ba | Sqft | Sold | Price | $/sf | Match |
|---|---|---|---|---|---|---|---|
| 23 Montrose Point Rd | 0.36mi | 4/2.5 | 2,658 (-3%) | 20mo | $595,000 | $224 | 57 |
| 168 Seward St | 0.60mi | 5/3.0 (+1) | 2,428 (-11%) | 4mo | $800,000 | $329 | 42 |
Match score weights: distance 35% · size 25% · config 20% · recency 20%. Top-matched comps best support the ARV.
Projected returns pro-forma
-3.0% appreciation · 3.0% rent growth · sell at horizon
- IRR
- -5.4%
- Equity multiple
- 0.80×
- Total profit
- $-55,359
- Equity at exit
- $146,792
- IRR
- 4.2%
- Equity multiple
- 1.31×
- Total profit
- $84,897
- Equity at exit
- $85,122
Cash invested: $275,660 (down + closing). Projections, not guarantees.
Landlord ↔ Tenant lean methodology
- Overall (STATE)
- 15 Strongly Tenant-Friendly
- State New York
- 15 Strongly Tenant-Friendly · D+10
- County
- — inherits STATE
- City
- — inherits STATE
ZIP-level market 10548
- Home prices YoY
- -3.1%
- Active inventory
- 18
- Price-to-rent
- 17.1×
Monthly cashflow live
- Estimated rent
- $9,622 medium interval (Pro) →
- Mortgage (P&I)
- −$5,163
- Tax from tax record
- −$387 /mo · $4,643/yr
- Insurance
- −$410
- HOA
- −$0
- Vacancy / Maint / Mgmt
- −$2,021
- Net cashflow
- $1,641
Break-even live
2-unit breakdown (identical units grouped — click to expand)
| Units | Beds | Baths | Est. rent |
|---|---|---|---|
| 2× units | 2 | 2 | $9,622 |
| #1 | 2 | 2 | $4,811 |
| #2 | 2 | 2 | $4,811 |
| Total (2 units) | $9,622 | ||
UW: 25.0% down · 7.5% · 30yr · 1.5% tax · 5.0% vac · 8.0% maint · 8.0% mgmt
Financing live
Cash to close
- Down payment
- $246,125
- Closing costs
- $29,535
- Reserves months
- —
- Total cash needed
- —
Loan-product check · same deal, 3 products live
Conventional
25% down · 7.5% · 30yr
- Down + closing
- —
- Monthly P&I
- —
- Monthly cashflow
- —
- DSCR
- —
- Eligible?
- —
Personal DTI + credit; lowest rate.
DSCR
20% down · 8.5% · 30yr
- Down + closing
- —
- Monthly P&I
- —
- Monthly cashflow
- —
- DSCR
- —
- Eligible?
- —
No personal income docs; deal must DSCR.
Hard money
10% down · 12.0% · 12mo
- Down + closing
- —
- Monthly P&I
- —
- Monthly cashflow
- —
- DSCR
- —
- Eligible?
- —
Short-term bridge; refi at stabilization.
Listing history 7 events
-
2026-06-07statusdays on market $984,500 Pending 24 DOM
-
2026-06-04days on market $984,500 Active 23 DOM
-
2026-06-03days on market $984,500 Active 22 DOM
-
2026-06-02days on market $984,500 Active 21 DOM
-
2026-06-01days on market $984,500 Active 20 DOM
-
2026-05-31days on market $984,500 Active 19 DOM
-
2026-05-02$984,500 Active 2662-char remark
ⓘ Source: listings_history table (triggers on properties + properties_extension) + one-shot
backfill from property_details.listing_events for pre-trigger history.
Tax reassessment forecast NY · Partial reset (capped growth)
- Current annual tax
- $4,643 · $387/mo
- Projected year-2 tax
- $10,640 · $887/mo
- Expected delta
- +$5,998/yr (+$500/mo · 129.2%)
ⓘ Screening estimate from a state-policy table — verify with the county assessor before closing.
Climate risk First Street
- Flood 1/10 Low FEMA zone X (unshaded) · 0% chance over 30 yrs
- Wildfire 2/10 Low
- Heat 5/10 Major 7 d/yr ≥101°F today · 15 d/yr by 30 yrs out
- Wind 4/10 Moderate 21% chance of damaging wind over 30 yrs
- Air quality 3/10 Moderate 3 unhealthy d/yr today · 4 by 30 yrs out
Nearby sold comps map
Loading sold comps map…
Walkable amenities ~0.75 mi
Loading nearby amenities…
Taxation est. · year 1
- Rental income
- $115,464
- − Mortgage interest
- −$55,147
- − Property taxes
- −$4,643
- − Insurance
- −$4,922
- − Repairs & maintenance
- −$9,237
- − Management
- −$9,237
- − Depreciation
- −$28,640
- Taxable income
- $3,637
- Est. tax owed @ 24.0%
- −$873
- After-tax cash flow
- $18,825/yr
For passive investors: Depreciation is non-cash, so a rental often shows a tax loss while cash-flowing — sheltering income. Rental losses are passive: they offset passive income freely, and up to $25,000/yr can offset ordinary (W-2) income if you actively participate and your MAGI is under $100k (phasing out to $0 by $150k); unused losses carry forward. On sale, claimed depreciation is recaptured at up to 25%, and gains may owe capital-gains tax (a 1031 exchange can defer both). Figures are a year-1 estimate at your 24.0% rate — not tax advice; consult a CPA.
Schools (NCES district)
- District
- Hendrick Hudson Central School District
- NCES district ID
- 3614190
- Math proficiency
- 62% ▼ -2.00%
- Reading proficiency
- 72% ▲ 15.00%
- Median HH income
- $88,159
- Composite
- 60.49/100
- National rank
- #846
- State rank
- #143 of 590 in NY
Livability — Montrose
- Score
- 83/100
- State rank
- #68
- US rank
- #1024
Category grades
Schools grade is shown separately in the Schools card above.
Census & demographics
- Census place
- Montrose, NY
- City population
- 4,302
- Population (ZIP)
- 4,302
Population outlook (Westchester County) Hauer SSP2
- Today (2025)
- 1,028,035 people
- By 2030
- 1,051,636 · +2.3%
- By 2040
- 1,098,520 · +6.9%
- By 2050
- 1,136,044 · +10.5%
- By 2075
- 1,196,925 · +16.4%
- By 2100
- 1,175,147 · +14.3%
Race, ethnicity, and origin ACS 2023
- Neighborhood character
- Predominantly White (66%)
- Race & ethnicity
- White 66% Hispanic / Latino 27% Two or more races 14% Black 5%
- Hispanic origin (detail)
- Puerto Rican 10% Dominican 4%
- Common ancestry
- Romanian 5% Iranian 3% Italian 2%
- Foreign-born
- 10% · Canada, Jamaica
- Languages at home
- 78% English-only · Spanish 19% Other Indo-European 2% French/Haitian/Cajun 1%
Political lean MEDSL · Westchester
- 2024 margin
- Strong D (+26.3) · D 63.1% · R 36.9%
- 2008→2024 swing
- -1.3pp toward R · 2008: 27.6pp · 2024: 26.3pp
- All cycles
- 2024: D+26.3 2020: D+36.3 2016: D+32.8 2012: D+22.2 2008: D+27.6
Not yet ingested
- Civics
- —
Market trends
- HPI YoY
- ▼ -9.35%
- Current HPI
- 295.7112
- Rent YoY
- —
- Metro
- —
- State GDP YoY
- ▲ 2.60%
- F500 in state
- 92
Industry mix (Fortune 500 HQ in NY)
| Industry | F500 HQs | Revenue |
|---|---|---|
| Financial Services | 10 | $950B |
|
||
| Consumer Goods | 9 | $162B |
|
||
| Insurance | 4 | $225B |
|
||
| Telecommunications | 2 | $144B |
|
||
| Pharmaceuticals | 2 | $112B |
|
||
| Media / Entertainment | 2 | $69B |
|
||
Price history
2 events — show timeline
- 2026-06-05 Pending — OneKey® MLS as Distributed by MLS Grid
- 2026-05-02 Listed $984,500 OneKey® MLS as Distributed by MLS Grid
Property tax history
+19.0%/yrLatest (2025): $4,643 · +7.2% YoY. Source: county tax records.
Cash-flow waterfall
monthlySold comps — $/sqft
last 12 mo · ≤1 miLoading sold comps…