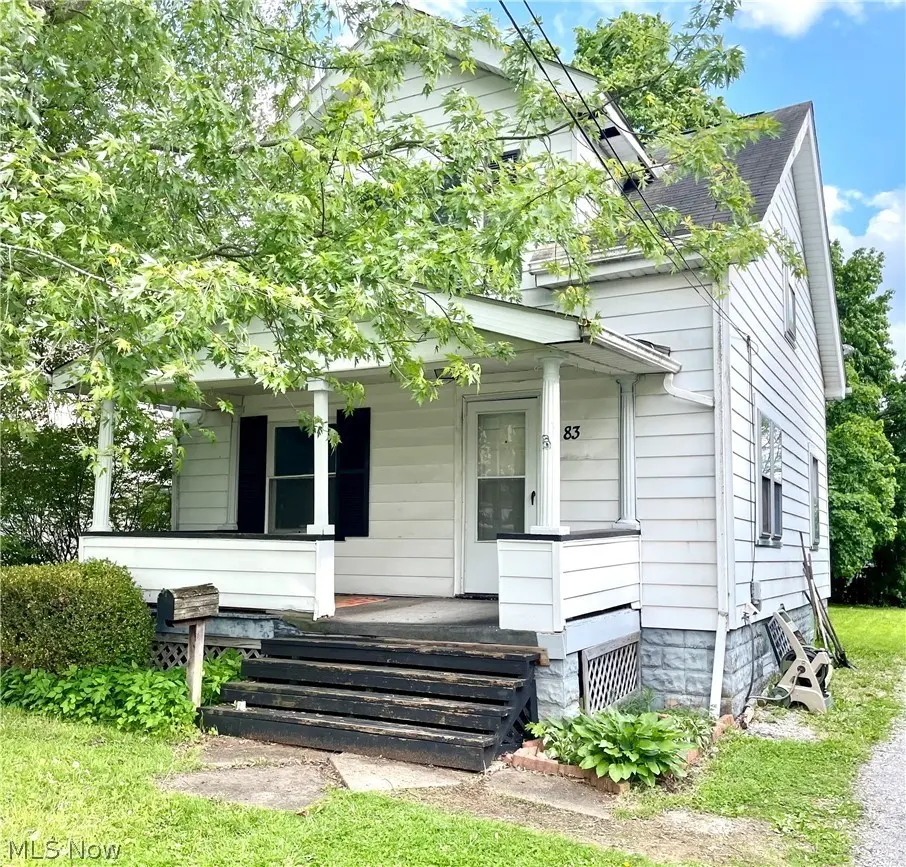
83 Smithsonian St · Girard, OH
Flood risk 1/10 · Minimal
- FEMA flood zone
- X (unshaded)
- Chance of flooding over 30 yrs
- 0.0%
- Est. flood insurance / yr
- $473 – $860
Fire risk 1/10 · Minimal
- Est. fire insurance / yr
- $713 – $1,323
Heat risk 3/10 · Minor
- Hot days now (above 98°F)
- 7 days/yr
- Hot days in 30 yrs
- 18 days/yr
Wind risk 1/10 · Minimal
- Chance of severe wind over 30 yrs
- —
Air-quality risk 3/10 · Minor
- Unhealthy air days now
- 1 days/yr
- Unhealthy air days in 30 yrs
- 4 days/yr
Risk factors via First Street. Map © Google.
Why this score? — see what drove the B+ grade
The composite is a weighted blend of 9 inputs, each scored 0–100. Each bar is that input's sub-score; the figure is the points it added to the 100-point composite (weight × sub-score).
- Cash flow +30.0/30.0
- ARV discount +15.0/15.0
- 1% rule +10.0/10.0
- DSCR +10.0/10.0
- Schools +4.1/10.0
- Livability +3.4/5.0
- Rent growth +2.5/5.0
- Condition / age +2.5/5.0
- Appreciation +0.0/10.0
$69,900
🖨 Deal sheet 📄 Offer letter ✓ Due diligence
Listing remarks
Opportunity awaits with this 2-bedroom, 1-bath home featuring plenty of potential for investors or buyers looking for their next flip project. Upstairs offers two comfortable bedrooms and a full bathroom with a bathtub. The main level includes a kitchen, living room, dining room, and an additional spare room that could easily serve as a home office or possible third bedroom. Outside, you’ll find a small backyard perfect for low-maintenance outdoor space. Convenient layout and endless possibilities make this property a great investment
Key facts
- 5,401 sq ft lot
- Parking
- Built 1920
Property features AI
Finance
- Other: Above-grade finished area reported as 1,016 (source: Realist)
Exterior
- Parking: Driveway
- Utilities: Public water service; Public sewer service
- Home design: Two-story home; Asphalt roof; Aluminum siding
- Construction: Built with aluminum siding; Asphalt roof
- Exterior features: Public water; Public sewer; Lot recorded from public records
Interior
- Kitchen: Kitchen on the first floor
- Bedrooms: Two bedrooms on the second floor
- Flooring: Carpet in one first-floor room; Wood flooring in family room; Laminate flooring in kitchen, dining room, and both bedrooms; Linoleum flooring in bathroom
- Bathrooms: One full bathroom (second floor)
- Heating & cooling: Baseboard heating; Ceiling fans for cooling
- Interior features: Full basement
Neighborhood map
What this means for you Summary
Snapshot
- This is a 3-bed/1.5-bath single-family listed at $70k.
Deal economics
- At list price, monthly cash flow is $602 ($7k/yr) — positive.
- The deal already cash-flows at list — no discount required.
- Meets the 1% rule at list price ($1k rent vs $70k).
- Recommended offer: $68k (3.0% below list) — sets the bar for market timing.
- Cap rate 16.6% vs local median 7.0% in Girard — top-decile yield for the area; either an underpriced asset or a hidden risk that comps aren't pricing in. Stress-test before assuming the spread holds.
Location & tenants
- Location reads 67/100 on livability (#605 in OH) — a middle-class / working-renter tenant base. Strengths: cost of living A+, housing A+, schools A-; Watch: employment D+, amenities F, commute F.
- Girard City School District (suburban): math 38% / reading 61% proficiency, ranked #458 of 656 in OH (top 70%) — families likely to look elsewhere, expect single-tenant / working-renter base with shorter leases.
- Market conditions: 58 active listings in the ZIP; 11 comparable units currently listed for rent nearby; rentals leasing fast (median 14d on market — plan ~1-2 weeks tenant-placement turnaround); 129 units permitted in Trumbull County in 2024 (0 in 5+ unit buildings).
Forward outlook
- Local home prices are declining (-3.0%/yr); year-one equity from $483 of loan paydown is wiped out by about $2k of value loss. Plan a longer hold.
- Trumbull County population projected at -22% by 2050 — secular population decline; favor cash flow + early exit over multi-decade hold.
- At projected returns (-3.0% appreciation + 3.0% rent growth), your $20k cash investment doubles in ~4 years — after that, you're playing with house money.
Negotiation context
- It's been on market 42 days — a 3% lower offer ($68k) is reasonable based on typical stale-listing flexibility.
- 4 sale attempts since 20y ago; this cycle's ask has dropped $10k (13%) from the opening price — seller is motivated, your offer sets the floor, not the list.
Risks & watch-outs
- Watch-outs: built in 1920 — expect roof / HVAC / electrical / plumbing capex.
Questions for the listing agent
- It's been on market 42 days. Have you received any prior offers? Is the seller open to a 3% concession, seller financing, or rate buy-down credit?
- Built in 1920 — when were the roof, HVAC, electrical panel, plumbing, and water heater last replaced?
- Is there a deadline driving the sale (1031 exchange, divorce, estate, relocation)? That informs how much negotiation room exists.
- Schools are A-rated — typically a magnet for longer-tenancy family renters. What's the average tenant stay here, and is there a school-zone premium baked into asking?
- What's the average days-on-market for RENTAL listings here right now (not sales)? A rising rental-DOM trend means longer vacancies and softer asking-rent achievability than the comps imply.
- What's the recent tenant-quality profile in this submarket — average credit score on applications, eviction rate, late-payment / NSF rate, and stable-employment percentage? A property-management company in the area should have these aggregated.
- How much new for-sale + rental construction is in the pipeline within 1–3 miles? Heavy new supply typically softens prices + rents 12–24 months out; constrained supply supports both.
Investment metrics
- 1% rule
- 1.94% ✓
- Cap rate
- 16.62%
- Cash-on-cash
- 36.90%
- DSCR
- 2.64
- GRM
- 4.3
CMA / ARV
- ARV (median comp)
- $121,860
- List price
- $69,900
- Delta
- -42.64%
- Verdict
- UNDERPRICED
- Comps
- 20 within 1.0 mi
Show comp detail 12 sales within ~0.75 mi
| Address | Dist | Beds/Ba | Sqft | Sold | Price | $/sf | Match |
|---|---|---|---|---|---|---|---|
| 1085 North Ave | 0.19mi | 3/1.0 | 936 (-8%) | 8mo | $119,000 | $127 | 69 |
| 843 Lawrence Ave | 0.25mi | 3/2.0 | 1,098 (+8%) | 7mo | $125,000 | $114 | 67 |
| 437 Hazel St | 0.58mi | 3/1.0 | 1,080 (+6%) | 10mo | $170,000 | $157 | 52 |
| 424 Powers Ave | 0.51mi | 3/1.5 | 912 (-10%) | 9mo | $105,000 | $115 | 52 |
| 1018 N State St | 0.20mi | 2/1.0 (-1) | 1,148 (+13%) | 13mo | $125,000 | $109 | 51 |
| 445 Powers Ave | 0.56mi | 2/1.0 (-1) | 912 (-10%) | 2mo | $154,500 | $169 | 48 |
| 451 Powers Ave | 0.57mi | 3/1.0 | 912 (-10%) | 8mo | $75,000 | $82 | 48 |
| 233 E Main St | 0.74mi | 3/1.5 | 1,122 (+10%) | 1mo | $115,000 | $102 | 48 |
| 565 Powers Ave | 0.70mi | 3/1.5 | 1,115 (+10%) | 14mo | $169,900 | $152 | 40 |
| 1061 N Ward Ave | 0.55mi | 3/2.0 | 1,160 (+14%) | 14mo | $210,600 | $182 | 37 |
| 324 Williams Ct | 0.48mi | 4/1.0 (+1) | 871 (-14%) | 12mo | $66,000 | $76 | 37 |
| 863 Shannon Rd | 0.69mi | 2/1.0 (-1) | 1,092 (+8%) | 14mo | $130,000 | $119 | 37 |
Match score weights: distance 35% · size 25% · config 20% · recency 20%. Top-matched comps best support the ARV.
Projected returns pro-forma
-3.0% appreciation · 3.0% rent growth · sell at horizon
- IRR
- 32.8%
- Equity multiple
- 2.38×
- Total profit
- $27,013
- Equity at exit
- $10,422
- IRR
- 39.8%
- Equity multiple
- 4.73×
- Total profit
- $72,926
- Equity at exit
- $6,044
Cash invested: $19,572 (down + closing). Projections, not guarantees.
Landlord ↔ Tenant lean methodology
- Overall (STATE)
- 73 Landlord-Friendly
- State Ohio
- 73 Landlord-Friendly · R+6
- County
- — inherits STATE
- City
- — inherits STATE
ZIP-level market 44420
- Home prices YoY
- -16.8%
- Active inventory
- 58
- Price-to-rent
- 4.3×
Monthly cashflow live
- Estimated rent
- $1,357 high interval (Pro) →
- Mortgage (P&I)
- −$367
- Tax from tax record
- −$74 /mo · $893/yr
- Insurance
- −$29
- HOA
- −$0
- Vacancy / Maint / Mgmt
- −$285
- Net cashflow
- $602
Break-even live
UW: 25.0% down · 7.5% · 30yr · 1.5% tax · 5.0% vac · 8.0% maint · 8.0% mgmt
Financing live
Cash to close
- Down payment
- $17,475
- Closing costs
- $2,097
- Reserves months
- —
- Total cash needed
- —
Loan-product check · same deal, 3 products live
Conventional
25% down · 7.5% · 30yr
- Down + closing
- —
- Monthly P&I
- —
- Monthly cashflow
- —
- DSCR
- —
- Eligible?
- —
Personal DTI + credit; lowest rate.
DSCR
20% down · 8.5% · 30yr
- Down + closing
- —
- Monthly P&I
- —
- Monthly cashflow
- —
- DSCR
- —
- Eligible?
- —
No personal income docs; deal must DSCR.
Hard money
10% down · 12.0% · 12mo
- Down + closing
- —
- Monthly P&I
- —
- Monthly cashflow
- —
- DSCR
- —
- Eligible?
- —
Short-term bridge; refi at stabilization.
Rent comps 11 comps
| Address | Beds | Baths | Sqft | Rent | $/sqft | DOM | Units | Dist |
|---|---|---|---|---|---|---|---|---|
| 1079 North Ave Girard, OH | 3.0 | 2.0 | 1462 | $1,600 | $1.09 | 13d | 1 | 0.17mi |
| 848 Lawrence Ave Girard, OH | 3.0 | 1.0 | 950 | $1,400 | $1.47 | 13d | 1 | 0.20mi |
| 833 Lawrence Ave Girard, OH | 4.0 | 1.0 | 1312 | $1,450 | $1.11 | 13d | 1 | 0.23mi |
| 103 Hazel St Girard, OH | 2.0 | 1.5 | 1152 | $1,100 | $0.95 | 13d | 1 | 0.28mi |
| 820 Lincoln Ave Girard, OH | 2.0 | 1.0 | 768 | $1,200 | $1.56 | 44d | 1 | 0.34mi |
| 135 E Broadway Ave Girard, OH | 2.0 | 1.0 | 1120 | $995 | $0.89 | 13d | 1 | 0.53mi |
| 711 N Highland Ave Unit 711-01 Girard, OH | 2.0 | 1.0 | 780 | $795 | $1.02 | 13d | 1 | 0.57mi |
| 625 Churchill Rd Girard, OH | 3.0 | 1.0 | 1200 | $1,450 | $1.21 | 13d | 1 | 0.73mi |
| 607 E Kline St Unit A Girard, OH | 2.0 | 1.0 | 1432 | $1,250 | $0.87 | 44d | 1 | 0.90mi |
| 296 E Howard St Girard, OH | 3.0 | 2.0 | 1253 | $1,800 | $1.44 | 44d | 1 | 1.00mi |
| 1046 Leslie Ln Girard, OH | 3.0 | 1.5 | 936 | $1,400 | $1.50 | 21d | 1 | 1.36mi |
Listing history 24 events
-
2026-06-19days on market $69,900 Active 42 DOM
-
2026-06-18days on market $69,900 Active 41 DOM
-
2026-06-17days on market $69,900 Active 40 DOM
-
2026-06-16days on market $69,900 Active 39 DOM
-
2026-06-15days on market $69,900 Active 38 DOM
-
2026-06-14days on market $69,900 Active 36 DOM
-
2026-06-13days on market $69,900 Active 35 DOM
-
2026-06-10days on market $69,900 Active 33 DOM
-
2026-06-09days on market $69,900 Active 32 DOM
-
2026-06-09price $69,900 Active 31 DOM
-
2026-06-08days on market $79,900 Active 31 DOM
-
2026-06-07days on market $79,900 Active 30 DOM
-
2026-06-03days on market $79,900 Active 26 DOM
-
2026-06-02days on market $79,900 Active 25 DOM
-
2026-06-01days on market $79,900 Active 24 DOM
-
2026-05-31days on market $79,900 Active 23 DOM
-
2026-05-30days on market $79,900 Active 22 DOM
-
2026-05-08$79,900 Active 546-char remark
-
2008-12-07historical
-
2008-07-10historical
-
2008-06-06$54,900
-
2008-01-10$59,900
-
2006-08-31historical
-
2006-02-02$59,900
ⓘ Source: listings_history table (triggers on properties + properties_extension) + one-shot
backfill from property_details.listing_events for pre-trigger history.
Tax reassessment forecast OH · Partial reset (capped growth)
- Current annual tax
- $893 · $74/mo
- Projected year-2 tax
- $992 · $83/mo
- Expected delta
- +$99/yr (+$8/mo · 11.1%)
ⓘ Screening estimate from a state-policy table — verify with the county assessor before closing.
Climate risk First Street
- Flood 1/10 Low FEMA zone X (unshaded) · 0% chance over 30 yrs
- Wildfire 1/10 Low
- Heat 3/10 Moderate 7 d/yr ≥98°F today · 18 d/yr by 30 yrs out
- Wind 1/10 Low
- Air quality 3/10 Moderate 1 unhealthy d/yr today · 4 by 30 yrs out
Nearby sold comps map
Loading sold comps map…
Walkable amenities ~0.75 mi
Loading nearby amenities…
Taxation est. · year 1
- Rental income
- $16,282
- − Mortgage interest
- −$3,915
- − Property taxes
- −$893
- − Insurance
- −$350
- − Repairs & maintenance
- −$1,303
- − Management
- −$1,303
- − Depreciation
- −$2,033
- Taxable income
- $6,485
- Est. tax owed @ 24.0%
- −$1,556
- After-tax cash flow
- $5,665/yr
For passive investors: Depreciation is non-cash, so a rental often shows a tax loss while cash-flowing — sheltering income. Rental losses are passive: they offset passive income freely, and up to $25,000/yr can offset ordinary (W-2) income if you actively participate and your MAGI is under $100k (phasing out to $0 by $150k); unused losses carry forward. On sale, claimed depreciation is recaptured at up to 25%, and gains may owe capital-gains tax (a 1031 exchange can defer both). Figures are a year-1 estimate at your 24.0% rate — not tax advice; consult a CPA.
Schools (NCES district)
- District
- Girard City School District
- NCES district ID
- 3904406
- Math proficiency
- 38% ▼ -43.00%
- Reading proficiency
- 61% ▼ -18.00%
- Median HH income
- $40,293
- Composite
- 41.35/100
- National rank
- #3496
- State rank
- #458 of 656 in OH
Livability — Girard
- Score
- 67/100
- State rank
- #605
- US rank
- #10378
Category grades
Schools grade is shown separately in the Schools card above.
Census & demographics
- Census place
- Girard, OH
- County
- Trumbull County · 61,158 people
- City population
- 15,293
- Metro
- Youngstown-Warren-Boardman, OH-PA
- Population (ZIP)
- 15,293
- Household income
- $61,707
- Rent vs Own
- Severe rent burden
- 351.0
Population outlook (Trumbull County) Hauer SSP2
- Today (2025)
- 191,696 people
- By 2030
- 184,015 · -4.0%
- By 2040
- 166,810 · -13.0%
- By 2050
- 149,857 · -21.8%
- By 2075
- 115,769 · -39.6%
- By 2100
- 83,617 · -56.4%
Race, ethnicity, and origin ACS 2023
- Neighborhood character
- Predominantly White (89%)
- Race & ethnicity
- White 89% Two or more races 6% Hispanic / Latino 3% Black 3%
- Common ancestry
- Romanian 2% Subsaharan African 2% Slovak 1%
- Foreign-born
- 1%
- Languages at home
- 98% English-only · Spanish 1% Other Indo-European 1%
Political lean MEDSL · Trumbull
- 2024 margin
- R (+16.8) · D 41.2% · R 58.0%
- 2008→2024 swing
- -39.2pp toward R · 2008: 22.4pp · 2024: -16.8pp
- All cycles
- 2024: R+16.8 2020: R+10.6 2016: R+6.4 2012: D+22.2 2008: D+22.4
Not yet ingested
- Civics
- —
Market trends
- HPI YoY
- ▼ -44.72%
- Current HPI
- 221.5618
- Rent YoY
- —
- Metro
- Youngstown-Warren-Boardman, OH-PA
- State GDP YoY
- ▲ 1.98%
- F500 in state
- 48
Industry mix (Fortune 500 HQ in OH)
| Industry | F500 HQs | Revenue |
|---|---|---|
| Insurance | 3 | $145B |
|
||
| Industrial Machinery | 3 | $49B |
|
||
| Financial Services | 3 | $24B |
|
||
| Consumer Goods | 2 | $93B |
|
||
| Aerospace / Defense | 2 | $47B |
|
||
| Utilities | 2 | $33B |
|
||
Price history
+16.7% since first listed8 events — show timeline
- 2026-06-09 Price Changed $69,900 MLSNOW
- 2026-05-08 Listed $79,900 MLSNOW
- 2008-12-07 Listing Removed — MLSNOW
- 2008-07-10 Listing Removed — MLSNOW
- 2008-06-06 Listed $54,900 MLSNOW
- 2008-01-10 Listed $59,900 MLSNOW
- 2006-08-31 Listing Removed — MLSNOW
- 2006-02-02 Listed $59,900 MLSNOW
Property tax history
+0.7%/yrLatest (2025): $893 · -1.5% YoY. Source: county tax records.
Cash-flow waterfall
monthlySold comps — $/sqft
last 12 mo · ≤1 miLoading sold comps…