1360 N Dixie Downs Rd #62 · St. George, UT
Flood risk No data
- FEMA flood zone
- —
- Chance of flooding over 30 yrs
- —
- Est. flood insurance / yr
- —
Fire risk No data
- Est. fire insurance / yr
- —
Heat risk No data
- Hot days now (above threshold)
- —
- Hot days in 30 yrs
- —
Wind risk No data
- Chance of severe wind over 30 yrs
- —
Air-quality risk No data
- Unhealthy air days now
- —
- Unhealthy air days in 30 yrs
- —
Risk factors via First Street. Map © Google.
Why this score? — see what drove the C+ grade
The composite is a weighted blend of 9 inputs, each scored 0–100. Each bar is that input's sub-score; the figure is the points it added to the 100-point composite (weight × sub-score).
- Cash flow +24.2/30.0
- 1% rule +10.0/10.0
- DSCR +7.8/10.0
- ARV discount +7.5/15.0
- Schools +3.7/10.0
- Rent growth +3.1/5.0
- Livability +2.5/5.0
- Condition / age +2.2/5.0
- Appreciation +0.0/10.0
$99,900
🖨 Deal sheet 📄 Offer letter ✓ Due diligence
Listing remarks MLS
There are no remarks available.
Key facts
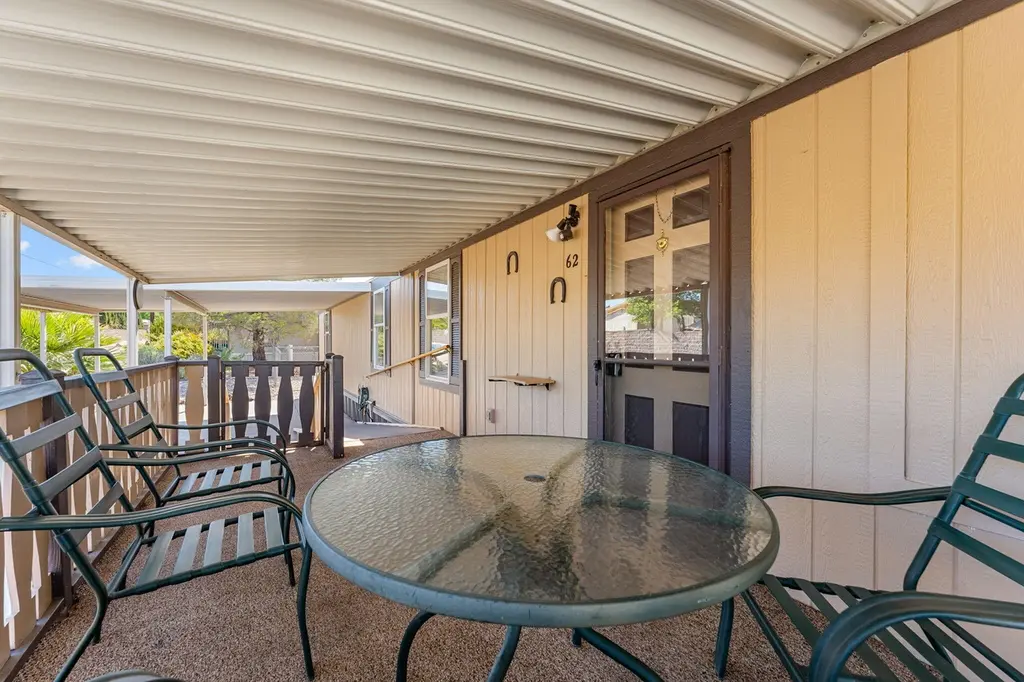
- Front porch
- Outdoor space
- Well maintained
Tags
Property features AI
Finance
- Other: Property on a rented lot
- HOA & community: Homeowners association with a $320 monthly fee; HOA includes water, internet, and cable TV; Senior community
Exterior
- Parking: Carport with 2 spaces; Parking details: see remarks
- Utilities: Sewer available; Electricity connected
- Home design: Residential mobile home; Single-story; Planned Unit Development (PUD)
- Construction: Wood siding; Asphalt roof; Concrete perimeter foundation; Built as a mobile home
- Exterior features: Deck; Fenced yard; Shed(s); Level lot; Paved road access
Interior
- Kitchen: Dishwasher; Disposal; Microwave; Range; Oven; Refrigerator
- Heating & cooling: Electric heating; Central air; Ceiling fans
- Interior features: Window coverings; Accessible entrance with ramp
- Laundry & utility: Washer; Dryer
Neighborhood map
What this means for you Summary
Snapshot
- This is a 2-bed/2.0-bath single-family listed at $100k. Condition is rated fair.
Deal economics
- At list price, monthly cash flow is $200 ($2k/yr) — positive.
- The deal already cash-flows at list — no discount required.
- Meets the 1% rule at list price ($2k rent vs $100k).
- Recommended offer: $97k (3.0% below list) — sets the bar for market timing.
Location & tenants
- Location reads: area grade C — affects rentability + tenant quality, not the cash-flow math above.
- Washington District (urban): math 42% / reading 45% proficiency, ranked #37 of 80 in UT (top 46%) — families likely to look elsewhere, expect single-tenant / working-renter base with shorter leases.
- Zoned schools: Paradise Canyon (math 31% / reading 24%, grade F, #451 of 585 statewide, top 77%, 478 students, 62% FRL); Snow Canyon High (math 32% / reading 48%, grade F, #62 of 171 statewide, top 36%, 1,266 students, 30% FRL).
- Market conditions: Rents rising (+2.4%/yr); 777 active listings in the ZIP; 10 comparable units currently listed for rent nearby; rentals at typical pace (median 21d on market — plan ~3-4 weeks tenant-placement turnaround); 3,140 units permitted in Washington County in 2024 (650 in 5+ unit buildings).
Forward outlook
- Local home prices are declining (-3.0%/yr); year-one equity from $691 of loan paydown is wiped out by about $3k of value loss. Plan a longer hold.
- Washington County population projected at +44% by 2050 — long-run rental-demand tailwind backs the buy-and-hold thesis.
Negotiation context
- It's been on market 60 days — a 3% lower offer ($97k) is reasonable based on typical stale-listing flexibility.
- 3 sale attempts since 22y ago; this cycle's ask has dropped $10k (9%) from the opening price — seller is motivated, your offer sets the floor, not the list.
Risks & watch-outs
- Watch-outs: HOA is 21% of rent.
Questions for the listing agent
- It's been on market 60 days. Have you received any prior offers? Is the seller open to a 3% concession, seller financing, or rate buy-down credit?
- Have any recent inspections been done? Can we get a copy of the seller's disclosures and any deferred-maintenance estimates?
- What does the HOA fee cover, when was the last increase, and are there any pending special assessments or reserve-fund shortfalls?
- Is there a deadline driving the sale (1031 exchange, divorce, estate, relocation)? That informs how much negotiation room exists.
- What's the average days-on-market for RENTAL listings here right now (not sales)? A rising rental-DOM trend means longer vacancies and softer asking-rent achievability than the comps imply.
- What's the recent tenant-quality profile in this submarket — average credit score on applications, eviction rate, late-payment / NSF rate, and stable-employment percentage? A property-management company in the area should have these aggregated.
- How much new for-sale + rental construction is in the pipeline within 1–3 miles? Heavy new supply typically softens prices + rents 12–24 months out; constrained supply supports both.
Investment metrics
- 1% rule
- 1.53% ✓
- Cap rate
- 8.69%
- Cash-on-cash
- 8.57%
- DSCR
- 1.38
- GRM
- 5.4
CMA / ARV
No comps found within radius.
Projected returns pro-forma
-3.0% appreciation · 2.42% rent growth · sell at horizon
- IRR
- -4.0%
- Equity multiple
- 0.85×
- Total profit
- $-4,139
- Equity at exit
- $14,895
- IRR
- 5.0%
- Equity multiple
- 1.36×
- Total profit
- $10,061
- Equity at exit
- $8,638
Cash invested: $27,972 (down + closing). Projections, not guarantees.
Landlord ↔ Tenant lean methodology
- Overall (STATE)
- 86 Strongly Landlord-Friendly
- State Utah
- 86 Strongly Landlord-Friendly · R+15
- County
- — inherits STATE
- City
- — inherits STATE
ZIP-level market 84770
- Rents YoY
- 2.4%
- Active inventory
- 777
- Price-to-rent
- 5.4×
Monthly cashflow live
- Estimated rent
- $1,532 high interval (Pro) →
- Mortgage (P&I)
- −$524
- Tax est. 1.5%
- −$125 /mo · $1,498/yr
- Insurance
- −$42
- HOA
- −$320
- Vacancy / Maint / Mgmt
- −$322
- Net cashflow
- $200
Break-even live
UW: 25.0% down · 7.5% · 30yr · 1.5% tax · 5.0% vac · 8.0% maint · 8.0% mgmt
Financing live
Cash to close
- Down payment
- $24,975
- Closing costs
- $2,997
- Reserves months
- —
- Total cash needed
- —
Loan-product check · same deal, 3 products live
Conventional
25% down · 7.5% · 30yr
- Down + closing
- —
- Monthly P&I
- —
- Monthly cashflow
- —
- DSCR
- —
- Eligible?
- —
Personal DTI + credit; lowest rate.
DSCR
20% down · 8.5% · 30yr
- Down + closing
- —
- Monthly P&I
- —
- Monthly cashflow
- —
- DSCR
- —
- Eligible?
- —
No personal income docs; deal must DSCR.
Hard money
10% down · 12.0% · 12mo
- Down + closing
- —
- Monthly P&I
- —
- Monthly cashflow
- —
- DSCR
- —
- Eligible?
- —
Short-term bridge; refi at stabilization.
Rent comps 10 comps
| Address | Beds | Baths | Sqft | Rent | $/sqft | DOM | Units | Dist |
|---|---|---|---|---|---|---|---|---|
| 1711 W 1300 N Saint George, UT | 2.0 | 1.0 | 1120 | $1,550 | $1.38 | 21d | 1 | 0.16mi |
| 1503 N 2100 W Saint George, UT | 1.0–2.0 | 1.0 | 693 | $1,300 | $1.88 | 13d | 5 | 0.39mi |
| 1741 W 950 N St. George, UT | 2.0 | 1.5 | 1028 | $1,500 | $1.46 | 13d | 1 | 0.53mi |
| 1660 W Sunset Blvd Saint George, UT | 2.0 | 2.0 | 909 | $1,399 | $1.54 | 21d | 3 | 0.58mi |
| 1040 N 1300 W #89 St. George, UT | 3.0 | 2.0 | 1100 | $1,795 | $1.63 | 21d | 1 | 0.79mi |
| 1151 W 540 N Unit 4 St. George, UT | 3.0 | 2.0 | 1000 | $1,295 | $1.29 | 21d | 1 | 1.33mi |
| 260 N Dixie Dr Saint George, UT | 1.0–3.0 | 1.0–2.0 | 1123 | $1,688 | $1.50 | 21d | 18 | 1.33mi |
| 260 N Dixie Dr Saint George, UT | 1.0–3.0 | 1.0–2.0 | 1187 | $1,674 | $1.41 | 13d | 20 | 1.33mi |
| 1180 W 425 N Saint George, UT | 2.0 | 1.0 | 850 | $1,250 | $1.47 | 21d | 1 | 1.38mi |
| 776 Diagonal St #52 St George, UT | 2.0 | 2.0 | 1076 | $1,325 | $1.23 | 13d | 1 | 1.47mi |
HOA detail
- Monthly dues
- $320 · $3,840/yr
Listing history 20 events
-
2026-06-16status $99,900 Pending 60 DOM
-
2026-06-16days on market $99,900 Active 60 DOM
-
2026-06-15days on market $99,900 Active 59 DOM
-
2026-06-14days on market $99,900 Active 57 DOM
-
2026-06-13days on market $99,900 Active 56 DOM
-
2026-06-10days on market $99,900 Active 54 DOM
-
2026-06-09days on market $99,900 Active 53 DOM
-
2026-06-08days on market $99,900 Active 52 DOM
-
2026-06-07days on market $99,900 Active 51 DOM
-
2026-06-05days on market $99,900 Active 48 DOM
-
2026-06-02days on market $99,900 Active 46 DOM
-
2026-06-01days on market $99,900 Active 45 DOM
-
2026-05-31days on market $99,900 Active 44 DOM
-
2026-05-30days on market $99,900 Active 43 DOM
-
2026-04-30price $99,900
-
2026-04-17$109,900 Active
-
2004-10-28soldstatus 31-char remark
Show marketing remark (31 chars)
There are no remarks available.
-
2004-09-10$25,900 31-char remark
Show marketing remark (31 chars)
There are no remarks available.
-
2004-04-05historical
-
2004-01-30$51,060
ⓘ Source: listings_history table (triggers on properties + properties_extension) + one-shot
backfill from property_details.listing_events for pre-trigger history.
Nearby sold comps map
Loading sold comps map…
Walkable amenities ~0.75 mi
Loading nearby amenities…
Taxation est. · year 1
- Rental income
- $18,381
- − Mortgage interest
- −$5,596
- − Property taxes
- −$1,498
- − Insurance
- −$500
- − Repairs & maintenance
- −$1,470
- − Management
- −$1,470
- − HOA
- −$3,840
- − Depreciation
- −$2,906
- Taxable income
- $1,100
- Est. tax owed @ 24.0%
- −$264
- After-tax cash flow
- $2,132/yr
For passive investors: Depreciation is non-cash, so a rental often shows a tax loss while cash-flowing — sheltering income. Rental losses are passive: they offset passive income freely, and up to $25,000/yr can offset ordinary (W-2) income if you actively participate and your MAGI is under $100k (phasing out to $0 by $150k); unused losses carry forward. On sale, claimed depreciation is recaptured at up to 25%, and gains may owe capital-gains tax (a 1031 exchange can defer both). Figures are a year-1 estimate at your 24.0% rate — not tax advice; consult a CPA.
Condition & rehab AI · 13 photos
This mobile home has cosmetic updates and needs some repairs and maintenance to improve its condition and value.
Repairs flagged
- Minor kitchen cabinets — dated and could be replaced
- Minor bathroom fixtures — outdated and could be updated
- Moderate exterior siding — moderate wear and could be repainted
Value-add opportunities
- Both paint exterior — enhances curb appeal and value
- Both replace kitchen cabinets — modernizes the space and adds value
- Both update bathroom fixtures — modernizes the space and adds value
Renovation cost estimate screening
| Repair item | Severity | Est. cost |
|---|---|---|
| kitchen cabinets · dated and could be replaced | Minor | $500–3,000 |
| bathroom fixtures · outdated and could be updated | Minor | $500–3,000 |
| exterior siding · moderate wear and could be repainted | Moderate | $3,000–15,000 |
| Total estimated repair cost · 3 items | $4,000–21,000 |
Value-add ROI direction
- Both paint exterior — enhances curb appeal and value ↑
- Both replace kitchen cabinets — modernizes the space and adds value ↑
- Both update bathroom fixtures — modernizes the space and adds value ↑
ⓘ Cost ranges are severity-bucket heuristics (US national rule-of-thumb). Get contractor quotes + a written scope before underwriting a rehab budget.
Schools (NCES district)
- District
- Washington District
- NCES district ID
- 4901140
- Math proficiency
- 42% ▼ -3.00%
- Reading proficiency
- 45% ▼ -3.00%
- Median HH income
- $50,861
- Composite
- 37.47/100
- National rank
- #4408
- State rank
- #37 of 80 in UT
Livability — St. George
No livability data for this city. (Only ~50 U.S. cities are tracked.)
Census & demographics
- Census place
- St. George, UT
- County
- Washington County · 179,216 people
- City population
- 101,579
- Metro
- St. George, UT
- Population (ZIP)
- 48,397
- Household income
- $70,024
- Rent vs Own
- Severe rent burden
- 1605.0
Population outlook (Washington County) Hauer SSP2
- Today (2025)
- 193,324 people
- By 2030
- 211,699 · +9.5%
- By 2040
- 246,449 · +27.5%
- By 2050
- 278,447 · +44.0%
- By 2075
- 342,734 · +77.3%
- By 2100
- 382,815 · +98.0%
Race, ethnicity, and origin ACS 2023
- Neighborhood character
- Predominantly White (79%)
- Race & ethnicity
- White 79% Hispanic / Latino 15% Two or more races 6% Native American 1% Asian 1%
- Hispanic origin (detail)
- Mexican 10%
- Common ancestry
- Italian 8% Slovak 4% Scottish 2%
- Foreign-born
- 8% · Canada, Vietnam
- Languages at home
- 86% English-only · Spanish 11% Other Indo-European 1% Vietnamese 1%
Political lean MEDSL · Washington
- 2024 margin
- Solid R (+52.3) · D 23.0% · R 75.2% · Other 1.8%
- 2008→2024 swing
- +1.2pp toward D · 2008: -53.5pp · 2024: -52.3pp
- All cycles
- 2024: R+52.3 2020: R+51.7 2016: R+52.1 2012: R+67.0 2008: R+53.5
Not yet ingested
- Civics
- —
Market trends
- HPI YoY
- ▼ -356.86%
- Current HPI
- 234.9418
- Rent YoY
- ▲ 2.42%
- Metro
- St. George, UT
- State GDP YoY
- ▲ 3.54%
- F500 in state
- 2
Industry mix (Fortune 500 HQ in UT)
| Industry | F500 HQs | Revenue |
|---|---|---|
| Financial Services | 1 | $3B |
|
||
Price history
+95.7% since first listed6 events — show timeline
- 2026-04-30 Price Changed $99,900 WCBOR
- 2026-04-17 Listed $109,900 WCBOR
- 2004-10-28 Sold (MLS) — WFRMLS
- 2004-09-10 Listed $25,900 WFRMLS
- 2004-04-05 Listing Removed — WFRMLS
- 2004-01-30 Listed $51,060 WFRMLS
Cash-flow waterfall
monthlySold comps — $/sqft
last 12 mo · ≤1 miLoading sold comps…