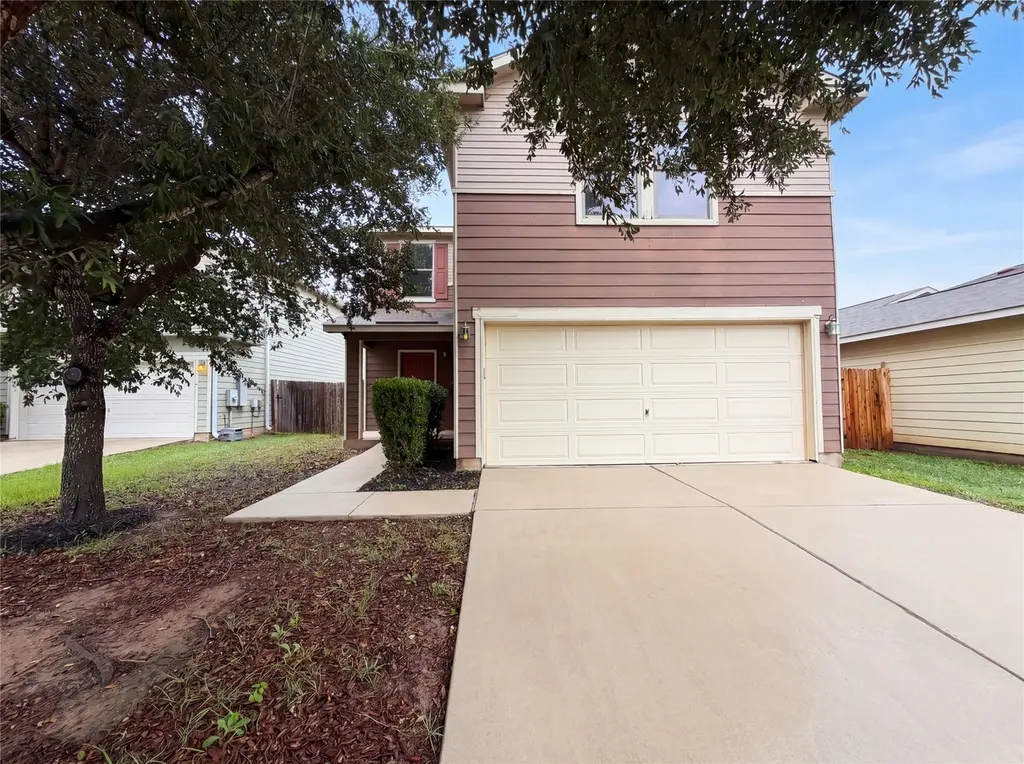
6009 Randleman Dr · Austin, TX
Flood risk 1/10 · Minimal
- FEMA flood zone
- X (unshaded)
- Chance of flooding over 30 yrs
- 0.0%
- Est. flood insurance / yr
- $507 – $1,088
Fire risk 4/10 · Minor
- Est. fire insurance / yr
- $1,222 – $2,270
Heat risk 8/10 · Major
- Hot days now (above 108°F)
- 7 days/yr
- Hot days in 30 yrs
- 22 days/yr
Wind risk 8/10 · Major
- Chance of severe wind over 30 yrs
- 80.0%
Air-quality risk 1/10 · Minimal
- Unhealthy air days now
- 0 days/yr
- Unhealthy air days in 30 yrs
- 0 days/yr
Risk factors via First Street. Map © Google.
Why this score? — see what drove the D- grade
The composite is a weighted blend of 9 inputs, each scored 0–100. Each bar is that input's sub-score; the figure is the points it added to the 100-point composite (weight × sub-score).
- ARV discount +13.8/15.0
- Cash flow +6.8/30.0
- Livability +4.1/5.0
- Appreciation +3.4/10.0
- 1% rule +3.0/10.0
- Condition / age +2.5/5.0
- Rent growth +2.4/5.0
- Schools +1.9/10.0
- DSCR +1.0/10.0
$255,000
🖨 Deal sheet (PDF) 📄 Offer letter ✓ Due diligence
Listing remarks
Experience recent updates at 6009 Randleman Dr, with fresh interior paint and partial flooring replacement providing a refreshed living environment. The kitchen features all stainless steel appliances, while the primary bathroom includes double sinks for enhanced functionality. The exterior space features a fully fenced in backyard. This home perfectly blends updates with practical comforts. Included 100-Day Home Warranty with buyer activation
Key facts
- Double sinks
- Fresh interior paint
- 4,630 sq ft lot
Tags
Property features AI
Finance
- Financial info: Financial assessments and taxes not included
- HOA & community: Homeowners association (Berdoll Farms) with quarterly fee of $121; HOA fee covers common area maintenance; Community pool
Exterior
- Parking: Attached garage; 2 covered parking spaces (total 2)
- Security: Owned security system
- Utilities: Electricity available; Public water; Public sewer
- Home design: 2 stories; Faces northwest; Resale property
- Construction: Brick construction; Asphalt roof; Slab foundation; Year built reported by owner
- Exterior features: Back yard fencing (wood); No additional exterior features listed; Community pool
Interior
- Kitchen: Dishwasher; Microwave; Range
- Bedrooms: At least one bedroom on the second floor
- Flooring: Carpet; Laminate
- Bathrooms: 2 full bathrooms; 1 half bathroom
- Heating & cooling: Central heating (electric); Central air conditioning (electric); Has heating and cooling
- Interior features: Security system (owned); None listed for other interior features
- Laundry & utility: Indoor laundry
Neighborhood map
What this means for you Summary
Snapshot
- This is a 3-bed/3.0-bath single-family listed at $255k.
Deal economics
- At list price, monthly cash flow is $-400 ($-5k/yr) — negative.
- To cash-flow at today's rent, offer at most $184k (27.7% below list).
- To meet the 1% rule (rent ≥ 1% of price), the offer needs to be $204k (20.2% below list).
- Recommended offer: $184k (27.7% below list) — sets the bar for cash-flow.
- Cap rate 4.4% vs local median 1.8% in Austin — top-decile yield for the area; either an underpriced asset or a hidden risk that comps aren't pricing in. Stress-test before assuming the spread holds.
Location & tenants
- Location reads 82/100 on livability (#16 in TX, #1,208 nationally) — a professional / high-income tenant draw. Strengths: amenities A+, commute A+, employment A+; Watch: cost of living D, crime F.
- Del Valle ISD (rural): math 19% / reading 26% proficiency, ranked #749 of 826 in TX (top 91%) — low school quality limits family demand, transient renter base, plan for 1-2y turnover; 77% free/reduced lunch — lower-income household profile, screen leases tightly.
- Zoned schools: Del Valle El (math 22% / reading 22%, grade F, #3,333 of 4,322 statewide, top 80%, 615 students, 89% FRL); Del Valle H S (math 17% / reading 28%, grade F, #1,354 of 1,632 statewide, top 83%, 3,460 students, 90% FRL).
- Market conditions: Rents soft (-0.4%/yr); 251 active listings in the ZIP; 26 comparable units currently listed for rent nearby; rentals at typical pace (median 20d on market — plan ~3-4 weeks tenant-placement turnaround); 17,121 units permitted in Travis County in 2024 (11,963 in 5+ unit buildings).
- This rent runs 34% of the median local income ($72k/yr) — at the standard rent-burdened threshold; future hikes will face affordability resistance.
Forward outlook
- Local home prices are declining (-3.0%/yr); year-one equity from $2k of loan paydown is wiped out by about $8k of value loss. Plan a longer hold.
- Travis County population projected at +60% by 2050 — long-run rental-demand tailwind backs the buy-and-hold thesis.
Negotiation context
- Only 12 days on market — expect competitive offers; lowballing is unlikely to land.
Risks & watch-outs
- Climate carrying-cost: severe wind risk, 80% chance of damaging wind over 30y; extreme-heat days projected 7→22/yr by 2055 (HVAC capex compounding) — expect insurance premiums to compound above CPI over the hold.
Questions for the listing agent
- What do current leases actually rent for vs. the listed asking? Can we see a recent rent roll and the last 12 months of T-12 income?
- What does the HOA fee cover, when was the last increase, and are there any pending special assessments or reserve-fund shortfalls?
- Is there a deadline driving the sale (1031 exchange, divorce, estate, relocation)? That informs how much negotiation room exists.
- Crime grade is F in this area — have there been break-ins, vandalism, or insurance claims at this property in the last 3 years? What carrier currently insures it and at what premium?
- The area grade is low — what's the realistic commute time and amenity access for the typical tenant pool here? Any planned neighborhood developments (good or bad) we should know about?
- What's the average days-on-market for RENTAL listings here right now (not sales)? A rising rental-DOM trend means longer vacancies and softer asking-rent achievability than the comps imply.
- What's the recent tenant-quality profile in this submarket — average credit score on applications, eviction rate, late-payment / NSF rate, and stable-employment percentage? A property-management company in the area should have these aggregated.
- How much new for-sale + rental construction is in the pipeline within 1–3 miles? Heavy new supply typically softens prices + rents 12–24 months out; constrained supply supports both.
Investment metrics
- 1% rule
- 0.80% ✗
- Cap rate
- 4.41%
- Cash-on-cash
- -6.72%
- DSCR
- 0.70
- GRM
- 10.4
CMA / ARV
- ARV (median comp)
- $296,501
- List price
- $255,000
- Delta
- -14.00%
- Verdict
- UNDERPRICED
- Comps
- 20 within 1.0 mi
Show comp detail 12 sales within ~0.75 mi
| Address | Dist | Beds/Ba | Sqft | Sold | Price | $/sf | Match |
|---|---|---|---|---|---|---|---|
| 6009 Randleman Dr | 0.00mi | 3/2.5 | 2,068 (0%) | 0mo | $255,000 | $123 | 98 |
| 13209 Thome Valley Dr | 0.27mi | 4/2.5 (+1) | 2,068 (0%) | 3mo | $199,900 | $97 | 78 |
| 13521 Sea Biscuit Dr | 0.21mi | 4/2.5 (+1) | 1,966 (-5%) | 2mo | $161,200 | $82 | 73 |
| 5325 Mathra Dr | 0.51mi | 3/2.5 | 2,068 (0%) | 2mo | $204,900 | $99 | 72 |
| 5901 Beverly Prairie Rd | 0.47mi | 4/2.5 (+1) | 2,078 (+0%) | 1mo | $349,690 | $168 | 69 |
| 5408 Tessa Cv | 0.60mi | 4/3.0 (+1) | 1,917 (-7%) | 1mo | $275,000 | $143 | 54 |
| 5816 Swedish Farms Ter | 0.51mi | 4/3.0 (+1) | 1,877 (-9%) | 3mo | $336,600 | $179 | 53 |
| 14125 Matterod Dr | 0.55mi | 4/2.5 (+1) | 2,235 (+8%) | 3mo | $344,950 | $154 | 52 |
| 14116 Edna Maxine Walk | 0.66mi | 3/2.5 | 1,876 (-9%) | 2mo | $348,990 | $186 | 50 |
| 14120 Edna Maxine Walk | 0.67mi | 4/2.5 (+1) | 2,207 (+7%) | 3mo | $372,990 | $169 | 48 |
| 14101 Axel Johanson Dr | 0.54mi | 4/3.0 (+1) | 2,350 (+14%) | 1mo | $395,690 | $168 | 46 |
| 14120 Axel Johanson Dr | 0.59mi | 4/3.0 (+1) | 2,350 (+14%) | 2mo | $385,490 | $164 | 43 |
Match score weights: distance 35% · size 25% · config 20% · recency 20%. Top-matched comps best support the ARV.
Projected returns pro-forma
-3.0% appreciation · 0.0% rent growth · sell at horizon
- IRR
- -31.8%
- Equity multiple
- -0.02×
- Total profit
- $-72,580
- Equity at exit
- $38,021
- IRR
- -61.8%
- Equity multiple
- -0.66×
- Total profit
- $-118,319
- Equity at exit
- $22,048
Cash invested: $71,400 (down + closing). Projections, not guarantees.
Landlord ↔ Tenant lean methodology
- Overall (STATE)
- 87 Strongly Landlord-Friendly
- State Texas
- 87 Strongly Landlord-Friendly · R+5
- County
- — inherits STATE
- City
- — inherits STATE
ZIP-level market 78617
- Home prices YoY
- -1.7%
- Rents YoY
- -0.4%
- Active inventory
- 251
- Price-to-rent
- 10.4×
Monthly cashflow live
- Estimated rent
- $2,035 high interval (Pro) →
- Mortgage (P&I)
- −$1,337
- Tax from tax record
- −$524 /mo · $6,293/yr
- Insurance
- −$106
- HOA
- −$40
- Vacancy / Maint / Mgmt
- −$427
- Net cashflow
- $-400
Break-even live
Sensitivity live
| Price | -10% $-256 | -5% $-328 | +0% $-400 | +5% $-472 | +10% $-544 |
|---|---|---|---|---|---|
| Rent | -10% $-561 | -5% $-480 | +0% $-400 | +5% $-320 | +10% $-239 |
| Rate | -1.0pp $-272 | -0.5pp $-335 | base $-400 | +0.5pp $-466 | +1.0pp $-533 |
UW: 25.0% down · 7.5% · 30yr · 1.5% tax · 5.0% vac · 8.0% maint · 8.0% mgmt
Financing live
Cash to close
- Down payment
- $63,750
- Closing costs
- $7,650
- Reserves months
- —
- Total cash needed
- —
Loan-product check · same deal, 3 products live
Conventional
25% down · 7.5% · 30yr
- Down + closing
- —
- Monthly P&I
- —
- Monthly cashflow
- —
- DSCR
- —
- Eligible?
- —
Personal DTI + credit; lowest rate.
DSCR
20% down · 8.5% · 30yr
- Down + closing
- —
- Monthly P&I
- —
- Monthly cashflow
- —
- DSCR
- —
- Eligible?
- —
No personal income docs; deal must DSCR.
Hard money
10% down · 12.0% · 12mo
- Down + closing
- —
- Monthly P&I
- —
- Monthly cashflow
- —
- DSCR
- —
- Eligible?
- —
Short-term bridge; refi at stabilization.
Rent comps 26 comps
| Address | Beds | Baths | Sqft | Rent | $/sqft | DOM | Units | Dist |
|---|---|---|---|---|---|---|---|---|
| 13400 Coomes Dr Del Valle, TX | 3.0 | 2.5 | 1625 | $1,895 | $1.17 | 5d | 1 | 0.15mi |
| 13400 Coomes Dr Del Valle, TX | 3.0 | 2.0 | 1625 | $1,895 | $1.17 | 6d | 1 | 0.15mi |
| 13229 Coomes Dr Del Valle, TX | 3.0 | 2.0 | 1703 | $1,995 | $1.17 | 14d | 1 | 0.20mi |
| 5600 War Admiral Dr Del Valle, TX | 4.0 | 2.5 | 2101 | $2,200 | $1.05 | 5d | 1 | 0.27mi |
| 5525 Victory Gallop Dr Del Valle, TX | 3.0 | 2.5 | 1788 | $1,850 | $1.03 | 45d | 1 | 0.27mi |
| 5521 Victory Gallop Dr Del Valle, TX | 3.0 | 2.5 | 1788 | $2,000 | $1.12 | 16d | 1 | 0.28mi |
| 13109 Lofton Cliff Dr Del Valle, TX | 3.0 | 2.0 | 1917 | $2,075 | $1.08 | 14d | 1 | 0.37mi |
| 13817 Gilwell Dr Del Valle, TX | 4.0 | 3.0 | 1878 | $2,195 | $1.17 | 45d | 1 | 0.48mi |
| 5204 Bahan Dr Del Valle, TX | 4.0 | 2.5 | 2640 | $1,900 | $0.72 | 4d | 1 | 0.50mi |
| 13917 Gilwell Dr Del Valle, TX | 3.0 | 2.5 | 1743 | $2,100 | $1.20 | 19d | 1 | 0.51mi |
| 14005 Edna Maxine Walk Del Valle, TX | 3.0 | 2.5 | 1932 | $2,100 | $1.09 | 45d | 1 | 0.56mi |
| 5804 Swedish Farms TER Del Valle, TX | 4.0 | 3.0 | 1903 | $2,200 | $1.16 | 45d | 1 | 0.64mi |
| 5032 Irvine Ln Del Valle, TX | 4.0 | 2.5 | 2499 | $2,200 | $0.88 | 23d | 1 | 0.76mi |
| 4917 Stockton Ln Del Valle, TX | 4.0 | 2.5 | 2334 | $2,400 | $1.03 | 45d | 1 | 0.84mi |
| 12604 Paloma Blanca Way Del Valle, TX | 3.0 | 2.0 | 1423 | $1,700 | $1.19 | 18d | 1 | 0.90mi |
| 12417 Sky Harbor Dr Del Valle, TX | 3.0 | 2.0 | 1586 | $1,975 | $1.25 | 25d | 1 | 0.99mi |
| 6200 Albany Sleigh Dr Del Valle, TX | 3.0 | 2.0 | 1647 | $2,350 | $1.43 | 45d | 1 | 1.28mi |
| 12821 Stoney Ridge Bnd Del Valle, TX | 3.0 | 2.5 | 2281 | $2,250 | $0.99 | 19d | 1 | 1.37mi |
| 6316 Carriage Pines Dr Del Valle, TX | 3.0 | 2.5 | 2305 | $2,300 | $1.00 | 45d | 1 | 1.41mi |
| 6420 Carriage Pines Dr Del Valle, TX | 3.0 | 2.5 | 1665 | $1,995 | $1.20 | 45d | 1 | 1.44mi |
| 6409 Wagon Spring St Del Valle, TX | 4.0 | 2.0 | 1421 | $1,895 | $1.33 | 18d | 1 | 1.44mi |
| 6417 Wagon Spring St Del Valle, TX | 3.0 | 2.5 | 2230 | $2,100 | $0.94 | 14d | 1 | 1.45mi |
| 6417 Wagon Spring St Del Valle, TX | 3.0 | 2.5 | 2230 | $2,149 | $0.96 | 45d | 1 | 1.45mi |
| 6400 Wagon Spring St Del Valle, TX | 3.0 | 2.5 | 1665 | $1,975 | $1.19 | 6d | 1 | 1.46mi |
| 6408 Wagon Spring St Del Valle, TX | 4.0 | 3.0 | 2497 | $2,495 | $1.00 | 45d | 1 | 1.47mi |
| 12316 Noel Bain Cv Del Valle, TX | 3.0 | 2.5 | 2281 | $2,100 | $0.92 | 4d | 1 | 1.48mi |
HOA detail
- Monthly dues
- $40 · $480/yr
Listing history 3 events
-
2026-05-05status Pending 447-char remark
-
2026-04-23$255,000 Active 447-char remark
-
2026-03-27soldstatus
ⓘ Source: listings_history table (triggers on properties + properties_extension) + one-shot
backfill from property_details.listing_events for pre-trigger history.
Tax reassessment forecast TX · Resets to sale price
- Current annual tax
- $6,293 · $524/mo
- Projected year-2 tax
- $6,293 · $524/mo
- Expected delta
- $0/yr ($0/mo · 0.0%)
ⓘ Screening estimate from a state-policy table — verify with the county assessor before closing.
Climate risk First Street
- Flood 1/10 Low FEMA zone X (unshaded) · 0% chance over 30 yrs
- Wildfire 4/10 Moderate
- Heat 8/10 Severe 7 d/yr ≥108°F today · 22 d/yr by 30 yrs out
- Wind 8/10 Severe 80% chance of damaging wind over 30 yrs
- Air quality 1/10 Low 0 unhealthy d/yr today · 0 by 30 yrs out
Nearby sold comps map
Loading sold comps map…
Walkable amenities ~0.75 mi
Loading nearby amenities…
Taxation est. · year 1
- Rental income
- $24,425
- − Mortgage interest
- −$14,284
- − Property taxes
- −$6,293
- − Insurance
- −$1,275
- − Repairs & maintenance
- −$1,954
- − Management
- −$1,954
- − HOA
- −$480
- − Depreciation
- −$7,418
- Taxable loss
- −$9,234
- Est. tax savings @ 24.0%
- +$2,216
- After-tax cash flow
- $-2,584/yr
For passive investors: Depreciation is non-cash, so a rental often shows a tax loss while cash-flowing — sheltering income. Rental losses are passive: they offset passive income freely, and up to $25,000/yr can offset ordinary (W-2) income if you actively participate and your MAGI is under $100k (phasing out to $0 by $150k); unused losses carry forward. On sale, claimed depreciation is recaptured at up to 25%, and gains may owe capital-gains tax (a 1031 exchange can defer both). Figures are a year-1 estimate at your 24.0% rate — not tax advice; consult a CPA.
Schools (NCES district)
- District
- Del Valle ISD
- NCES district ID
- 4816620
- Math proficiency
- 19% ▼ -13.00%
- Reading proficiency
- 26% ▼ -2.00%
- Median HH income
- $41,322
- Composite
- 19.13/100
- National rank
- #8830
- State rank
- #749 of 826 in TX
Livability — Austin
- Score
- 82/100
- State rank
- #16
- US rank
- #1208
Category grades
Schools grade is shown separately in the Schools card above.
Census & demographics
- Census place
- Austin, TX
- County
- Travis County · 1,299,254 people
- City population
- 1,066,854
- Metro
- Austin-Round Rock-Georgetown, TX
- Population (ZIP)
- 30,756
- Household income
- $71,640
- Rent vs Own
- Severe rent burden
- 681.0
Population outlook (Travis County) Hauer SSP2
- Today (2025)
- 1,545,133 people
- By 2030
- 1,729,269 · +11.9%
- By 2040
- 2,097,596 · +35.8%
- By 2050
- 2,463,890 · +59.5%
- By 2075
- 3,249,374 · +110.3%
- By 2100
- 3,801,868 · +146.1%
Race, ethnicity, and origin ACS 2023
- Neighborhood character
- Predominantly Hispanic (75%)
- Race & ethnicity
- Hispanic / Latino 75% Two or more races 33% White 16% Black 6% Asian 1%
- Hispanic origin (detail)
- Mexican 68% Puerto Rican 1%
- Common ancestry
- Romanian 1%
- Foreign-born
- 26% · Canada
- Languages at home
- 41% English-only · Spanish 57% Other Asian/Pacific 1%
Political lean MEDSL · Travis
- 2024 margin
- Solid D (+39.3) · D 68.8% · R 29.4% · Other 1.8%
- 2008→2024 swing
- +9.9pp toward D · 2008: 29.4pp · 2024: 39.3pp
- All cycles
- 2024: D+39.3 2020: D+45.0 2016: D+38.9 2012: D+23.9 2008: D+29.4
Not yet ingested
- Civics
- —
Market trends
- HPI YoY
- ▼ -3.24%
- Current HPI
- 192.3518
- Rent YoY
- ▼ -0.36%
- Metro
- Austin-Round Rock-Georgetown, TX
- State GDP YoY
- ▲ 3.95%
- F500 in state
- 110
Industry mix (Fortune 500 HQ in TX)
| Industry | F500 HQs | Revenue |
|---|---|---|
| Energy | 16 | $1,198B |
|
||
| Technology | 5 | $198B |
|
||
| Engineering / Construction | 4 | $72B |
|
||
| Energy Services | 3 | $60B |
|
||
| Utilities | 3 | $41B |
|
||
| Healthcare | 2 | $330B |
|
||
Price history
4 events — show timeline
- 2026-06-11 Sold (MLS) — Unlock MLS
- 2026-05-05 Pending — Unlock MLS
- 2026-04-23 Listed $255,000 Unlock MLS
- 2026-03-27 Sold (Public Records) — Public Records
Property tax history
+20.5%/yrLatest (2026): $6,293 · -5.3% YoY. Source: county tax records.
Cash-flow waterfall
monthlySold comps — $/sqft
last 12 mo · ≤1 miLoading sold comps…