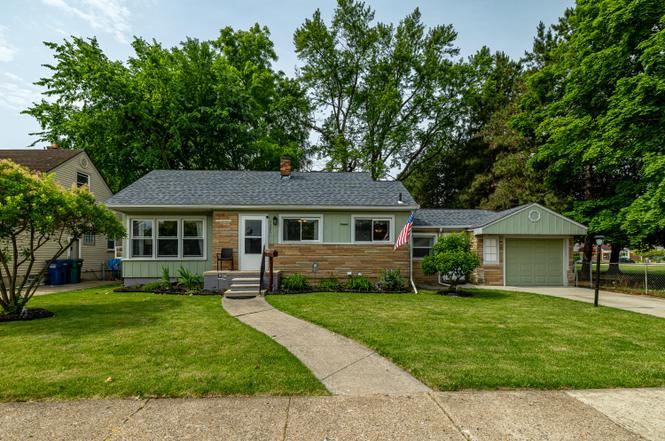
2225 Mclain Ave · Lincoln Park, MI
Flood risk 1/10 · Minimal
- FEMA flood zone
- X (unshaded)
- Chance of flooding over 30 yrs
- 0.0%
- Est. flood insurance / yr
- $473 – $860
Fire risk 1/10 · Minimal
- Est. fire insurance / yr
- $784 – $1,456
Heat risk 3/10 · Minor
- Hot days now (above 96°F)
- 7 days/yr
- Hot days in 30 yrs
- 15 days/yr
Wind risk 2/10 · Minimal
- Chance of severe wind over 30 yrs
- —
Air-quality risk 3/10 · Minor
- Unhealthy air days now
- 2 days/yr
- Unhealthy air days in 30 yrs
- 4 days/yr
Risk factors via First Street. Map © Google.
Why this score? — see what drove the F grade
The composite is a weighted blend of 9 inputs, each scored 0–100. Each bar is that input's sub-score; the figure is the points it added to the 100-point composite (weight × sub-score).
- Cash flow +11.3/30.0
- Livability +4.0/5.0
- Rent growth +3.7/5.0
- DSCR +3.3/10.0
- 1% rule +2.7/10.0
- Condition / age +2.5/5.0
- Schools +2.0/10.0
- ARV discount +0.0/15.0
- Appreciation +0.0/10.0
$189,900
🖨 Deal sheet (PDF) 📄 Offer letter ✓ Due diligence
Listing remarks MLS
Great open floor plan ranch has a spectacular lot in a great neighborhood. This home adjoins Boccabella Park in Allen Park and offers great privacy. Other special features are an attached garage, sunroom family room , covered rear patio, hardwood floors throughout. and a full finished basement with 2nd full bath and room for an additional bedroom . The home has a new roof and the appliances come with it . The living room, breakfast room and kitchen are bright and flow together for a spacious open feel . The bedrooms are good sizes with good closet space . Low Lincoln park taxes make this house a 10 ! OPEN HOUSE SATURDAY, June 20th 1-4 .
Key facts
- Open floor plan
- Sunroom family room
- Attached garage
Tags
Property features AI
Exterior
- Parking: Attached garage (1.5 garage spaces)
- Utilities: Public water; Public sewer; Natural gas
- Home design: Ranch-style single-family residence; Built in 1950
- Construction: Stone and wood siding exterior; Asphalt roof; Built 1950
- Exterior features: Sidewalk; Paved road access; Lot approximately 0.17 acres
Interior
- Kitchen: Dishwasher; Range; Refrigerator
- Bathrooms: 2 full bathrooms
- Heating & cooling: Forced air heating; Wall air conditioning unit(s)
- Interior features: Garage door opener; Eat-in kitchen; Screens; Insulated windows; Window treatments; Full basement; Seven total rooms
- Laundry & utility: Washer; Dryer; Natural gas water heater
Neighborhood map
What this means for you Summary
Snapshot
- This is a 3-bed/2.0-bath single-family listed at $190k.
Deal economics
- At list price, monthly cash flow is $-70 ($-838/yr) — negative.
- To cash-flow at today's rent, offer at most $178k (6.5% below list).
- To meet the 1% rule (rent ≥ 1% of price), the offer needs to be $147k (22.8% below list).
- Recommended offer: $147k (22.8% below list) — sets the bar for 1% rule.
Location & tenants
- Location reads 80/100 on livability (#82 in MI, #1,720 nationally) — a professional / high-income tenant draw. Strengths: amenities A+, commute A+, cost of living A+; Watch: crime F, employment D-.
- Lincoln Park School District (suburban): math 15% / reading 32% proficiency, ranked #440 of 540 in MI (top 82%) — low school quality limits family demand, transient renter base, plan for 1-2y turnover; 72% free/reduced lunch — lower-income household profile, screen leases tightly.
- Zoned schools: Max Paun School (math 32% / reading 32%, grade F, #814 of 1,397 statewide, top 61%, 311 students, 92% FRL); Lincoln Park Middle School (math 12% / reading 35%, grade F, #399 of 493 statewide, top 81%, 1,105 students, 86% FRL); Lincoln Park High School (math 5% / reading 33%, grade F, #630 of 713 statewide, top 88%, 1,367 students, 79% FRL).
- Market conditions: Rents rising fast (+4.7%/yr); 154 active listings in the ZIP; 12 comparable units currently listed for rent nearby; rentals at typical pace (median 20d on market — plan ~3-4 weeks tenant-placement turnaround); 2,639 units permitted in Wayne County in 2024 (1,216 in 5+ unit buildings).
- This rent runs 30% of the median local income ($59k/yr) — at the standard rent-burdened threshold; future hikes will face affordability resistance.
Forward outlook
- Local home prices are declining (-3.0%/yr); year-one equity from $1k of loan paydown is wiped out by about $6k of value loss. Plan a longer hold.
- Wayne County population projected at -17% by 2050 — secular population decline; favor cash flow + early exit over multi-decade hold.
Negotiation context
- Only 3 days on market — expect competitive offers; lowballing is unlikely to land.
- 5 sale attempts since 12y ago with the ask held roughly flat each time — persistent listings suggest the price (not the market) is what's stuck; bring a comps-based counter.
- Current owner paid $50k; list at $190k implies a 280% gain — meaningful room to come down on a strong offer.
Risks & watch-outs
- Watch-outs: built in 1950 — expect roof / HVAC / electrical / plumbing capex.
Questions for the listing agent
- What do current leases actually rent for vs. the listed asking? Can we see a recent rent roll and the last 12 months of T-12 income?
- Built in 1950 — when were the roof, HVAC, electrical panel, plumbing, and water heater last replaced?
- Is there a deadline driving the sale (1031 exchange, divorce, estate, relocation)? That informs how much negotiation room exists.
- Schools are D-rated, which usually means shorter tenancies and higher turnover. Who's the typical renter profile here, and what's been the actual vacancy rate?
- Crime grade is F in this area — have there been break-ins, vandalism, or insurance claims at this property in the last 3 years? What carrier currently insures it and at what premium?
- The area grade is low — what's the realistic commute time and amenity access for the typical tenant pool here? Any planned neighborhood developments (good or bad) we should know about?
- What's the average days-on-market for RENTAL listings here right now (not sales)? A rising rental-DOM trend means longer vacancies and softer asking-rent achievability than the comps imply.
- What's the recent tenant-quality profile in this submarket — average credit score on applications, eviction rate, late-payment / NSF rate, and stable-employment percentage? A property-management company in the area should have these aggregated.
- How much new for-sale + rental construction is in the pipeline within 1–3 miles? Heavy new supply typically softens prices + rents 12–24 months out; constrained supply supports both.
Investment metrics
- 1% rule
- 0.77% ✗
- Cap rate
- 5.85%
- Cash-on-cash
- -1.58%
- DSCR
- 0.93
- GRM
- 10.8
CMA / ARV
- ARV (on-the-fly)
- $148,896
- Comps found
- 12
Show comp detail 12 sales within ~0.75 mi
| Address | Dist | Beds/Ba | Sqft | Sold | Price | $/sf | Match |
|---|---|---|---|---|---|---|---|
| 2162 White Ave | 0.26mi | 3/1.0 | 858 (+8%) | 7mo | $90,000 | $105 | 64 |
| 1969 Regina Ave | 0.23mi | 2/2.0 (-1) | 690 (-13%) | 4mo | $130,000 | $188 | 59 |
| 2365 Progress Ave | 0.39mi | 2/1.0 (-1) | 715 (-10%) | 3mo | $134,900 | $189 | 54 |
| 1765 Garfield Ave | 0.49mi | 3/1.0 | 886 (+12%) | 1mo | $165,000 | $186 | 53 |
| 2355 Progress Ave | 0.40mi | 2/1.0 (-1) | 715 (-10%) | 5mo | $115,000 | $161 | 52 |
| 1766 White Ave | 0.52mi | 3/1.0 | 900 (+14%) | 2mo | $165,000 | $183 | 47 |
| 15022 Jonas Ave | 0.40mi | 2/1.0 (-1) | 910 (+15%) | 5mo | $176,000 | $193 | 43 |
| 1588 Garfield Ave | 0.73mi | 2/1.0 (-1) | 864 (+9%) | 2mo | $128,000 | $148 | 40 |
| 2216 Detroit Ave | 0.53mi | 2/1.0 (-1) | 685 (-14%) | 6mo | $137,000 | $200 | 38 |
| 1770 Rose Ave | 0.64mi | 2/1.0 (-1) | 690 (-13%) | 3mo | $140,000 | $203 | 37 |
| 1779 Progress Ave | 0.70mi | 2/1.0 (-1) | 690 (-13%) | 1mo | $121,000 | $175 | 36 |
| 15445 Markese Ave | 0.51mi | 2/1.0 (-1) | 902 (+14%) | 11mo | $200,000 | $222 | 35 |
Match score weights: distance 35% · size 25% · config 20% · recency 20%. Top-matched comps best support the ARV.
Projected returns pro-forma
-3.0% appreciation · 4.65% rent growth · sell at horizon
- IRR
- -17.2%
- Equity multiple
- 0.38×
- Total profit
- $-32,777
- Equity at exit
- $28,315
- IRR
- -6.6%
- Equity multiple
- 0.55×
- Total profit
- $-23,894
- Equity at exit
- $16,419
Cash invested: $53,172 (down + closing). Projections, not guarantees.
Landlord ↔ Tenant lean methodology
- Overall (STATE)
- 62 Landlord-Friendly
- State Michigan
- 62 Landlord-Friendly · EVEN
- County
- — inherits STATE
- City
- — inherits STATE
ZIP-level market 48146
- Home prices YoY
- -32.7%
- Rents YoY
- 4.7%
- Active inventory
- 154
- Price-to-rent
- 10.8×
Monthly cashflow live
- Estimated rent
- $1,466 high interval (Pro) →
- Mortgage (P&I)
- −$996
- Tax from tax record
- −$153 /mo · $1,833/yr
- Insurance
- −$79
- HOA
- −$0
- Vacancy / Maint / Mgmt
- −$308
- Net cashflow
- $-70
Break-even live
Sensitivity live
| Price | -10% $38 | -5% $-16 | +0% $-70 | +5% $-124 | +10% $-177 |
|---|---|---|---|---|---|
| Rent | -10% $-186 | -5% $-128 | +0% $-70 | +5% $-12 | +10% $46 |
| Rate | -1.0pp $26 | -0.5pp $-22 | base $-70 | +0.5pp $-119 | +1.0pp $-169 |
UW: 25.0% down · 7.5% · 30yr · 1.5% tax · 5.0% vac · 8.0% maint · 8.0% mgmt
Financing live
Cash to close
- Down payment
- $47,475
- Closing costs
- $5,697
- Reserves months
- —
- Total cash needed
- —
Loan-product check · same deal, 3 products live
Conventional
25% down · 7.5% · 30yr
- Down + closing
- —
- Monthly P&I
- —
- Monthly cashflow
- —
- DSCR
- —
- Eligible?
- —
Personal DTI + credit; lowest rate.
DSCR
20% down · 8.5% · 30yr
- Down + closing
- —
- Monthly P&I
- —
- Monthly cashflow
- —
- DSCR
- —
- Eligible?
- —
No personal income docs; deal must DSCR.
Hard money
10% down · 12.0% · 12mo
- Down + closing
- —
- Monthly P&I
- —
- Monthly cashflow
- —
- DSCR
- —
- Eligible?
- —
Short-term bridge; refi at stabilization.
Rent comps 12 comps
| Address | Beds | Baths | Sqft | Rent | $/sqft | DOM | Units | Dist |
|---|---|---|---|---|---|---|---|---|
| 2235 Moore Rd Unit 1 Lincoln Park, MI | 2.0 | 1.0 | 800 | $1,000 | $1.25 | 26d | 1 | 0.83mi |
| 15806 Meyer Ave Allen Park, MI | 3.0 | 2.0 | 1100 | $1,650 | $1.50 | 3d | 1 | 0.86mi |
| 1552 Hanover St Lincoln Park, MI | 2.0 | 1.0 | 800 | $1,250 | $1.56 | 26d | 1 | 0.90mi |
| 9725 Fox Ave Allen Park, MI | 3.0 | 1.5 | 940 | $1,850 | $1.97 | 45d | 1 | 0.98mi |
| 1532 Euclid St #1 Lincoln Park, MI | 2.0 | 1.0 | 850 | $1,450 | $1.71 | 26d | 1 | 1.10mi |
| 9725 Ruth Allen Park, MI | 3.0 | 1.5 | 1110 | $1,800 | $1.62 | 4d | 1 | 1.11mi |
| 9814 Quandt Ave Allen Park, MI | 3.0 | 2.0 | 1050 | $1,800 | $1.71 | 45d | 1 | 1.26mi |
| 1774 College Ave Lincoln Park, MI | 3.0 | 1.0 | 944 | $1,525 | $1.62 | 0d | 1 | 1.27mi |
| 1524 Cicotte Ave Lincoln Park, MI | 2.0 | 1.0 | 900 | $1,250 | $1.39 | 16d | 1 | 1.28mi |
| 1343 Pagel Ave Unit 2-Upper Lincoln Park, MI | 2.0 | 1.0 | 1000 | $1,250 | $1.25 | 19d | 1 | 1.36mi |
| 1774 Council Ave Lincoln Park, MI | 3.0 | 1.0 | 864 | $1,500 | $1.74 | 0d | 1 | 1.47mi |
| 1537 Chandler Ave Lincoln Park, MI | 2.0 | 1.0 | 725 | $1,100 | $1.52 | 19d | 1 | 1.48mi |
Listing history 3 events
-
2026-06-21days on market $189,900 Active 3 DOM
-
2026-06-19remarks 646-char remark
-
2026-06-19$189,900 Active 1 DOM
ⓘ Source: listings_history table (triggers on properties + properties_extension) + one-shot
backfill from property_details.listing_events for pre-trigger history.
Tax reassessment forecast MI · Partial reset (capped growth)
- Current annual tax
- $1,833 · $153/mo
- Projected year-2 tax
- $2,379 · $198/mo
- Expected delta
- +$546/yr (+$45/mo · 29.8%)
ⓘ Screening estimate from a state-policy table — verify with the county assessor before closing.
Climate risk First Street
- Flood 1/10 Low FEMA zone X (unshaded) · 0% chance over 30 yrs
- Wildfire 1/10 Low
- Heat 3/10 Moderate 7 d/yr ≥96°F today · 15 d/yr by 30 yrs out
- Wind 2/10 Low
- Air quality 3/10 Moderate 2 unhealthy d/yr today · 4 by 30 yrs out
Nearby sold comps map
Loading sold comps map…
Walkable amenities ~0.75 mi
Loading nearby amenities…
Taxation est. · year 1
- Rental income
- $17,588
- − Mortgage interest
- −$10,637
- − Property taxes
- −$1,833
- − Insurance
- −$950
- − Repairs & maintenance
- −$1,407
- − Management
- −$1,407
- − Depreciation
- −$5,524
- Taxable loss
- −$4,170
- Est. tax savings @ 24.0%
- +$1,001
- After-tax cash flow
- $163/yr
For passive investors: Depreciation is non-cash, so a rental often shows a tax loss while cash-flowing — sheltering income. Rental losses are passive: they offset passive income freely, and up to $25,000/yr can offset ordinary (W-2) income if you actively participate and your MAGI is under $100k (phasing out to $0 by $150k); unused losses carry forward. On sale, claimed depreciation is recaptured at up to 25%, and gains may owe capital-gains tax (a 1031 exchange can defer both). Figures are a year-1 estimate at your 24.0% rate — not tax advice; consult a CPA.
Schools (NCES district)
- District
- Lincoln Park School District
- NCES district ID
- 2621600
- Math proficiency
- 15% ▼ -5.00%
- Reading proficiency
- 32% ▬ 0.00%
- Median HH income
- $41,486
- Composite
- 19.93/100
- National rank
- #8678
- State rank
- #440 of 540 in MI
Livability — Lincoln Park
- Score
- 80/100
- State rank
- #82
- US rank
- #1720
Category grades
Schools grade is shown separately in the Schools card above.
Census & demographics
- Census place
- Lincoln Park, MI
- County
- Wayne County · 1,562,939 people
- City population
- 39,257
- Metro
- Detroit-Warren-Dearborn, MI
- Population (ZIP)
- 39,257
- Household income
- $58,616
- Rent vs Own
- Severe rent burden
- 1142.0
Population outlook (Wayne County) Hauer SSP2
- Today (2025)
- 1,675,273 people
- By 2030
- 1,620,300 · -3.3%
- By 2040
- 1,502,341 · -10.3%
- By 2050
- 1,384,039 · -17.4%
- By 2075
- 1,124,592 · -32.9%
- By 2100
- 881,193 · -47.4%
Race, ethnicity, and origin ACS 2023
- Neighborhood character
- Diverse neighborhood (Simpson 0.57)
- Race & ethnicity
- White 60% Hispanic / Latino 25% Two or more races 12% Black 9% Native American 1%
- Hispanic origin (detail)
- Mexican 19% Puerto Rican 3%
- Common ancestry
- Romanian 6% Lithuanian 4% Slovak 1%
- Foreign-born
- 9% · Canada
- Languages at home
- 80% English-only · Spanish 17% Arabic 2%
Political lean MEDSL · Wayne
- 2024 margin
- Strong D (+29.0) · D 62.7% · R 33.7% · Other 3.6%
- 2008→2024 swing
- -20.5pp toward R · 2008: 49.5pp · 2024: 29.0pp
- All cycles
- 2024: D+29.0 2020: D+38.1 2016: D+37.3 2012: D+46.9 2008: D+49.5
Not yet ingested
- Civics
- —
Market trends
- HPI YoY
- ▼ -108.25%
- Current HPI
- 222.8545
- Rent YoY
- ▲ 4.65%
- Metro
- Detroit-Warren-Dearborn, MI
- State GDP YoY
- ▲ 1.37%
- F500 in state
- 28
Industry mix (Fortune 500 HQ in MI)
| Industry | F500 HQs | Revenue |
|---|---|---|
| Automotive Parts | 3 | $48B |
|
||
| Automotive | 2 | $372B |
|
||
| Chemicals | 1 | $45B |
|
||
| Automotive Retail | 1 | $29B |
|
||
| Healthcare / Medical Devices | 1 | $23B |
|
||
| Automotive Technology | 1 | $20B |
|
||
Price history
+233.2% since first listed10 events — show timeline
- 2026-06-18 Listed $189,900 MiRealSource-MiMLS
- 2026-06-18 Listed $189,900 SW Michigan MLS
- 2026-06-18 Listed $189,900 REALCOMP
- 2014-10-22 Sold (Public Records) $50,000 Public Records
- 2014-09-26 Sold (MLS) $50,000 MiRealSource-MiMLS
- 2014-09-26 Sold (MLS) $50,000 REALCOMP
- 2014-09-10 Listing Removed — MiRealSource-MiMLS
- 2014-08-12 Listed $54,900 MiRealSource-MiMLS
- 2014-08-12 Listed $54,900 REALCOMP
- 1994-07-19 Sold (Public Records) $57,000 Public Records
Property tax history
+2.2%/yrLatest (2025): $1,833 · +0.7% YoY. Source: county tax records.
Cash-flow waterfall
monthlySold comps — $/sqft
last 12 mo · ≤1 miLoading sold comps…