291 Clinton Corners Rd · Salt Point, NY
Flood risk 1/10 · Minimal
- FEMA flood zone
- X (unshaded)
- Chance of flooding over 30 yrs
- 0.0%
- Est. flood insurance / yr
- $473 – $860
Fire risk 3/10 · Minor
- Est. fire insurance / yr
- $691 – $1,283
Heat risk 4/10 · Minor
- Hot days now (above 98°F)
- 7 days/yr
- Hot days in 30 yrs
- 16 days/yr
Wind risk 4/10 · Minor
- Chance of severe wind over 30 yrs
- 13.0%
Air-quality risk 2/10 · Minimal
- Unhealthy air days now
- 1 days/yr
- Unhealthy air days in 30 yrs
- 3 days/yr
Risk factors via First Street. Map © Google.
Why this score? — see what drove the B+ grade
The composite is a weighted blend of 9 inputs, each scored 0–100. Each bar is that input's sub-score; the figure is the points it added to the 100-point composite (weight × sub-score).
- Cash flow +30.0/30.0
- DSCR +10.0/10.0
- Appreciation +10.0/10.0
- 1% rule +8.8/10.0
- ARV discount +5.8/15.0
- Schools +5.8/10.0
- Rent growth +2.5/5.0
- Condition / age +2.5/5.0
- Livability +1.7/5.0
$625,000
🖨 Deal sheet (PDF) 📄 Offer letter ✓ Due diligence
Listing remarks
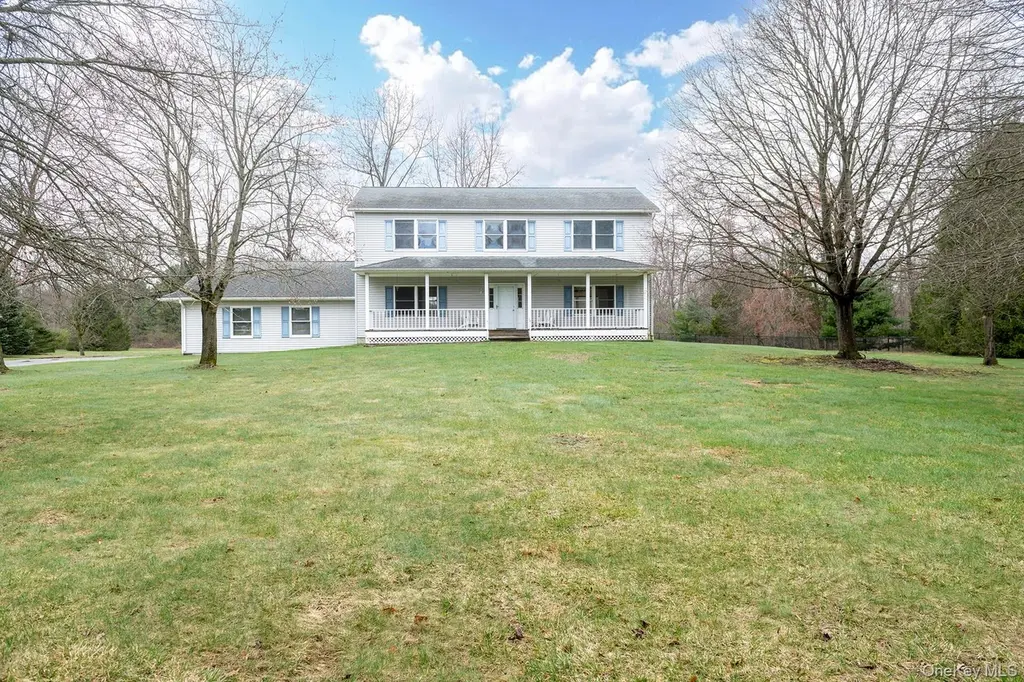
Located in scenic Dutchess County, this lovely 2.9 acres is the setting for this 2400+ square foot home that offers attractive living spaces and wonderful natural light. The comfortable interior boasts a spacious eat-in kitchen, a dining room, a family room, a living room, four bedrooms, and two and a half bathrooms. Twin double windows throughout offer great natural light, the key to making the home feel open and airy. There are ample closets and a full basement to accommodate all of your storage needs. There are terrific spaces for outdoor enjoyment and entertaining. Relax on the covered front porch or the rear deck overlooking the expansive, level, fenced backyard, tree-lined for privacy
Key facts
- Covered front porch
- 2.9 acres
- Rear deck
Tags
Property features AI
Exterior
- Parking: Attached garage; 2 garage spaces; Driveway
- Utilities: Septic tank; Private trash collection
- Home design: Single family residence; Two levels
- Construction: Vinyl siding construction
- Exterior features: Vinyl siding; Chain link fencing; Shed(s) on property; Back yard; Cleared lot; Level lot
Interior
- Kitchen: Range; Dishwasher; Refrigerator
- Bedrooms: Total rooms: 9; Attic access: full attic with pull-down stairs; Basement: full, unfinished with storage space
- Flooring: Other flooring
- Bathrooms: 2 full bathrooms; 1 half bathroom
- Heating & cooling: Baseboard heating; Oil heating; No central cooling
- Interior features: Ceiling fan(s); Eat-in kitchen; Entrance foyer; Formal dining room; Storage; Walk-in closet(s); Covered patio/porch; Deck; Porch
- Laundry & utility: Laundry room; Washer; Dryer
Neighborhood map
What this means for you Summary
Snapshot
- This is a 4-bed/2.5-bath single-family listed at $625k.
Deal economics
- At list price, monthly cash flow is $3k ($31k/yr) — positive.
- The deal already cash-flows at list — no discount required.
- Meets the 1% rule at list price ($9k rent vs $625k).
- Recommended offer: $606k (3.0% below list) — sets the bar for market timing.
- Cap rate 11.3% vs local median 2.3% in Salt Point — top-decile yield for the area; either an underpriced asset or a hidden risk that comps aren't pricing in. Stress-test before assuming the spread holds.
Location & tenants
- Location reads 34/100 on livability (#1,193 in NY) — a limited-amenity area; tenant pool skews transient or value-seeking. Strengths: crime A; Watch: amenities F, commute F, employment F.
- Millbrook Central School District (rural): math 65% / reading 63% proficiency, ranked #198 of 755 in NY (top 26%) — acceptable for families but not a draw, mixed tenant base, ~2y average lease; only 17% free/reduced lunch — higher-income household profile.
- Zoned schools: Elm Drive Elementary School (192 students, 22% FRL); Millbrook Middle School (math 42% / reading 67%, grade B-, #214 of 729 statewide, top 31%, 202 students, 37% FRL); Millbrook High School (math 87%, 271 students, 34% FRL).
- Market conditions: 38 active listings in the ZIP; 2 comparable units currently listed for rent nearby; 620 units permitted in Dutchess County in 2024 (242 in 5+ unit buildings).
Forward outlook
- In year one you build about $67k of equity ($4k loan paydown + $62k appreciation (10.0% local appreciation)).
- Dutchess County population projected at -11% by 2050 — secular population decline; favor cash flow + early exit over multi-decade hold.
- At projected returns (10.0% appreciation + 3.0% rent growth), your $175k cash investment doubles in ~2 years — after that, you're playing with house money.
- By year 2, paydown + projected appreciation supports a ~$107k cash-out refi (75% LTV) — recoverable capital for the next deal without selling this one.
Negotiation context
- It's been on market 35 days — a 3% lower offer ($606k) is reasonable based on typical stale-listing flexibility.
- 3 sale attempts since 19y ago with the ask held roughly flat each time — persistent listings suggest the price (not the market) is what's stuck; bring a comps-based counter.
- Current owner paid $435k; 44% above their basis — modest negotiation headroom, anchor on the comps not their cost.
Questions for the listing agent
- It's been on market 35 days. Have you received any prior offers? Is the seller open to a 3% concession, seller financing, or rate buy-down credit?
- Is there a deadline driving the sale (1031 exchange, divorce, estate, relocation)? That informs how much negotiation room exists.
- Schools are F-rated, which usually means shorter tenancies and higher turnover. Who's the typical renter profile here, and what's been the actual vacancy rate?
- What's the average days-on-market for RENTAL listings here right now (not sales)? A rising rental-DOM trend means longer vacancies and softer asking-rent achievability than the comps imply.
- What's the recent tenant-quality profile in this submarket — average credit score on applications, eviction rate, late-payment / NSF rate, and stable-employment percentage? A property-management company in the area should have these aggregated.
- How much new for-sale + rental construction is in the pipeline within 1–3 miles? Heavy new supply typically softens prices + rents 12–24 months out; constrained supply supports both.
Investment metrics
- 1% rule
- 1.38% ✓
- Cap rate
- 11.31%
- Cash-on-cash
- 17.93%
- DSCR
- 1.80
- GRM
- 6.0
CMA / ARV
- ARV (median comp)
- $601,658
- List price
- $625,000
- Delta
- 3.88%
- Verdict
- FAIR
- Comps
- 19 within 1.0 mi
Show comp detail 5 sales within ~0.75 mi
| Address | Dist | Beds/Ba | Sqft | Sold | Price | $/sf | Match |
|---|---|---|---|---|---|---|---|
| 391 Clinton Corners Rd | 0.47mi | 3/2.5 (-1) | 2,536 (+3%) | 7mo | $889,000 | $351 | 62 |
| 10 Ryan Ct | 0.24mi | 3/2.0 (-1) | 2,300 (-7%) | 17mo | $591,605 | $257 | 56 |
| 452 Hibernia Rd | 0.56mi | 4/3.0 | 2,104 (-15%) | 9mo | $667,500 | $317 | 40 |
| 2377 Salt Point Tpke | 0.61mi | 3/1.0 (-1) | 2,296 (-7%) | 24mo | $254,900 | $111 | 30 |
| 521 Hibernia Rd | 0.70mi | 3/2.0 (-1) | 2,216 (-10%) | 21mo | $890,000 | $402 | 26 |
Match score weights: distance 35% · size 25% · config 20% · recency 20%. Top-matched comps best support the ARV.
Projected returns pro-forma
10.0% appreciation · 3.0% rent growth · sell at horizon
- IRR
- 37.6%
- Equity multiple
- 3.90×
- Total profit
- $507,001
- Equity at exit
- $563,050
- IRR
- 32.4%
- Equity multiple
- 8.78×
- Total profit
- $1,362,202
- Equity at exit
- $1,214,238
Cash invested: $175,000 (down + closing). Projections, not guarantees.
Landlord ↔ Tenant lean methodology
- Overall (STATE)
- 15 Strongly Tenant-Friendly
- State New York
- 15 Strongly Tenant-Friendly · D+10
- County
- — inherits STATE
- City
- — inherits STATE
ZIP-level market 12514
- Home prices YoY
- 11.6%
- Active inventory
- 38
- Price-to-rent
- 6.0×
Monthly cashflow live
- Estimated rent
- $8,648 medium interval (Pro) →
- Mortgage (P&I)
- −$3,278
- Tax from tax record
- −$679 /mo · $8,150/yr
- Insurance
- −$260
- HOA
- −$0
- Vacancy / Maint / Mgmt
- −$1,816
- Net cashflow
- $2,615
Break-even live
Sensitivity live
| Price | -10% $2,969 | -5% $2,792 | +0% $2,615 | +5% $2,438 | +10% $2,261 |
|---|---|---|---|---|---|
| Rent | -10% $1,932 | -5% $2,273 | +0% $2,615 | +5% $2,956 | +10% $3,298 |
| Rate | -1.0pp $2,930 | -0.5pp $2,774 | base $2,615 | +0.5pp $2,453 | +1.0pp $2,288 |
UW: 25.0% down · 7.5% · 30yr · 1.5% tax · 5.0% vac · 8.0% maint · 8.0% mgmt
Financing live
Cash to close
- Down payment
- $156,250
- Closing costs
- $18,750
- Reserves months
- —
- Total cash needed
- —
Loan-product check · same deal, 3 products live
Conventional
25% down · 7.5% · 30yr
- Down + closing
- —
- Monthly P&I
- —
- Monthly cashflow
- —
- DSCR
- —
- Eligible?
- —
Personal DTI + credit; lowest rate.
DSCR
20% down · 8.5% · 30yr
- Down + closing
- —
- Monthly P&I
- —
- Monthly cashflow
- —
- DSCR
- —
- Eligible?
- —
No personal income docs; deal must DSCR.
Hard money
10% down · 12.0% · 12mo
- Down + closing
- —
- Monthly P&I
- —
- Monthly cashflow
- —
- DSCR
- —
- Eligible?
- —
Short-term bridge; refi at stabilization.
Rent comps 2 comps
| Address | Beds | Baths | Sqft | Rent | $/sqft | DOM | Units | Dist |
|---|---|---|---|---|---|---|---|---|
| 1539 Hollow Rd Clinton Corners, NY | 4.0 | 2.0 | 1946 | $3,500 | $1.80 | 15d | 1 | 0.49mi |
| 1282 Hollow Rd Clinton Corners, NY | 4.0 | 3.5 | 2650 | $22,000 | $8.30 | 14d | 1 | 1.48mi |
Listing history 10 events
-
2026-06-02status $625,000 Pending 35 DOM
-
2026-06-01days on market $625,000 Active 35 DOM
-
2026-05-31days on market $625,000 Active 34 DOM
-
2026-05-13status Active 1164-char remark
-
2026-05-13status Pending 1164-char remark
-
2026-04-27$625,000 Active 1164-char remark
-
2007-07-30historical
-
2007-06-11
-
2006-07-26soldstatus $435,000
-
1998-09-24soldstatus $185,000
ⓘ Source: listings_history table (triggers on properties + properties_extension) + one-shot
backfill from property_details.listing_events for pre-trigger history.
Tax reassessment forecast NY · Partial reset (capped growth)
- Current annual tax
- $8,150 · $679/mo
- Projected year-2 tax
- $9,356 · $780/mo
- Expected delta
- +$1,206/yr (+$101/mo · 14.8%)
ⓘ Screening estimate from a state-policy table — verify with the county assessor before closing.
Climate risk First Street
- Flood 1/10 Low FEMA zone X (unshaded) · 0% chance over 30 yrs
- Wildfire 3/10 Moderate
- Heat 4/10 Moderate 7 d/yr ≥98°F today · 16 d/yr by 30 yrs out
- Wind 4/10 Moderate 13% chance of damaging wind over 30 yrs
- Air quality 2/10 Low 1 unhealthy d/yr today · 3 by 30 yrs out
Nearby sold comps map
Loading sold comps map…
Walkable amenities ~0.75 mi
Loading nearby amenities…
Taxation est. · year 1
- Rental income
- $103,778
- − Mortgage interest
- −$35,010
- − Property taxes
- −$8,150
- − Insurance
- −$3,125
- − Repairs & maintenance
- −$8,302
- − Management
- −$8,302
- − Depreciation
- −$18,182
- Taxable income
- $22,707
- Est. tax owed @ 24.0%
- −$5,450
- After-tax cash flow
- $25,929/yr
For passive investors: Depreciation is non-cash, so a rental often shows a tax loss while cash-flowing — sheltering income. Rental losses are passive: they offset passive income freely, and up to $25,000/yr can offset ordinary (W-2) income if you actively participate and your MAGI is under $100k (phasing out to $0 by $150k); unused losses carry forward. On sale, claimed depreciation is recaptured at up to 25%, and gains may owe capital-gains tax (a 1031 exchange can defer both). Figures are a year-1 estimate at your 24.0% rate — not tax advice; consult a CPA.
Schools (NCES district)
- District
- Millbrook Central School District
- NCES district ID
- 3619380
- Math proficiency
- 65% ▲ 1.00%
- Reading proficiency
- 63% ▲ 5.00%
- Median HH income
- $77,504
- Composite
- 58.47/100
- National rank
- #2061
- State rank
- #198 of 755 in NY
Livability — Salt Point
- Score
- 34/100
- State rank
- #1193
- US rank
- #27748
Category grades
Schools grade is shown separately in the Schools card above.
Census & demographics
- City population
- 2,306
- Population (ZIP)
- 3,120
Population outlook (Dutchess County) Hauer SSP2
- Today (2025)
- 291,768 people
- By 2030
- 287,131 · -1.6%
- By 2040
- 274,881 · -5.8%
- By 2050
- 259,971 · -10.9%
- By 2075
- 235,366 · -19.3%
- By 2100
- 208,786 · -28.4%
Race, ethnicity, and origin ACS 2023
- Neighborhood character
- Predominantly White (94%)
- Race & ethnicity
- White 94% Hispanic / Latino 3% Two or more races 2% Asian 1%
- Common ancestry
- Romanian 5% Portuguese 4% Scotch-Irish 3%
- Foreign-born
- 3% · Canada
- Languages at home
- 97% English-only · Other Asian/Pacific 1% French/Haitian/Cajun 1% Other Indo-European 0%
Political lean MEDSL · Dutchess
- 2024 margin
- Lean D (+5.4) · D 52.7% · R 47.3%
- 2008→2024 swing
- -3.2pp toward R · 2008: 8.6pp · 2024: 5.4pp
- All cycles
- 2024: D+5.4 2020: D+9.6 2016: R+1.1 2012: D+6.6 2008: D+8.6
Not yet ingested
- Civics
- —
Market trends
- HPI YoY
- ▲ 31.24%
- Current HPI
- 300.533
- Rent YoY
- —
- Metro
- —
- State GDP YoY
- ▲ 2.60%
- F500 in state
- 92
Industry mix (Fortune 500 HQ in NY)
| Industry | F500 HQs | Revenue |
|---|---|---|
| Financial Services | 10 | $950B |
|
||
| Consumer Goods | 9 | $162B |
|
||
| Insurance | 4 | $225B |
|
||
| Telecommunications | 2 | $144B |
|
||
| Pharmaceuticals | 2 | $112B |
|
||
| Media / Entertainment | 2 | $69B |
|
||
Price history
+237.8% since first listed8 events — show timeline
- 2026-06-02 Pending — OneKey® MLS as Distributed by MLS Grid
- 2026-05-13 Relisted — OneKey® MLS as Distributed by MLS Grid
- 2026-05-13 Pending — OneKey® MLS as Distributed by MLS Grid
- 2026-04-27 Listed $625,000 OneKey® MLS as Distributed by MLS Grid
- 2007-07-30 Delisted — HGMLS
- 2007-06-11 Listed — HGMLS
- 2006-07-26 Sold (Public Records) $435,000 Public Records
- 1998-09-24 Sold (Public Records) $185,000 Public Records
Property tax history
+2.5%/yrLatest (2025): $8,150 · -1.2% YoY. Source: county tax records.
Cash-flow waterfall
monthlySold comps — $/sqft
last 12 mo · ≤1 miLoading sold comps…