 Triplex
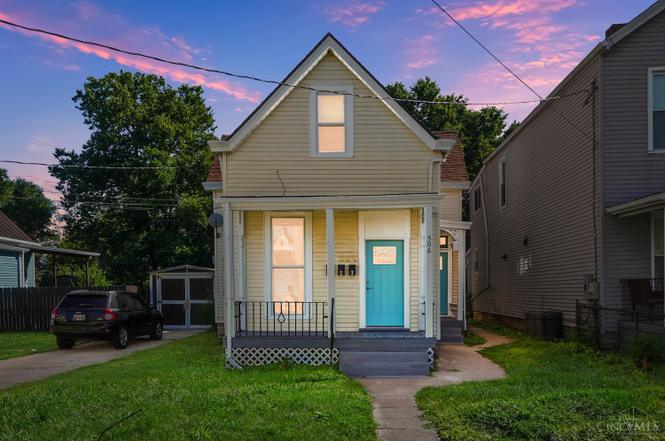
506 Maple St · Elmwood Place, OH
Flood risk 9/10 · Severe
- FEMA flood zone
- X (unshaded)
- Chance of flooding over 30 yrs
- 0.94%
- Est. flood insurance / yr
- $473 – $860
Fire risk 1/10 · Minimal
- Est. fire insurance / yr
- $713 – $1,323
Heat risk 5/10 · Moderate
- Hot days now (above 103°F)
- 7 days/yr
- Hot days in 30 yrs
- 20 days/yr
Wind risk 2/10 · Minimal
- Chance of severe wind over 30 yrs
- 1.0%
Air-quality risk 3/10 · Minor
- Unhealthy air days now
- 2 days/yr
- Unhealthy air days in 30 yrs
- 3 days/yr
Risk factors via First Street. Map © Google.
Why this score? — see what drove the B- grade
The composite is a weighted blend of 9 inputs, each scored 0–100. Each bar is that input's sub-score; the figure is the points it added to the 100-point composite (weight × sub-score).
- Cash flow +30.0/30.0
- DSCR +10.0/10.0
- 1% rule +8.6/10.0
- ARV discount +6.5/15.0
- Schools +3.5/10.0
- Livability +3.4/5.0
- Rent growth +2.5/5.0
- Condition / age +2.5/5.0
- Appreciation +0.0/10.0
$249,900
🖨 Deal sheet (PDF) 📄 Offer letter ✓ Due diligence
Multi-family units
County records classify this as Multi-Family (2-4 Unit). Listing-text estimate: 3 units. confirmed
Listing remarks
Fantastic investment opportunity with this move-in ready 3-family triplex! Offering two 1-bedroom units and one 2-bedroom unit, this property is ideal for investors or owner-occupants looking to live in one unit while generating rental income from the other two. Recent updates include new laminate flooring, fresh carpet, paint, lighting and remodeled kitchens and bathrooms. Major improvements include new electric, plumbing, appliances and hot water tank as well as the roof and furnace that are both approximately 4 years old, adding peace of mind for years to come. Whether you're looking to expand your investment portfolio or offset your mortgage with rental income, this well-maintained trip
Key facts
- New plumbing
- Remodeled kitchens
- New electric
Tags
Property features AI
Finance
- Financial info: Three-unit building (total units: 3)
Exterior
- Parking: On-street parking
- Utilities: Public water; Public sewer; Natural gas; Owner pays heat and water
- Home design: Triplex; Two levels; Multi-family zoning
- Construction: Vinyl siding exterior; Shingle roof; Block foundation; Second floor area present
- Exterior features: Porch; Wood fence
Interior
- Bedrooms: Two 1-bedroom units and one 2-bedroom unit
- Bathrooms: Three full bathrooms (one in each unit)
- Heating & cooling: Forced air heating (gas); Central air conditioning
- Interior features: Partial basement
Neighborhood map
What this means for you Summary
Snapshot
- This is a 2×1bd/1.0ba + 1×2bd/1.0ba units multifamily listed at $250k.
Deal economics
- At list price, monthly cash flow is $1k ($13k/yr) — positive. Per door: $354/mo.
- The deal already cash-flows at list — no discount required.
- Meets the 1% rule at list price ($3k rent vs $250k).
Location & tenants
- Location reads 68/100 on livability (#553 in OH) — a middle-class / working-renter tenant base. Strengths: commute A+, cost of living A+, housing B; Watch: employment D+, crime F, amenities F.
- St Bernard-Elmwood Place City (suburban): math 36% / reading 48% proficiency, ranked #529 of 656 in OH (top 81%) — families likely to look elsewhere, expect single-tenant / working-renter base with shorter leases; 69% free/reduced lunch — lower-income household profile, screen leases tightly.
- Zoned schools: Elmwood Place Elementary School (math 37% / reading 47%, grade F, #1,030 of 1,584 statewide, top 66%, 132 students, 74% FRL); St Bernard-Elmwood Place High School (math 32% / reading 47%, grade F, #528 of 781 statewide, top 71%, 351 students, 74% FRL).
- Market conditions: 17 active listings in the ZIP; 1 comparable units currently listed for rent nearby; lower-income renter base — watch delinquency; 801 units permitted in Hamilton County in 2024 (190 in 5+ unit buildings).
- At $3,404/mo this rent would consume 93% of the median local household income ($44k/yr) (locally 407% of renters already pay >50% of income on rent) — very limited rent-growth headroom before tenants either downsize or default.
Forward outlook
- Local home prices are declining (-3.0%/yr); year-one equity from $2k of loan paydown is wiped out by about $7k of value loss. Plan a longer hold.
- At projected returns (-3.0% appreciation + 3.0% rent growth), your $70k cash investment doubles in ~7 years — after that, you're playing with house money.
Negotiation context
- Only 4 days on market — expect competitive offers; lowballing is unlikely to land.
Risks & watch-outs
- Watch-outs: flood insurance adds $56/mo; built in 1870 — expect roof / HVAC / electrical / plumbing capex.
- Climate carrying-cost: severe flood risk; extreme-heat days projected 7→20/yr by 2055 (HVAC capex compounding) — expect insurance premiums to compound above CPI over the hold.
Questions for the listing agent
- Can we see the unit-by-unit rent roll, current vacancy, and any below-market leases? What's the average tenancy length?
- What capital expenditures (roof, boiler, parking lot, exteriors) have been made in the last 5 years, and what's planned in the next 2?
- Built in 1870 — when were the roof, HVAC, electrical panel, plumbing, and water heater last replaced?
- What's the actual annual flood-insurance premium (NFIP or private), and is the property in a SFHA with mandatory coverage?
- Is there a deadline driving the sale (1031 exchange, divorce, estate, relocation)? That informs how much negotiation room exists.
- Schools are F-rated, which usually means shorter tenancies and higher turnover. Who's the typical renter profile here, and what's been the actual vacancy rate?
- Crime grade is F in this area — have there been break-ins, vandalism, or insurance claims at this property in the last 3 years? What carrier currently insures it and at what premium?
- What's the average days-on-market for RENTAL listings here right now (not sales)? A rising rental-DOM trend means longer vacancies and softer asking-rent achievability than the comps imply.
- What's the recent tenant-quality profile in this submarket — average credit score on applications, eviction rate, late-payment / NSF rate, and stable-employment percentage? A property-management company in the area should have these aggregated.
- How much new apartment / multifamily construction is in the pipeline within 1–3 miles? Heavy new supply (>2% of stock underway) typically softens rents 12–24 months out; light construction supports rent growth.
Investment metrics
- 1% rule
- 1.36% ✓
- Cap rate
- 11.66%
- Cash-on-cash
- 19.16%
- DSCR
- 1.85
- GRM
- 6.1
CMA / ARV
- ARV (on-the-fly)
- $244,560
- Comps found
- 5
Show comp detail 5 sales within ~0.75 mi
| Address | Dist | Beds/Ba | Sqft | Sold | Price | $/sf | Match |
|---|---|---|---|---|---|---|---|
| 519 Maple St | 0.04mi | 4/3.0 (+1) | 2,272 (+12%) | 5mo | $272,000 | $120 | 70 |
| 1020 Elm Park Dr | 0.47mi | 4/2.0 (+1) | 2,016 (-1%) | 10mo | $322,000 | $160 | 59 |
| 112 W Sixty Fifth St | 0.17mi | 3/2.0 | 1,800 (-12%) | 14mo | $130,000 | $72 | 57 |
| 6703 Vine St | 0.37mi | 3/3.0 | 2,280 (+12%) | 16mo | $60,000 | $26 | 49 |
| 1148 Elm Park Dr | 0.61mi | 4/2.0 (+1) | 2,184 (+7%) | 19mo | $300,000 | $137 | 35 |
Match score weights: distance 35% · size 25% · config 20% · recency 20%. Top-matched comps best support the ARV.
Projected returns pro-forma
-3.0% appreciation · 3.0% rent growth · sell at horizon
- IRR
- 9.8%
- Equity multiple
- 1.39×
- Total profit
- $27,103
- Equity at exit
- $37,261
- IRR
- 18.9%
- Equity multiple
- 2.58×
- Total profit
- $110,617
- Equity at exit
- $21,607
Cash invested: $69,972 (down + closing). Projections, not guarantees.
Landlord ↔ Tenant lean methodology
- Overall (STATE)
- 73 Landlord-Friendly
- State Ohio
- 73 Landlord-Friendly · R+6
- County
- — inherits STATE
- City
- — inherits STATE
ZIP-level market 45216
- Home prices YoY
- -19.1%
- Active inventory
- 17
- Price-to-rent
- 18.9×
Monthly cashflow live
- Estimated rent
- $3,404 high interval (Pro) →
- Mortgage (P&I)
- −$1,311
- Tax from tax record
- −$157 /mo · $1,890/yr
- Insurance
- −$104
- Flood insurance flood zone
- −$56 /mo · $666/yr
- HOA
- −$0
- Vacancy / Maint / Mgmt
- −$715
- Net cashflow
- $1,061
Break-even live
Sensitivity live
| Price | -10% $1,203 | -5% $1,132 | +0% $1,061 | +5% $991 | +10% $920 |
|---|---|---|---|---|---|
| Rent | -10% $793 | -5% $927 | +0% $1,061 | +5% $1,196 | +10% $1,330 |
| Rate | -1.0pp $1,187 | -0.5pp $1,125 | base $1,061 | +0.5pp $997 | +1.0pp $931 |
3-unit breakdown (identical units grouped — click to expand)
| Units | Beds | Baths | Est. rent |
|---|---|---|---|
| 2× units | 1 | 1 | $2,204 |
| #1 | 1 | 1 | $1,102 |
| #2 | 1 | 1 | $1,102 |
| 1× unit | 2 | 1 | $1,199 |
| Total (3 units) | $3,404 | ||
UW: 25.0% down · 7.5% · 30yr · 1.5% tax · 5.0% vac · 8.0% maint · 8.0% mgmt
Financing live
Cash to close
- Down payment
- $62,475
- Closing costs
- $7,497
- Reserves months
- —
- Total cash needed
- —
Loan-product check · same deal, 3 products live
Conventional
25% down · 7.5% · 30yr
- Down + closing
- —
- Monthly P&I
- —
- Monthly cashflow
- —
- DSCR
- —
- Eligible?
- —
Personal DTI + credit; lowest rate.
DSCR
20% down · 8.5% · 30yr
- Down + closing
- —
- Monthly P&I
- —
- Monthly cashflow
- —
- DSCR
- —
- Eligible?
- —
No personal income docs; deal must DSCR.
Hard money
10% down · 12.0% · 12mo
- Down + closing
- —
- Monthly P&I
- —
- Monthly cashflow
- —
- DSCR
- —
- Eligible?
- —
Short-term bridge; refi at stabilization.
Rent comps 1 comps
| Address | Beds | Baths | Sqft | Rent | $/sqft | DOM | Units | Dist |
|---|---|---|---|---|---|---|---|---|
| 6655 Vine St Cincinnati, OH | 4.0 | 1.5 | 1550 | $1,800 | $1.16 | 25d | 1 | 0.34mi |
Listing history 3 events
-
2026-06-21days on market $249,900 Active 4 DOM
-
2026-06-17remarks 699-char remark
-
2026-06-17$249,900 Active 1 DOM
ⓘ Source: listings_history table (triggers on properties + properties_extension) + one-shot
backfill from property_details.listing_events for pre-trigger history.
Tax reassessment forecast OH · Partial reset (capped growth)
- Current annual tax
- $1,890 · $157/mo
- Projected year-2 tax
- $2,894 · $241/mo
- Expected delta
- +$1,004/yr (+$84/mo · 53.1%)
ⓘ Screening estimate from a state-policy table — verify with the county assessor before closing.
Climate risk First Street
- Flood 9/10 Extreme FEMA zone X (unshaded) · 94% chance over 30 yrs
- Wildfire 1/10 Low
- Heat 5/10 Major 7 d/yr ≥103°F today · 20 d/yr by 30 yrs out
- Wind 2/10 Low 100% chance of damaging wind over 30 yrs
- Air quality 3/10 Moderate 2 unhealthy d/yr today · 3 by 30 yrs out
Nearby sold comps map
Loading sold comps map…
Walkable amenities ~0.75 mi
Loading nearby amenities…
Taxation est. · year 1
- Rental income
- $40,848
- − Mortgage interest
- −$13,998
- − Property taxes
- −$1,890
- − Insurance
- −$1,916
- − Repairs & maintenance
- −$3,268
- − Management
- −$3,268
- − Depreciation
- −$7,270
- Taxable income
- $9,238
- Est. tax owed @ 24.0%
- −$2,217
- After-tax cash flow
- $10,521/yr
For passive investors: Depreciation is non-cash, so a rental often shows a tax loss while cash-flowing — sheltering income. Rental losses are passive: they offset passive income freely, and up to $25,000/yr can offset ordinary (W-2) income if you actively participate and your MAGI is under $100k (phasing out to $0 by $150k); unused losses carry forward. On sale, claimed depreciation is recaptured at up to 25%, and gains may owe capital-gains tax (a 1031 exchange can defer both). Figures are a year-1 estimate at your 24.0% rate — not tax advice; consult a CPA.
Schools (NCES district)
- District
- St Bernard-Elmwood Place City
- NCES district ID
- 3904471
- Math proficiency
- 36% ▼ -11.00%
- Reading proficiency
- 48% ▼ -9.00%
- Median HH income
- $41,587
- Composite
- 35.3/100
- National rank
- #4966
- State rank
- #529 of 656 in OH
Livability — Elmwood Place
- Score
- 68/100
- State rank
- #553
- US rank
- #9449
Category grades
Schools grade is shown separately in the Schools card above.
Census & demographics
- Census place
- Elmwood Place, OH
- County
- Hamilton County · 701,295 people
- Metro
- Cincinnati, OH-KY-IN
- Population (ZIP)
- 9,569
- Household income
- $44,099
- Rent vs Own
- Severe rent burden
- 407.0
Population outlook (Hamilton County) Hauer SSP2
- Today (2025)
- 826,054 people
- By 2030
- 830,947 · +0.6%
- By 2040
- 832,319 · +0.8%
- By 2050
- 822,428 · -0.4%
- By 2075
- 788,688 · -4.5%
- By 2100
- 710,674 · -14.0%
Race, ethnicity, and origin ACS 2023
- Neighborhood character
- Diverse neighborhood (Simpson 0.63)
- Race & ethnicity
- White 56% Black 20% Hispanic / Latino 15% Two or more races 10%
- Hispanic origin (detail)
- Mexican 5%
- Common ancestry
- Romanian 2% Serbian 2% Iranian 1%
- Foreign-born
- 12% · Canada, Guatemala
- Languages at home
- 88% English-only · Spanish 11%
Political lean MEDSL · Hamilton
- 2024 margin
- D (+14.9) · D 57.0% · R 42.1%
- 2008→2024 swing
- +7.9pp toward D · 2008: 7.0pp · 2024: 14.9pp
- All cycles
- 2024: D+14.9 2020: D+15.9 2016: D+9.5 2012: D+4.9 2008: D+7.0
Not yet ingested
- Civics
- —
Market trends
- HPI YoY
- ▼ -58.73%
- Current HPI
- 248.8995
- Rent YoY
- —
- Metro
- Cincinnati, OH-KY-IN
- State GDP YoY
- ▲ 1.98%
- F500 in state
- 48
Industry mix (Fortune 500 HQ in OH)
| Industry | F500 HQs | Revenue |
|---|---|---|
| Insurance | 3 | $145B |
|
||
| Industrial Machinery | 3 | $49B |
|
||
| Financial Services | 3 | $24B |
|
||
| Consumer Goods | 2 | $93B |
|
||
| Aerospace / Defense | 2 | $47B |
|
||
| Utilities | 2 | $33B |
|
||
Price history
1 event — show timeline
- 2026-06-17 Listed $249,900 Cincy MLS
Property tax history
+1.9%/yrLatest (2025): $1,890 · +1.1% YoY. Source: county tax records.
Cash-flow waterfall
monthlySold comps — $/sqft
last 12 mo · ≤1 miLoading sold comps…