 Triplex
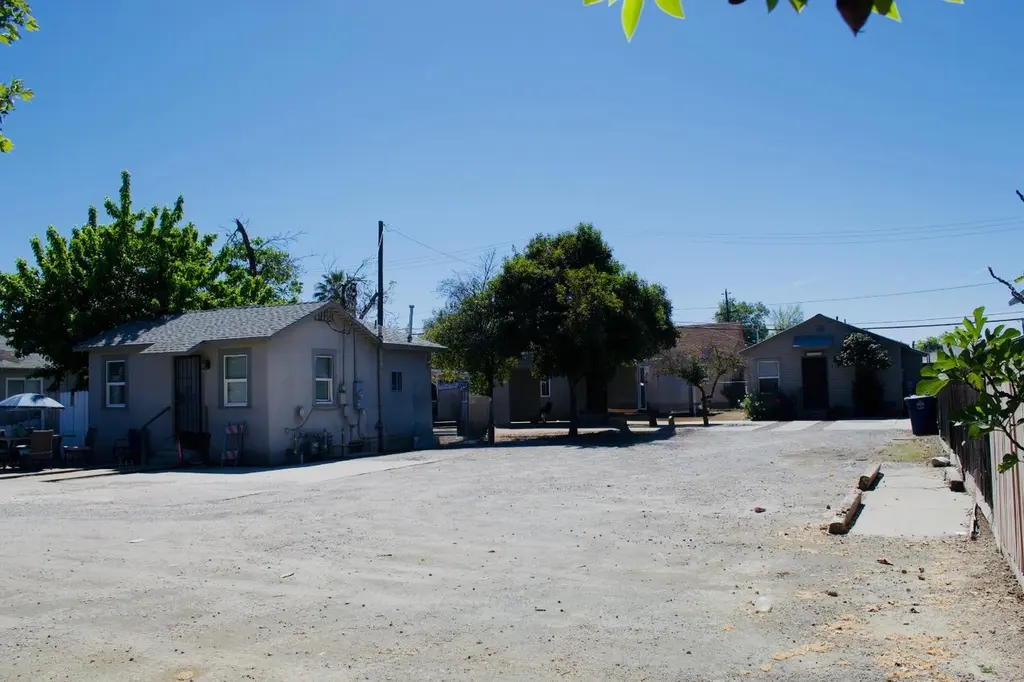
1411 Annadale Ave Unit A-C · Sanger, CA
Flood risk 1/10 · Minimal
- FEMA flood zone
- X (unshaded)
- Chance of flooding over 30 yrs
- 0.0%
- Est. flood insurance / yr
- $507 – $1,088
Fire risk 9/10 · Severe
- Est. fire insurance / yr
- $659 – $1,223
Heat risk 8/10 · Major
- Hot days now (above 106°F)
- 7 days/yr
- Hot days in 30 yrs
- 17 days/yr
Wind risk 1/10 · Minimal
- Chance of severe wind over 30 yrs
- —
Air-quality risk 10/10 · Severe
- Unhealthy air days now
- 52 days/yr
- Unhealthy air days in 30 yrs
- 58 days/yr
Risk factors via First Street. Map © Google.
Why this score? — see what drove the B- grade
The composite is a weighted blend of 9 inputs, each scored 0–100. Each bar is that input's sub-score; the figure is the points it added to the 100-point composite (weight × sub-score).
- Cash flow +28.5/30.0
- DSCR +10.0/10.0
- 1% rule +7.9/10.0
- ARV discount +7.5/15.0
- Schools +3.7/10.0
- Livability +2.9/5.0
- Rent growth +2.5/5.0
- Condition / age +2.2/5.0
- Appreciation +0.0/10.0
$410,000
🖨 Deal sheet 📄 Offer letter ✓ Due diligence
Multi-family units
County records classify this as Multi-Family (2-4 Unit). Listing-text estimate: 3 units. confirmed
Listing remarks MLS
<br>1411 Annadale Ave offers a solid, income-producing asset with all units fully occupied start collecting revenue from day one. Three separate units on one lot in an established area with steady rental demand and convenient access to everyday amenities.<br><br>This is a straightforward investment with plenty of room to grow. Minimal expenses as each is indiviually metered for water allowing tenants to pay all utilities. Hold as-is for consistent income or explore future rent increases and improvements to boost returns. A great fit for investors looking to add a performing asset in a strong Central Valley market.<br><br>Opportunities like this don't come around often reach out for details.
Key facts
- Established area
- Convenient access
- Fully occupied units
Tags
Neighborhood map
What this means for you Summary
Snapshot
- This is a 3 × 2-bed/1-bath units multifamily listed at $410k. Condition is rated fair.
Deal economics
- At list price, monthly cash flow is $1k ($16k/yr) — positive. Per door: $446/mo.
- The deal already cash-flows at list — no discount required.
- Meets the 1% rule at list price ($5k rent vs $410k).
- Recommended offer: $404k (1.5% below list) — sets the bar for market timing.
- Cap rate 10.2% vs local median 3.6% in Sanger — top-decile yield for the area; either an underpriced asset or a hidden risk that comps aren't pricing in. Stress-test before assuming the spread holds.
Location & tenants
- Location reads 58/100 on livability (#668 in CA) — a working-class tenant base; expect higher turnover. Strengths: housing A+; Watch: schools C-, employment C-, crime D+.
- Sanger Unified (town): math 22% / reading 62% proficiency, ranked #216 of 517 in CA (top 42%) — families likely to look elsewhere, expect single-tenant / working-renter base with shorter leases; 64% free/reduced lunch — lower-income household profile, screen leases tightly.
- Market conditions: 151 active listings in the ZIP; solid renter incomes; 2,426 units permitted in Fresno County in 2024 (296 in 5+ unit buildings).
- At $5,280/mo this rent would consume 80% of the median local household income ($79k/yr) (locally 878% of renters already pay >50% of income on rent) — very limited rent-growth headroom before tenants either downsize or default.
Forward outlook
- Local home prices are declining (-3.0%/yr); year-one equity from $3k of loan paydown is wiped out by about $12k of value loss. Plan a longer hold.
- Fresno County population projected at +11% by 2050 — modest demand growth; plan on rents tracking national, not racing it.
- At projected returns (-3.0% appreciation + 3.0% rent growth), your $115k cash investment doubles in ~9 years — after that, you're playing with house money.
Negotiation context
- It's been on market 21 days — a 2% lower offer ($404k) is reasonable based on typical stale-listing flexibility.
Risks & watch-outs
- Watch-outs: built in 1930 — expect roof / HVAC / electrical / plumbing capex.
- Climate carrying-cost: severe wildfire risk; extreme-heat days projected 7→17/yr by 2055 (HVAC capex compounding) — expect insurance premiums to compound above CPI over the hold.
Questions for the listing agent
- Can we see the unit-by-unit rent roll, current vacancy, and any below-market leases? What's the average tenancy length?
- What capital expenditures (roof, boiler, parking lot, exteriors) have been made in the last 5 years, and what's planned in the next 2?
- Have any recent inspections been done? Can we get a copy of the seller's disclosures and any deferred-maintenance estimates?
- Built in 1930 — when were the roof, HVAC, electrical panel, plumbing, and water heater last replaced?
- Is there a deadline driving the sale (1031 exchange, divorce, estate, relocation)? That informs how much negotiation room exists.
- Crime grade is D in this area — have there been break-ins, vandalism, or insurance claims at this property in the last 3 years? What carrier currently insures it and at what premium?
- What's the average days-on-market for RENTAL listings here right now (not sales)? A rising rental-DOM trend means longer vacancies and softer asking-rent achievability than the comps imply.
- What's the recent tenant-quality profile in this submarket — average credit score on applications, eviction rate, late-payment / NSF rate, and stable-employment percentage? A property-management company in the area should have these aggregated.
- How much new apartment / multifamily construction is in the pipeline within 1–3 miles? Heavy new supply (>2% of stock underway) typically softens rents 12–24 months out; light construction supports rent growth.
Investment metrics
- 1% rule
- 1.29% ✓
- Cap rate
- 10.21%
- Cash-on-cash
- 13.98%
- DSCR
- 1.62
- GRM
- 6.5
CMA / ARV
No comps found within radius.
Projected returns pro-forma
-3.0% appreciation · 3.0% rent growth · sell at horizon
- IRR
- 4.2%
- Equity multiple
- 1.16×
- Total profit
- $18,846
- Equity at exit
- $61,132
- IRR
- 13.7%
- Equity multiple
- 2.10×
- Total profit
- $126,448
- Equity at exit
- $35,449
Cash invested: $114,800 (down + closing). Projections, not guarantees.
Landlord ↔ Tenant lean methodology
- Overall (STATE)
- 18 Strongly Tenant-Friendly
- State California
- 18 Strongly Tenant-Friendly · D+13
- County
- — inherits STATE
- City
- — inherits STATE
ZIP-level market 93657
- Active inventory
- 151
- Price-to-rent
- 19.4×
Monthly cashflow live
- Estimated rent
- $5,280 medium interval (Pro) →
- Mortgage (P&I)
- −$2,150
- Tax est. 1.5%
- −$512 /mo · $6,150/yr
- Insurance
- −$171
- HOA
- −$0
- Vacancy / Maint / Mgmt
- −$1,109
- Net cashflow
- $1,338
Break-even live
3-unit breakdown (identical units grouped — click to expand)
| Units | Beds | Baths | Est. rent |
|---|---|---|---|
| 3× units | 2 | 1 | $5,280 |
| #1 | 2 | 1 | $1,760 |
| #2 | 2 | 1 | $1,760 |
| #3 | 2 | 1 | $1,760 |
| Total (3 units) | $5,280 | ||
UW: 25.0% down · 7.5% · 30yr · 1.5% tax · 5.0% vac · 8.0% maint · 8.0% mgmt
Financing live
Cash to close
- Down payment
- $102,500
- Closing costs
- $12,300
- Reserves months
- —
- Total cash needed
- —
Loan-product check · same deal, 3 products live
Conventional
25% down · 7.5% · 30yr
- Down + closing
- —
- Monthly P&I
- —
- Monthly cashflow
- —
- DSCR
- —
- Eligible?
- —
Personal DTI + credit; lowest rate.
DSCR
20% down · 8.5% · 30yr
- Down + closing
- —
- Monthly P&I
- —
- Monthly cashflow
- —
- DSCR
- —
- Eligible?
- —
No personal income docs; deal must DSCR.
Hard money
10% down · 12.0% · 12mo
- Down + closing
- —
- Monthly P&I
- —
- Monthly cashflow
- —
- DSCR
- —
- Eligible?
- —
Short-term bridge; refi at stabilization.
Listing history 4 events
-
2026-06-18days on market $410,000 Active 21 DOM
-
2026-06-17status $410,000 Active 20 DOM
-
2026-05-04status Pending 699-char remark
Show marketing remark (699 chars)
<br>1411 Annadale Ave offers a solid, income-producing asset with all units fully occupied start collecting revenue from day one. Three separate units on one lot in an established area with steady rental demand and convenient access to everyday amenities.<br><br>This is a straightforward investment with plenty of room to grow. Minimal expenses as each is indiviually metered for water allowing tenants to pay all utilities. Hold as-is for consistent income or explore future rent increases and improvements to boost returns. A great fit for investors looking to add a performing asset in a strong Central Valley market.<br><br>Opportunities like this don't come around often reach out for details.
-
2026-04-14$410,000 Active 699-char remark
Show marketing remark (699 chars)
<br>1411 Annadale Ave offers a solid, income-producing asset with all units fully occupied start collecting revenue from day one. Three separate units on one lot in an established area with steady rental demand and convenient access to everyday amenities.<br><br>This is a straightforward investment with plenty of room to grow. Minimal expenses as each is indiviually metered for water allowing tenants to pay all utilities. Hold as-is for consistent income or explore future rent increases and improvements to boost returns. A great fit for investors looking to add a performing asset in a strong Central Valley market.<br><br>Opportunities like this don't come around often reach out for details.
ⓘ Source: listings_history table (triggers on properties + properties_extension) + one-shot
backfill from property_details.listing_events for pre-trigger history.
Climate risk First Street
- Flood 1/10 Low FEMA zone X (unshaded) · 0% chance over 30 yrs
- Wildfire 9/10 Extreme
- Heat 8/10 Severe 7 d/yr ≥106°F today · 17 d/yr by 30 yrs out
- Wind 1/10 Low
- Air quality 10/10 Extreme 52 unhealthy d/yr today · 58 by 30 yrs out
Nearby sold comps map
Loading sold comps map…
Walkable amenities ~0.75 mi
Loading nearby amenities…
Taxation est. · year 1
- Rental income
- $63,360
- − Mortgage interest
- −$22,966
- − Property taxes
- −$6,150
- − Insurance
- −$2,050
- − Repairs & maintenance
- −$5,069
- − Management
- −$5,069
- − Depreciation
- −$11,927
- Taxable income
- $10,129
- Est. tax owed @ 24.0%
- −$2,431
- After-tax cash flow
- $13,622/yr
For passive investors: Depreciation is non-cash, so a rental often shows a tax loss while cash-flowing — sheltering income. Rental losses are passive: they offset passive income freely, and up to $25,000/yr can offset ordinary (W-2) income if you actively participate and your MAGI is under $100k (phasing out to $0 by $150k); unused losses carry forward. On sale, claimed depreciation is recaptured at up to 25%, and gains may owe capital-gains tax (a 1031 exchange can defer both). Figures are a year-1 estimate at your 24.0% rate — not tax advice; consult a CPA.
Condition & rehab AI · 5 photos
This triplex requires moderate renovations to improve its exterior and landscaping, which would significantly boost its resale and rental value.
Repairs flagged
- Major exterior siding — Significant wear and tear
- Major landscaping — Overgrown yard and debris
- Major HVAC/mechanicals — No visible photos, but likely outdated
Value-add opportunities
- Both paint exterior — Enhances curb appeal and value
- Both landscaping — Improves curb appeal and rental value
- Both HVAC/mechanicals — Improves comfort and energy efficiency
Renovation cost estimate screening
| Repair item | Severity | Est. cost |
|---|---|---|
| exterior siding · Significant wear and tear | Major | $15,000–50,000 |
| landscaping · Overgrown yard and debris | Major | $15,000–50,000 |
| HVAC/mechanicals · No visible photos, but likely outdated | Major | $15,000–50,000 |
| Total estimated repair cost · 3 items | $45,000–150,000 |
Value-add ROI direction
- Both paint exterior — Enhances curb appeal and value ↑
- Both landscaping — Improves curb appeal and rental value ↑
- Both HVAC/mechanicals — Improves comfort and energy efficiency ↑
ⓘ Cost ranges are severity-bucket heuristics (US national rule-of-thumb). Get contractor quotes + a written scope before underwriting a rehab budget.
Schools (NCES district)
- District
- Sanger Unified
- NCES district ID
- 0635250
- Math proficiency
- 22% ▼ -21.00%
- Reading proficiency
- 62% ▲ 9.00%
- Median HH income
- $57,180
- Composite
- 36.67/100
- National rank
- #4608
- State rank
- #216 of 517 in CA
Livability — Sanger
- Score
- 58/100
- State rank
- #668
- US rank
- #20675
Category grades
Schools grade is shown separately in the Schools card above.
Census & demographics
- Census place
- Sanger, CA
- County
- Fresno County · 834,801 people
- City population
- 36,205
- Metro
- Fresno, CA
- Population (ZIP)
- 36,205
- Household income
- $78,904
- Rent vs Own
- Severe rent burden
- 878.0
Population outlook (Fresno County) Hauer SSP2
- Today (2025)
- 1,042,971 people
- By 2030
- 1,072,198 · +2.8%
- By 2040
- 1,122,408 · +7.6%
- By 2050
- 1,157,251 · +11.0%
- By 2075
- 1,182,575 · +13.4%
- By 2100
- 1,105,899 · +6.0%
Race, ethnicity, and origin ACS 2023
- Neighborhood character
- Predominantly Hispanic (68%)
- Race & ethnicity
- Hispanic / Latino 68% White 25% Two or more races 17% Asian 5% Native American 2%
- Hispanic origin (detail)
- Mexican 64%
- Common ancestry
- Russian 1% Italian 1% Iranian 1%
- Foreign-born
- 19% · Canada, China
- Languages at home
- 52% English-only · Spanish 44% Other Asian/Pacific 2% Other Indo-European 1%
Political lean MEDSL · Fresno
- 2024 margin
- Toss-up / Even · D 46.5% · R 50.9% · Other 2.6%
- 2008→2024 swing
- -6.5pp toward R · 2008: 2.1pp · 2024: -4.4pp
- All cycles
- 2024: R+4.4 2020: D+7.8 2016: D+3.9 2012: R+2.9 2008: D+2.1
Not yet ingested
- Civics
- —
Market trends
- HPI YoY
- ▼ -254.86%
- Current HPI
- 366.3783
- Rent YoY
- —
- Metro
- Fresno, CA
- State GDP YoY
- ▲ 3.21%
- F500 in state
- 116
Industry mix (Fortune 500 HQ in CA)
| Industry | F500 HQs | Revenue |
|---|---|---|
| Technology | 27 | $1,492B |
|
||
| Financial Services | 3 | $174B |
|
||
| Retail | 3 | $44B |
|
||
| Insurance | 3 | $26B |
|
||
| Media / Entertainment | 2 | $115B |
|
||
| Pharmaceuticals / Biotech | 2 | $62B |
|
||
Price history
2 events — show timeline
- 2026-05-04 Pending — FRESNOMLS
- 2026-04-14 Listed $410,000 FRESNOMLS
Cash-flow waterfall
monthlySold comps — $/sqft
last 12 mo · ≤1 miLoading sold comps…