 Multi-family
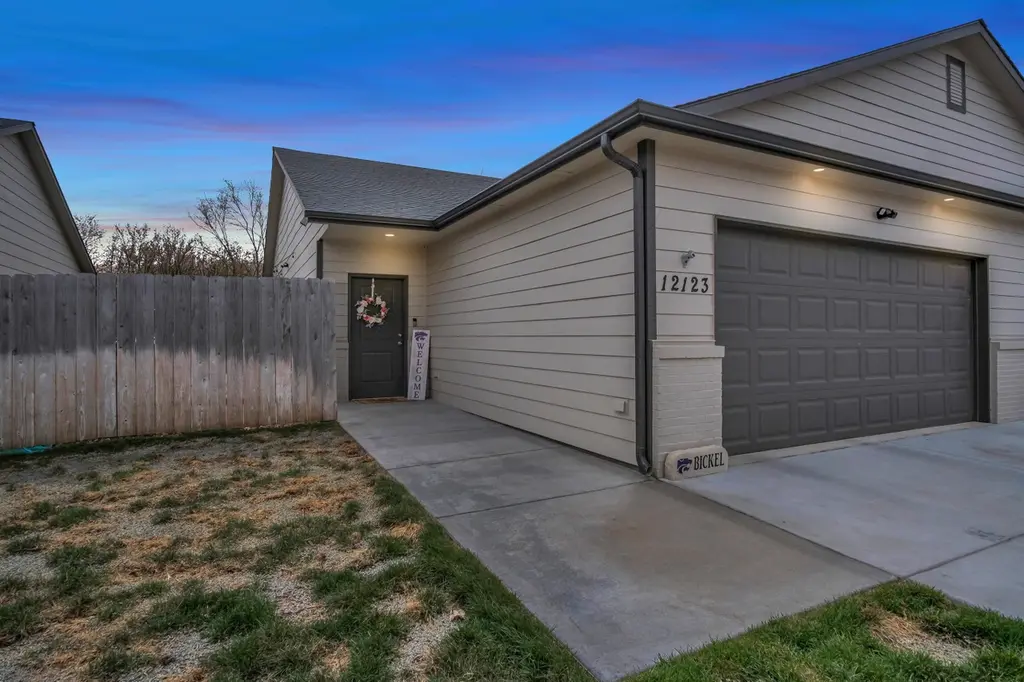
12123 W Shadow Lakes St · Maize, KS
Flood risk No data
- FEMA flood zone
- —
- Chance of flooding over 30 yrs
- —
- Est. flood insurance / yr
- —
Fire risk No data
- Est. fire insurance / yr
- —
Heat risk No data
- Hot days now (above threshold)
- —
- Hot days in 30 yrs
- —
Wind risk No data
- Chance of severe wind over 30 yrs
- —
Air-quality risk No data
- Unhealthy air days now
- —
- Unhealthy air days in 30 yrs
- —
Risk factors via First Street. Map © Google.
Why this score? — see what drove the B grade
The composite is a weighted blend of 9 inputs, each scored 0–100. Each bar is that input's sub-score; the figure is the points it added to the 100-point composite (weight × sub-score).
- Cash flow +30.0/30.0
- 1% rule +10.0/10.0
- DSCR +10.0/10.0
- ARV discount +7.5/15.0
- Condition / age +4.0/5.0
- Schools +3.8/10.0
- Rent growth +3.6/5.0
- Livability +3.6/5.0
- Appreciation +0.0/10.0
$189,000
🖨 Deal sheet (PDF) 📄 Offer letter ✓ Due diligence
Multi-family units
County records classify this as Multi-Family (2-4 Unit). Listing-text estimate: 1 unit. estimate disagrees with records
Key facts
- 3,920 sq ft lot
- 2 garage spots
- Built 2022
Property features AI
Finance
- HOA & community: Association present with $800 fee
Exterior
- Parking: 2-car garage
- Utilities: Public water; Sewer available; Natural gas available
- Home design: Duplex; One level; Slab foundation
- Construction: Composition roof
- Exterior features: Patio; Wood fencing
Interior
- Kitchen: Dishwasher
- Bathrooms: 2 full bathrooms
- Heating & cooling: Forced air heating (natural gas); Central electric air conditioning
- Interior features: Dishwasher
- Laundry & utility: Main-floor laundry
Neighborhood map
What this means for you Summary
Snapshot
- This is a 3-bed/2.0-bath multifamily listed at $189k. Condition is rated good.
Deal economics
- At list price, monthly cash flow is $1k ($12k/yr) — positive.
- The deal already cash-flows at list — no discount required.
- Meets the 1% rule at list price ($3k rent vs $189k).
- Recommended offer: $178k (6.0% below list) — sets the bar for market timing.
Location & tenants
- Location reads 71/100 on livability (#139 in KS) — a middle-class / working-renter tenant base. Strengths: cost of living A+, housing A+, crime A; Watch: employment C-, amenities F, commute F.
- Maize (rural): math 36% / reading 45% proficiency, ranked #20 of 169 in KS (top 12%) — families likely to look elsewhere, expect single-tenant / working-renter base with shorter leases; only 14% free/reduced lunch — higher-income household profile.
- Zoned schools: Vermillion Elementary School (math 40% / reading 43%, grade F, #306 of 684 statewide, top 45%, 835 students, 25% FRL); Maize Middle School (math 25% / reading 37%, grade F, #62 of 219 statewide, top 28%, 734 students, 29% FRL); Maize Sr High (math 25% / reading 26%, grade F, #98 of 327 statewide, top 30%, 1,289 students, 26% FRL).
- Market conditions: Rents rising fast (+4.4%/yr); 211 active listings in the ZIP; 7 comparable units currently listed for rent nearby; rentals at typical pace (median 16d on market — plan ~3-4 weeks tenant-placement turnaround); high-income renter base; 2,613 units permitted in Sedgwick County in 2024 (258 in 5+ unit buildings).
- This rent runs 30% of the median local income ($121k/yr) — at the standard rent-burdened threshold; future hikes will face affordability resistance.
Forward outlook
- Local home prices are declining (-3.0%/yr); year-one equity from $1k of loan paydown is wiped out by about $6k of value loss. Plan a longer hold.
- Sedgwick County population projected at +5% by 2050 — modest demand growth; plan on rents tracking national, not racing it.
- At projected returns (-3.0% appreciation + 4.4% rent growth), your $53k cash investment doubles in ~5 years — after that, you're playing with house money.
Negotiation context
- It's been on market 89 days — a 6% lower offer ($178k) is reasonable based on typical stale-listing flexibility.
- 3 sale attempts since 4y ago; this cycle's ask has dropped $16k (8%) from the opening price — seller is motivated, your offer sets the floor, not the list.
Questions for the listing agent
- It's been on market 89 days. Have you received any prior offers? Is the seller open to a 6% concession, seller financing, or rate buy-down credit?
- What does the HOA fee cover, when was the last increase, and are there any pending special assessments or reserve-fund shortfalls?
- Why hasn't it sold? Are there any deal-killer items the seller is aware of (foundation, flood, title, zoning, code violations)?
- Is there a deadline driving the sale (1031 exchange, divorce, estate, relocation)? That informs how much negotiation room exists.
- Schools are B-rated — typically a magnet for longer-tenancy family renters. What's the average tenant stay here, and is there a school-zone premium baked into asking?
- What's the average days-on-market for RENTAL listings here right now (not sales)? A rising rental-DOM trend means longer vacancies and softer asking-rent achievability than the comps imply.
- What's the recent tenant-quality profile in this submarket — average credit score on applications, eviction rate, late-payment / NSF rate, and stable-employment percentage? A property-management company in the area should have these aggregated.
- How much new apartment / multifamily construction is in the pipeline within 1–3 miles? Heavy new supply (>2% of stock underway) typically softens rents 12–24 months out; light construction supports rent growth.
Investment metrics
- 1% rule
- 1.61% ✓
- Cap rate
- 12.84%
- Cash-on-cash
- 23.37%
- DSCR
- 2.04
- GRM
- 5.2
CMA / ARV
No comps found within radius.
Projected returns pro-forma
-3.0% appreciation · 4.36% rent growth · sell at horizon
- IRR
- 18.0%
- Equity multiple
- 1.74×
- Total profit
- $39,335
- Equity at exit
- $28,181
- IRR
- 27.5%
- Equity multiple
- 3.59×
- Total profit
- $136,952
- Equity at exit
- $16,341
Cash invested: $52,920 (down + closing). Projections, not guarantees.
Landlord ↔ Tenant lean methodology
- Overall (STATE)
- 83 Strongly Landlord-Friendly
- State Kansas
- 83 Strongly Landlord-Friendly · R+10
- County
- — inherits STATE
- City
- — inherits STATE
ZIP-level market 67205
- Home prices YoY
- -18.9%
- Rents YoY
- 4.4%
- Active inventory
- 211
- Price-to-rent
- 10.3×
Monthly cashflow live
- Estimated rent
- $3,043 medium interval (Pro) →
- Mortgage (P&I)
- −$991
- Tax est. 1.5%
- −$236 /mo · $2,835/yr
- Insurance
- −$79
- HOA
- −$67
- Vacancy / Maint / Mgmt
- −$639
- Net cashflow
- $1,031
Break-even live
Sensitivity live
| Price | -10% $1,161 | -5% $1,096 | +0% $1,031 | +5% $966 | +10% $900 |
|---|---|---|---|---|---|
| Rent | -10% $790 | -5% $911 | +0% $1,031 | +5% $1,151 | +10% $1,271 |
| Rate | -1.0pp $1,126 | -0.5pp $1,079 | base $1,031 | +0.5pp $982 | +1.0pp $932 |
2-unit breakdown (identical units grouped — click to expand)
| Units | Beds | Baths | Est. rent |
|---|---|---|---|
| 2× units | 3 | 2 | $3,044 |
| #1 | 3 | 2 | $1,522 |
| #2 | 3 | 2 | $1,522 |
| Total (2 units) | $3,043 | ||
UW: 25.0% down · 7.5% · 30yr · 1.5% tax · 5.0% vac · 8.0% maint · 8.0% mgmt
Financing live
Cash to close
- Down payment
- $47,250
- Closing costs
- $5,670
- Reserves months
- —
- Total cash needed
- —
Loan-product check · same deal, 3 products live
Conventional
25% down · 7.5% · 30yr
- Down + closing
- —
- Monthly P&I
- —
- Monthly cashflow
- —
- DSCR
- —
- Eligible?
- —
Personal DTI + credit; lowest rate.
DSCR
20% down · 8.5% · 30yr
- Down + closing
- —
- Monthly P&I
- —
- Monthly cashflow
- —
- DSCR
- —
- Eligible?
- —
No personal income docs; deal must DSCR.
Hard money
10% down · 12.0% · 12mo
- Down + closing
- —
- Monthly P&I
- —
- Monthly cashflow
- —
- DSCR
- —
- Eligible?
- —
Short-term bridge; refi at stabilization.
Rent comps 7 comps
| Address | Beds | Baths | Sqft | Rent | $/sqft | DOM | Units | Dist |
|---|---|---|---|---|---|---|---|---|
| 12123 W Cora St Unit 12123 Cora Wichita, KS | 3.0 | 2.0 | 1255 | $1,495 | $1.19 | 25d | 1 | 0.10mi |
| 12198 Northstar St Wichita, KS | 3.0 | 2.0 | 1470 | $1,795 | $1.22 | 15d | 1 | 0.58mi |
| 12062 W Fennec St Wichita, KS | 3.0 | 2.0 | 1182 | $1,500 | $1.27 | 25d | 1 | 0.64mi |
| 3700 N 119th St W Wichita, KS | 3.0–5.0 | 2.0–3.0 | 1632 | $1,500 | $0.92 | 15d | 1 | 0.67mi |
| 12452 W Fennec St Wichita, KS | 4.0 | 2.0 | 1376 | $1,695 | $1.23 | 23d | 1 | 0.67mi |
| 12438 W Blanford St Wichita, KS | 4.0 | 2.0 | 1376 | $1,745 | $1.27 | 15d | 1 | 0.72mi |
| 3540 N Maize Rd Wichita, KS | 1.0–3.0 | 1.0–2.0 | 1027 | $1,616 | $1.57 | 15d | 13 | 1.40mi |
HOA detail
- Monthly dues
- $67 · $804/yr
Listing history 23 events
-
2026-06-21days on market $189,000 Active 89 DOM
-
2026-06-18days on market $189,000 Active 86 DOM
-
2026-06-17days on market $189,000 Active 85 DOM
-
2026-06-16days on market $189,000 Active 84 DOM
-
2026-06-15days on market $189,000 Active 83 DOM
-
2026-06-14days on market $189,000 Active 81 DOM
-
2026-06-13days on market $189,000 Active 80 DOM
-
2026-06-10pricedays on market $189,000 Active 78 DOM
-
2026-06-09days on market $195,000 Active 77 DOM
-
2026-06-08days on market $195,000 Active 76 DOM
-
2026-06-07days on market $195,000 Active 75 DOM
-
2026-06-05pricedays on market $195,000 Active 72 DOM
-
2026-06-03days on market $199,900 Active 71 DOM
-
2026-06-02days on market $199,900 Active 70 DOM
-
2026-06-01days on market $199,900 Active 69 DOM
-
2026-05-31days on market $199,900 Active 68 DOM
-
2026-05-30days on market $199,900 Active 67 DOM
-
2026-04-15price $199,900
-
2026-03-24$204,900 Active
-
2023-03-04status Pending
-
2023-01-27$185,000 Active
-
2023-01-27historical
-
2022-10-31$350,000 Active
ⓘ Source: listings_history table (triggers on properties + properties_extension) + one-shot
backfill from property_details.listing_events for pre-trigger history.
Nearby sold comps map
Loading sold comps map…
Walkable amenities ~0.75 mi
Loading nearby amenities…
Taxation est. · year 1
- Rental income
- $36,516
- − Mortgage interest
- −$10,587
- − Property taxes
- −$2,835
- − Insurance
- −$945
- − Repairs & maintenance
- −$2,921
- − Management
- −$2,921
- − HOA
- −$804
- − Depreciation
- −$5,498
- Taxable income
- $10,004
- Est. tax owed @ 24.0%
- −$2,401
- After-tax cash flow
- $9,969/yr
For passive investors: Depreciation is non-cash, so a rental often shows a tax loss while cash-flowing — sheltering income. Rental losses are passive: they offset passive income freely, and up to $25,000/yr can offset ordinary (W-2) income if you actively participate and your MAGI is under $100k (phasing out to $0 by $150k); unused losses carry forward. On sale, claimed depreciation is recaptured at up to 25%, and gains may owe capital-gains tax (a 1031 exchange can defer both). Figures are a year-1 estimate at your 24.0% rate — not tax advice; consult a CPA.
Condition & rehab AI · 13 photos
This multi-family home is in good condition with no major repairs needed. It has a good roof, exterior, and interior, and could benefit from some landscaping and painting to further enhance its value.
Value-add opportunities
- Both Landscaping — A well-maintained yard enhances curb appeal and property value
- Both Painting — Fresh paint can improve the home's appearance and value
- Both Landscaping — A well-maintained yard enhances curb appeal and property value
Renovation cost estimate screening
Value-add ROI direction
- Both Landscaping — A well-maintained yard enhances curb appeal and property value ↑
- Both Painting — Fresh paint can improve the home's appearance and value ↑
- Both Landscaping — A well-maintained yard enhances curb appeal and property value ↑
ⓘ Cost ranges are severity-bucket heuristics (US national rule-of-thumb). Get contractor quotes + a written scope before underwriting a rehab budget.
Schools (NCES district)
- District
- Maize
- NCES district ID
- 2009140
- Math proficiency
- 36% ▼ -6.00%
- Reading proficiency
- 45% ▼ -4.00%
- Median HH income
- $87,686
- Composite
- 38.48/100
- National rank
- #4184
- State rank
- #20 of 169 in KS
Livability — Maize
- Score
- 71/100
- State rank
- #139
- US rank
- #6865
Category grades
Schools grade is shown separately in the Schools card above.
Census & demographics
- Census place
- Maize, KS
- County
- Sedgwick County · 432,957 people
- City population
- 6,941
- Metro
- Wichita, KS
- Population (ZIP)
- 20,098
- Household income
- $121,245
- Rent vs Own
- Severe rent burden
- 385.0
Population outlook (Sedgwick County) Hauer SSP2
- Today (2025)
- 537,014 people
- By 2030
- 546,984 · +1.9%
- By 2040
- 559,141 · +4.1%
- By 2050
- 562,027 · +4.7%
- By 2075
- 557,255 · +3.8%
- By 2100
- 513,383 · -4.4%
Race, ethnicity, and origin ACS 2023
- Neighborhood character
- Predominantly White (83%)
- Race & ethnicity
- White 83% Two or more races 8% Hispanic / Latino 7% Asian 3%
- Hispanic origin (detail)
- Mexican 4% Salvadoran 1%
- Common ancestry
- Lithuanian 4% Italian 3% Iranian 2%
- Foreign-born
- 4% · Canada, Vietnam, Dominican Republic
- Languages at home
- 94% English-only · Spanish 3% Vietnamese 1% Chinese 0%
Political lean MEDSL · Sedgwick
- 2024 margin
- R (+13.8) · D 42.3% · R 56.1% · Other 1.6%
- 2008→2024 swing
- -1.1pp toward R · 2008: -12.7pp · 2024: -13.8pp
- All cycles
- 2024: R+13.8 2020: R+12.6 2016: R+19.1 2012: R+19.7 2008: R+12.7
Not yet ingested
- Civics
- —
Market trends
- HPI YoY
- ▼ -48.67%
- Current HPI
- 209.3886
- Rent YoY
- ▲ 4.36%
- Metro
- Wichita, KS
- State GDP YoY
- —
- F500 in state
- 0
Price history
-42.9% since first listed6 events — show timeline
- 2026-04-15 Price Changed $199,900 SCKMLS as Distributed by MLS Grid
- 2026-03-24 Listed $204,900 SCKMLS as Distributed by MLS Grid
- 2023-03-04 Pending — SCKMLS as Distributed by MLS Grid
- 2023-01-27 Listing Removed — SCKMLS as Distributed by MLS Grid
- 2023-01-27 Listed $185,000 SCKMLS as Distributed by MLS Grid
- 2022-10-31 Listed $350,000 SCKMLS as Distributed by MLS Grid
Cash-flow waterfall
monthlySold comps — $/sqft
last 12 mo · ≤1 miLoading sold comps…